I. INTRODUCTION
High energy density, long cycle life, and low-cost lithium-ion batteries (LiB) are important for the development of electrical vehicles and portable devices. Reference Armand and Tarascon1,Reference Whittingham2 Many candidate electrode materials with improved LiB electrode performance focus on increased loading capacity, greater cyclability, and capacity retention after many charge–discharge cycles. Reference Smith, Burns, Zhao, Xiong and Dahn3–Reference Smith, Dahn, Burns and Dahn8 Among these materials, readily available and inexpensive silicon is considered as a promising alternative to graphitized carbon as the anode material for modern LIBs because of its higher loading capacity and reduced safety concern. Reference Kasavajjula, Wang and Appleby9 However, the large volume expansion (>300%) during the lithiation process leads to the pulverization of silicon particles (>200 nm), the disruption of electron-conducting paths and considerable microstructural reorganization. As a result, crystalline silicon electrodes tend to lose reversible capacity very rapidly. Reference Zhang10–Reference Gu, Li, Li, Hu, Zhang, Xu, Thevuthasan, Baer, Zhang, Liu and Wang13
To overcome the pulverization problem, considerable effort has been devoted to the development of nanostructured Si anode materials. Mesoporous silicon sponge (MSS) with its preformed meso/macro pore structures has been demonstrated in a recent study by in situ transmission electron microscopy (TEM) and continuum media mechanical calculations as a robust anode material to accommodate the large volume expansion that accompanies the lithiation process. Reference Li, Gu, Hu, Kennard, Yan, Chen, Wang, Sailor, Zhang and Liu14 MSS has a highly porous structure with thin crystalline Si walls surrounding pores on the order of 50 nm in size. In situ TEM measurements showed that the volume change during the charge/discharge process is primarily accommodated by swelling of the inner pore walls in the MSS, leading to only about 30% expansion of the full particle size instead of the >300% expansion typically seen with nonporous Si micro-crystals. Importantly, the MSS particles were found to not pulverize even after 1000 charge/discharge cycles. The MSS anodes exhibited excellent electrochemical performance with high capacity, good capacity retention, and less irreversible capacity loss. It is clear that the unique pore structure of MSS plays an important role in the improved electrochemical performance of these electrodes.
The porosity including size, geometry, and connectivity of the pores in most materials, even in ordered mesoporous silicon, is complex and characterized by interconnected cages, channels, and micropores. Reference Moudrakovski, Terskikh, Ratcliffe, Ripmeester, Wang, Shin and Exarhos15 As a result of these complex topographies, characterizing the connectivity of pores in nano- or meso-porous materials is often challenging and requires the application of several methods. Techniques such as small angle X-ray or neutron scattering, nano X-ray tomography, transmission electron microscopy, and N2 adsorption are powerful in characterizing the pore size and geometry; however, they do not provide direct information on how the pores, channels, or cages are connected.
129Xe NMR has been proved to be a powerful and robust method for studying porous solids. Reference Ripmeester16 The 129Xe NMR chemical shift is strongly dependent on the local pore environments including the geometry, size, and connectivity of the resident void spaces. Reference Ripmeester16–Reference Driehuys, Cates, Miron, Sauer, Walter and Happer21 The use of optical pumping for the production of hyperpolarized (HP) xenon allows for a dramatic increase in the sensitivity of 129Xe NMR (up to a factor of 104), enabling these pore characterization studies. Reference Ruset, Ketel and Hersman22 Using HP 129Xe produced under CF conditions makes it possible to perform the measurement with very low steady-state concentrations of Xe, which minimizes the contribution from Xe–Xe interactions to the observed chemical shift. As such, the observed 129Xe chemical shifts can be assigned principally to interactions between isolated Xe atoms and the porous surfaces they encounter. Reference Moudrakovski, Nossov, Lang, Breeze, Ratcliffe, Simard, Santyr and Ripmeester23,Reference Moudrakovski, Wang, Baumann, Satcher, Exarhos, Ratcliffe and Ripmeester24 Since spin polarized Xe gas percolates through the interconnected pores and samples the local pore environments, the unique advantage of HP 129Xe NMR technique compared with other experimental methods such as small angle X-ray, neutron scattering, and gas adsorption is that HP 129Xe MNR directly probes the connectivity among the pores in addition to the structure and size of the pores.
In this study, temperature dependent hyperpolarized (HP) 129Xe NMR was applied to study the porosity and connectivity of four different MSS materials with varying pore and particle sizes. These materials were also characterized by TEM, SEM, and nitrogen adsorption. The results from this study demonstrates that HP 129Xe NMR is a unique and powerful tool for providing fingerprints of the structure and connectivity of the pores for each MSS material, complementary to other characterization techniques. Since the porosity and connectivity among micro- and nano-pores play an important role in the performance of porous electrode materials, the information obtained from this study will help us gain a better understanding of chemical and mechanical degradation mechanisms in Si anode materials.
II. EXPERIMENTAL
A. MSS material preparation
MSS materials, 20n50μ (20 nm pore size, >50 μm particle size), 20n5μ (20 nm pore size, 5 μm particle size), 50n50μ (50 nm pore size, >50 μm particle size), and 50n5μ (50 nm pore size, 5 μm particle size), were prepared by constant current anodization of heavy boron-doped p-type (<1 mΩ-cm resistivity) polished (100 face) single crystal silicon wafers in ethanolic hydrofluoric acid electrolytes. The pore size was controlled by the composition of electrolytes whereas the particle size was determined by the duration of the etching (the indicated pore and particle sizes in each material were estimated based on the etching conditions and SEM images). Prior to the preparation of porous layers, the wafer surfaces were cleaned using a sacrificial etch consisting of brief (180 s, 87.1 mA/cm2) electrochemical anodization in an electrolyte consisting of 3:2 (v:v) 48% aqueous HF:EtOH, followed by ethanol rinse, then dissolution of the porous film with aqueous KOH (1 M). The wafer was rinsed with water, then ethanol. Electrolyte compositions of 3:2 (v:v) and 1:1 (v:v) 48% aqueous HF:EtOH were used to prepare the materials with 20 nm (20n50μ, 20n5μ) and 50 nm (50n50μ, 50n5μ) pore sizes, respectively (Fig. S1 in Supplementary Material).
For the preparation of 5 μm particle size samples (20n5μ, 50n5μ), the etching waveform consisted of a square wave in which a lower value of current density of 87.1 mA/cm2 was applied for 120 s, followed by higher value of current density of 174.2 mA/cm2 for 0.636 s, and lower values of current density of 0 A/cm2 was applied for 30 s. This waveform was repeated for 70 cycles, generating a perforated porous silicon film with alternating layers. For the preparation of >50 μm particle size samples (20n50μ, 50n50μ), the etching waveform consisted of a square wave in which a value of current density of 87.1 mA/cm2 was applied for 6000 s.
The 20 nm pore size films (20n5μ, 20n50μ) were removed from the silicon wafer using a lift-off procedure by application of a current pulse of 4.36 mA/cm2 for 500 s in an electrolyte composed of 1:29 (v:v) 48% aqueous HF:EtOH. However, lift-off procedure for the 50 nm pore size films (50n5μ, 50n50μ) is not required.
The freestanding porous Si film was then fractured by sonication (50T, VWR International, Radnor, Pennsylvania) for 90 min in ethanol, and the resulting colloidal dispersion of porous silicon microparticles was allowed to settle at room temperature overnight. The upper 30% portion of the colloidal dispersion was discarded, and the remaining portion was filtered through filter paper (Whatman, Cat. No. 1002-070, GE Healthcare Life Sciences, Pittsburgh, Pennsylvania). The filter paper was dried, and the brown colored particles were collected from the paper and used without further purification.
B. Physical characterization of MSS materials
Scanning electron microscope (SEM) images were obtained with a Philips XL30 ESEM field-emission instrument (FEI Company, Hillsboro, Oregon) operating in secondary electron imaging mode. Transmission electron microscope (TEM) images were obtained on a 120-keV JEOL-1200 instrument (JEOL USA Inc., Peabody, Massachusetts). Nitrogen adsorption–desorption isotherms of the MSS materials were recorded at 77 K using a Micromeritics ASAP 2020 instrument (Micromeritics, Norcross, Georgia). Prior to the nitrogen adsorption experiment, the MSS materials were degassed under vacuum overnight. The surface area of the material was measured by the BET (Brunnauer–Emmett–Teller) method.
C. Hyperpolarized (HP) 129Xe NMR
HP 129Xe NMR experiments were carried out on a Bruker Advance DSX 300 spectrometer (Bruker Corporation, Billerica, Massachusetts) operating at 82.98 MHz (magnetic field 7.05 T) using a variable temperature static probe with a CF of HP xenon. For HP 129Xe NMR experiments, a single-pulse (SP) Bloch-decay method was used and samples of MSS materials were loaded into 7 mm Zirconia rotors. The rotor cap that contains a small-drilled hole allows HP 129Xe gas to pass into the materials by means of small plastic tubing. The HP 129Xe NMR experiments were performed without spinning. SP spectra were collected with a 1 µs 129Xe pulse, and a repetition delay of 0.5 s.
A custom built HP 129Xe NMR polarizer was used for all HP 129Xe NMR experiments. The design of this high efficiency polarizer was based on a report by Hersman and co-workers. Reference Ruset, Ketel and Hersman22 Unlike most of the HP Xe polarizers currently in use, this design maintains a low-pressure environment to enable efficient transfer of spin from the excited Rb electron manifold to the Xe nucleus. Efficient pumping from the diode laser (100 W at 795 nm) was provided by means of a long path-length cell (1 m), high Rb vapor density, and by counter flowing the spin exchanged optically pumped (SEOP) gas in a direction opposite to that of the laser propagation direction. This arrangement achieved a high polarization rate, even at high flow velocity. A xenon–helium–nitrogen mixture with a volume composition of 1–66–33 was used in all CF HP experiments. The flow rate was maintained at approximately 300 s/min (gas flow normalized to standard conditions). In the CF HP experiments, the HP xenon flow was delivered directly from the polarizer to the coil region of the NMR probe through 1.5 mm ID plastic tubing. Variable temperature NMR experiments in the 173–353 K range were performed using a liquid nitrogen cooling assembly and PID temperature controller. All measured 129Xe NMR chemical shift data were referenced to the free xenon gas chemical shift at 0 ppm.
III. RESULTS AND DISCUSSION
A. TEM, SEM, and BET results
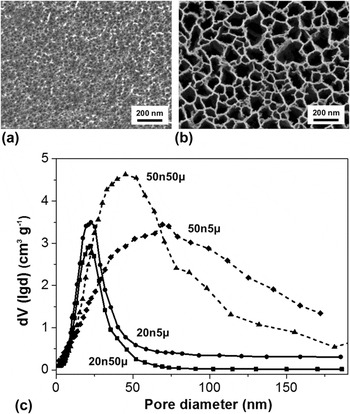
SEM images along with BET pore size distribution plots are given in Fig. 1 for four MSS materials (additional TEM and SEM images are shown in Figs. S2–S4). Both 20 nm pore size materials (20n50μ and 20n5μ) appear to have more uniform pores than those of the 50 nm pore size materials (50n50 and 50n5μ). A substantially broader pore size distribution for the 50 nm pore size materials is shown in the nitrogen adsorption measurement than the 20 nm pore size materials. However, this trend is not particularly dependent on particle size. The BET surface areas and the BJH average pore sizes are given in Table SI (Supplementary Material) where all samples displayed substantial surface areas of >350 m2/g.
Characterization of morphology for the MSS materials by scanning electron microscopy (SEM) and nitrogen adsorption analysis. (a, b) Plan view of 20 nm (20n5μ) and 50 nm (50n5μ) pore size materials, respectively. Scale bar: 200 nm. See Figures in Supporting Material for 20n50μ and 50n50μ. (c) Pore size distribution of materials using BJH adsorption model: dV/dlog(D) versus pore diameter values.

B. HP 129Xe NMR at 300 K
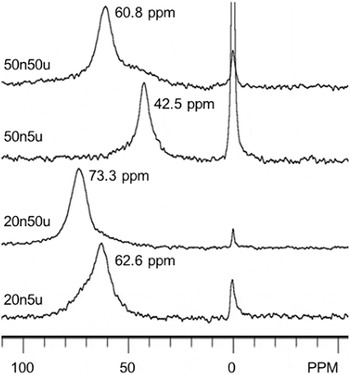
The CF HP 129Xe NMR spectra taken at 300 K for 20n50μ, 20n5μ, 50n50μ, and 50n5μ materials are displayed in Fig. 2. Spectra were obtained under identical conditions to examine any changes of chemical shifts caused by the change of particle sizes and pore sizes in the MSS materials. The observed 129Xe NMR signal for adsorbed Xe is the weighted average among various pore environments sampled by a Xe atom within its characteristic diffusion distance. The narrow 0 ppm peak is associated with the free Xe gas and the broader peaks at higher chemical shifts are associated with adsorbed Xe on the MSS materials. The very low partial pressures of Xe in the flowing gas mixtures (around 10 mbar, or 1% of total) preclude contributions from Xe–Xe interactions; thus the spectra can be considered as characteristic of the resident framework and the surface. Moreover, the very low Xe concentration also reduces the rate of exchange between the different adsorption regions, which makes it possible to detect inhomogeneity in the pore space of the materials.
CF HP 129Xe NMR spectra taken at 300 K for the four MSS materials studied.

Figure 2 also shows that each of the four MSS materials has its characteristic 129Xe NMR resonance peak with varying line shapes, linewidths, and chemical shifts, whereas TEM, SEM, and BET results did not exhibit such different pore environments among four samples. The 20n50μ and 50n5μ materials display narrower linewidths than those of 20n5μ and 50n50μ samples, and spectra of the 50n50μ and 20n5μ materials show broad shoulders at lower and higher chemical shifts, respectively, with respect to their main resonance peaks. The chemical shifts associated with the adsorbed Xe within the structure of the materials follow the trend: 73.3 ppm (20n50μ) > 62.6 ppm (20n5μ) > 60.8 ppm (50n50μ) > 42.5 ppm (50n5μ). Thus the chemical shift decreases with increasing pore size, and for a given pore size, the chemical shift decreases with decreasing particle size. The chemical shift of adsorbed Xe is known to correlate with the characteristic size of the pore space. Reference Terskikh, Moudrakovski and Mastikhin26,Reference Ripmeester and Ratcliffe27 For materials with similar particle sizes, pore structures and compositions of the surface, the higher chemical shift of adsorbed Xe is associated with the smaller pores. Therefore, the present data are consistent with the prior literature in terms of the relationship between pore size and 129Xe chemical shift. The trend in chemical shift as a function of particle size is interpreted in terms of diffusional exchange of xenon between the interior of the particle and the exterior. The smaller particles are expected to display an increased exchange of Xe within the pores and on the outer particle surface, giving rise to an up-field shift of the resonance signal. Thus the chemical shifts for the 50 μm size particles (20n50μ, 50n50μ) are larger than those of the 5 μm particles (20n5μ, 50n5μ) with the same pore sizes.
A dominant peak at a chemical shift between 42 and 73 ppm was shown in Fig. 2 for all MSS samples, whereas two peaks of equal intensity were observed at 45 and 65 ppm in a previous two-dimensional exchange spectroscopy (EXSY) HP 129Xe NMR study Reference Knagge, Smith, Smith, Buriak and Raftery25 of one Si sample (20 μm average particle size, 20 nm average pore size, and surface area of 260 m2/g). The different pore environment observed between this and the previous studies is most likely due to the variation in materials preparation. Due to the extremely high sensitivity of 129Xe NMR to any subtle or large changes in the pore structure and connectivity of the pores, HP 129Xe NMR taken at room temperature alone can be used as a quick survey to check if samples have similar pore environments despite their similar SEM, TEM, and BET results. Since certain material properties such as catalytic and ion transport properties are largely dependent on the porosity and connectivity of the pores, a subtle difference in the pore environment could greatly influence the material’s property. Thus, the room temperature HP 129Xe NMR is especially useful for assuring the reproducibility of porosity and connectivity for porous materials prepared under similar conditions.
C. Parameters derived from variable temperature HP 129Xe NMR
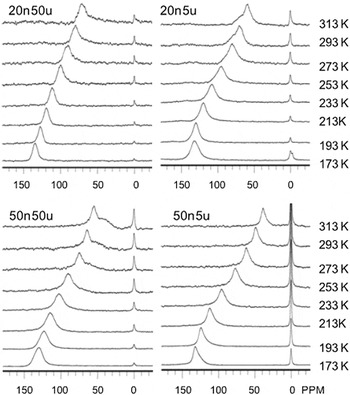
In addition to the room temperature HP 129Xe NMR measurements, temperature dependent HP 129Xe NMR spectra obtained under CF conditions were used to obtain more detailed information on the pore structure, uniformity of the adsorption sites and the pore connectivity for a set of four MSS samples varying in average pore and particle size. Figure 3 displays temperature dependent CF HP 129Xe NMR spectra for 20n5μ, 20n50μ, 50n5μ, and 50n50μ samples. Variations in 129Xe NMR spectra with temperature are related to the dynamics of adsorbed Xe and the morphology of the pore space. For all materials studied, it is clearly observed that NMR peaks associated with adsorbed Xe move toward higher chemical shifts with decreasing temperatures.
CF HP 129Xe NMR spectra of four MSS materials taken at different temperatures.

The temperature dependence of the chemical shift data can be used to obtain physical parameters related to the adsorption properties of materials. Variations in the 129Xe chemical shifts with temperature can be fit to extract parameters related to the adsorption properties using a model based upon Henry’s Law, as described previously. Reference Terskikh, Moudrakovski and Mastikhin26 In the fast exchange approximation with weak adsorption, the temperature dependence of the observed chemical shifts for arbitrary pore sizes can be expressed as:
 $$\delta = {\delta _S}\left( {1 + {B \over {R\sqrt T }}{{\rm{e}}^{ - {{\Delta {H_{{\rm{ads}}}}} \over {RT}}}}} \right)^{-1},\;B = {{{V_{\rm{g}}}} \over {S{K_0}}}\quad ,$$
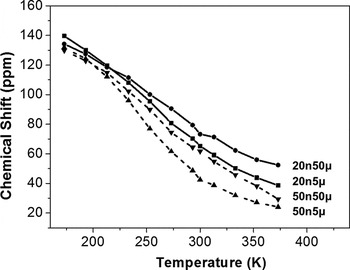
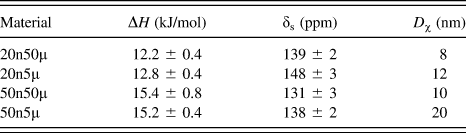
where V g is the free volume inside the porous material, T is the temperature, S is the specific surface area, K 0 is the pre-exponential term of Henry’s constant, R is the universal gas constant, H ads is the heat of adsorption and δs is the component of the observed 129Xe chemical shift characteristic of the interaction between xenon and the surface. Although Eq. (1) contains 3 variables, in reality only two parameters, H and V g/S, have a pronounced variation and effect on the fit. The situation is further simplified as the possible range of δs is very well defined from the low temperature measurements. Thus a strongly constrained δs effectively reduces the problem to a two-parameter fit. We also note that the ranges over which the other variables in the equation can change are also well constrained. Considering the rather broad temperature range studied, we believe the results of the fit are sufficiently reliable. The applicability and limitations of Eq. (1) for analysis of the temperature dependence of the 129Xe chemical shift have been discussed previously. Reference Terskikh, Moudrakovski and Mastikhin26–Reference Terskikh, Moudrakovski, Breeze, Lang, Ratcliffe, Ripmeester and Sayari28 The temperature dependence of chemical shift curves and the data used to fit Eq. (1) are displayed in Fig. 4. The temperature regions used to fit the original data were from 173 K to 373 K. The values of H ads and δs of the materials are given in Table I. The values of δs among all four MSS materials range from 131 ppm to 148 ppm. The H ads values observed for all the materials are 12–16 kJ/mol, which is consistent with what is generally seen for physical adsorption of Xe on solid surfaces.
Chemical shift as a function of temperature for the four MSS materials studied. Data obtained from the spectra of Fig. 3.


Using empirical chemical shift-pore size correlations [Eq. (9) from Ref. Reference Moudrakovski, Terskikh, Ratcliffe, Ripmeester, Wang, Shin and Exarhos15] developed to fit inorganic systems such as MCMs and zeolites, Reference Moudrakovski, Terskikh, Ratcliffe, Ripmeester, Wang, Shin and Exarhos15,Reference Wang, Wang, Liu, Exarhos, Pawsey and Moudrakovski29 pore size estimates of the nano-composite materials were made using a geometrical model. The sizes, D χ, reported in Table I are derived in the context of a cylindrical model and are to be treated as approximations. Since TEM and SEM images shown in Figs. 1 and S2–S4 show large cylindrical pore channels present in MSS materials, it is reasonable to make a cylindrical pore assumption. The pore sizes should be regarded with caution, as there may be an unaccounted scaling factor due to differences in the chemical composition. However, we believe that it is sufficiently reliable to provide a comparison of the characteristic pore sizes relevant to the 129Xe NMR measurement. For a given model, the resonance with a larger chemical shift often corresponds to a smaller pore size.
D. Pore size, uniformity, and connectivity
The pore sizes calculated from the cylindrical model of Table I shows that pore sizes for all four materials are in the range from 8 to 20 nm, which are much smaller than the corresponding mesoporous channels observed in Figs. 1 and S2–S4 using SEM, TEM, or nitrogen adsorption measurements. The smaller pore sizes given in Table I suggest the presence of micropores in addition to the cylindrical mesoporous channels in the framework of the MSS materials. Although 50n5μ and 50n50μ MSS materials display similar SEM and TEM images with the average pore sizes of about 50 nm and similar BJH pore sizes of 22–24 nm (Table SI), the pore sizes determined from the 129Xe NMR data are very different, 10 nm for 50n50μ versus 20 nm for 50n5μ. We attribute the large difference in pore sizes for 50n5μ and 50n50μ materials to the presence of micro-pores with varying densities and sizes in the framework, which weights the 129Xe NMR measurement to the lower pore size values.
The temperature dependent line-shape and linewidth of adsorbed Xe peaks can be used to assess the comparative uniformity and interconnectivity of the pores among four MSS sample types. 2D chemical shift exchange HP 129Xe NMR was used to examine the connectivity between micro- and meso-pores in organic aerogels in our previous study Reference Moudrakovski, Wang, Baumann, Satcher, Exarhos, Ratcliffe and Ripmeester24 where the exchange between regions with different chemical shifts (two resonance peaks associated with micro and meso pores, respectively) manifests itself in the appearance of cross-peaks between the signals from the sites in exchange. The intensities of the cross-peaks are proportional to the exchange time (τ) set in the experimental pulse sequence. The connectivity of these two types of pores was evaluated by the evolution of the intensity of the cross-peaks as a function of exchange time (τ). However, 2D chemical shift exchange HP 129Xe NMR is not applicable in this study to examine the connectivity among different pores since only one adsorbed Xe peak was observed as shown in Fig. 2. Thus, in this study, the temperature dependent HP 129Xe NMR is used to obtain the information on connectivity of the pores instead of 2D chemical shift exchange HP 129Xe NMR. Figure 3 shows a single resonance peak of adsorbed Xe at all temperatures for 20n50μ and 50n5μ materials, whereas one large resonance peak with smaller shoulder peak was observed for the 20n5μ and 50n50μ materials at temperatures above 273 K. These shoulder peaks become less noticeable and merge into a single peak at temperatures below 253 K. Figure 3 also shows that the Xe peaks at lower temperatures are reasonably narrow with some minor variations among the four materials (see Tables SII–SV in Supplementary Material). The linewidths at low temperatures follow the trend: 50n50μ > 20n5μ > 50n5μ > 20n50μ. Since at low temperatures Xe principally occupies the smaller micropores, the broadness of the peaks is most likely attributed to the pore heterogeneity, and the order in linewidths suggests that the order of the homogeneity in the micropores in these samples is: 50n50μ < 20n5μ < 50n5μ < 20n50μ. As the temperature increases, Xe enters the larger mesopores and undergoes fast exchange with the different pore environments. Thus the linewidths at higher temperature are related to the uniformity of larger mesopore channels and the connectivity among the different pores. The broader linewidths and shoulder peaks found in the 20n5μ and 50n50μ materials at higher temperatures indicate that there are at least two different mesopore environments in these materials. Narrower peaks observed at higher temperatures for 20n50μ and 50n5μ than those for 20n5μ and 50n50μ suggest greater uniformity and connectivity among the different pore environments in the 20n50μ and 50n5μ samples than in the 20n5μ and 50n50μ materials.
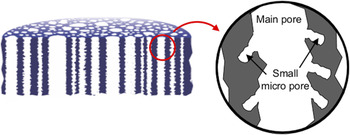
Based on our 129Xe NMR and SEM data, a schematic model of porous structure for MSS materials is illustrated in Fig. 5. The micropores must be present in the same phase as the mesopores, i.e., within the same grain, and likely are present as pockets along the mesopore channel walls, as shown in Fig. 5. This model is consistent with the current understanding of pore morphology in porous Si prepared from highly doped p-type wafers. Reference Canham and Canham30,Reference Loni and Canham31 The pore size given in Table I should be much smaller than the mesopore channels observed in SEM images since derived pore sizes from the 129Xe NMR data are the average of both smaller micropore and larger meso-pore channels sampled by Xe. However, our model is different from the previous one where two different mesopore sizes are proposed based on the chemical exchange rates of two peaks observed at 45 ppm (corresponding to a large pore of 18.5 nm) and 64 ppm (corresponding to a smaller pore channel of 9.5 nm) from the measurement of one porous Si sample. Reference Knagge, Smith, Smith, Buriak and Raftery25 The two resonance peaks of almost equivalent signal intensity observed in the previous work may represent two distinct domains within the porous Si film, perhaps a bilayer structure consisting of a pore nucleation layer comprised of smaller pores over a layer of larger pores, as is sometimes generated in electrochemically anodized silicon. Reference Sailor32 In the present work, a sacrificial electro-polishing step was used to prepare the wafers prior to etching, which typically eliminates these pore nucleation layers. Only a single dominant peak was observed in the range 40–80 ppm in this study, which indicates that our MSS materials have more uniform mesoporous channels or much better connected mesopores. Therefore, the model proposed in Fig. 5 is reasonable since it can adequately explain the 129Xe NMR data and derived pore sizes for each MSS material. It is also important to note that taking measurements of a series of MSS materials under identical conditions is the key for obtaining consistent data that can be compared across different sample preparations.
Illustration of proposed pore morphology in the porous Si (mesoporous silicon sponge, MSS) structures, depicting the presence of small micro-pores embedded in larger mesoporous channels.

As compared with the TEM, SEM, and BET results showing similar pore environments for materials with similar pore sizes, HP 129Xe NMR spectra provide more detailed and characteristic pore information providing distinction among four different samples. This additional information in combination with the results from the TEM, SEM, and BET measurements offers a more complete picture of the pore environments associated with each individual porous material. Because of being extremely sensitive to the connectivity of the pores, the 129Xe NMR spectra can be used to differentiate the subtle difference in the porosity and connectivity for samples that have similar SEM, TEM, and BET results. Such information can be helpful in explaining different material properties among samples prepared under so called “identical conditions” since the subtle difference in porosity, especially the connectivity of the pores, can have a large impact on the materials property. Therefore, in combination with other techniques including SEM, TEM, and BET, HP 129Xe NMR spectra is potentially useful tool in providing finger prints of the porous environment for the materials, similar to the conventional 13C or 1H NMR spectra that are finger prints for the chemical environments for organic compounds.
IV. CONCLUSION
Temperature dependent hyperpolarized (HP) 129Xe NMR is used to obtain information on porosity and connectivity of pores for four MSS materials with varying average pore diameters (20 nm, 50 nm) and average particle sizes (5 μm, >50 μm). The temperature dependent HP 129Xe NMR data from this study show that each MSS material has its own characteristic pore environment, whereas nitrogen adsorption BET data only show contrasting pore size distributions between 20 and 50 nm pores regardless of particle size and SEM gives identical images between 20n5μ and 20n50μ, and between 50n5μ and 50n50μ. The temperature dependent HP 129Xe NMR data in combination with SEM, TEM, and BET results from this study provide fingerprints of the structure and connectivity of the pores for each material. Such information is useful to gain a better understanding of the relationship between porous structures and their corresponding electrochemical properties in the design of future novel electrodes.
Supplementary Material
To view supplementary material for this article, please visit https://doi.org/10.1557/jmr.2017.151.
ACKNOWLEDGMENT
The HP 129Xe NMR work was supported by the EPSCoR Implementation grant DE–SC0007074, Office of Basic Energy Sciences, U.S. Department of Energy (US DOE). MMS material preparation and analysis work was supported by the National Science Foundation under Grant No. DMR-1210417 and by the Defense Advanced Research Projects Agency (DARPA) under Cooperative Agreement HR0011-13-2-0017. The content of the information within this document does not necessarily reflect the position or the policy of the Government. The authors thank the advance grant #HRD-0548311 for the purchase of new equipment used in this study.