


I. Introduction
This paper covers the intersection of several topics in which the research and development technology is both rapidly expanding and complex. It is therefore necessary at the outset to establish certain bounds for the discussion which will follow. First, glaciology is here considered in its broadest context including the study of sea ice, massive ground-ice bodies, and snow hydrology. It is within these areas that (he technology described in this paper is now being applied and evaluated. Secondly, special emphasis will be given to the explicit deterministic analysis of thermal contrast as it evolves as the natural product of the evolution of the near-surface energy-transfer regime. Thirdly, the sensor will be assumed to be a scanning radiation thermometer located at an unspecified elevation above the surface. It is further assumed that sensor information will be collected in such a manner that thermal images can be manufactured. Lastly, no effort will be made to treat the problems of scan geometry or atmospheric attenuation as these topics are already covered in the literature. Excellent short articles on these and other hardware-related problems are available (e.g. Reference McLerranMcLerran, 1968; Reference LorenzLorenz. 1973; Reference PeasePease, 1971).
In short, this presentation will be focused on the evaluation of the surface thermal regime in cold regions. Near-surface material variations produce some spatial and temporal thermal contrast (the signal) which is often masked by topographic and other effects (noise). The problem will be considered as one in exploration geophysics. A deterministic framework will be employed rather than image interpretation following the empirical qualitative methods of more traditional remote-sensing and photo-interpretative analysis. Within this context modeling and observation are interwoven.
II. The information content of thermal imagery
The radiative flux density Q emitted from a point at the Earth’s surface is controlled by the absolute temperature T and the thermal emissivity E of the emitting surface as
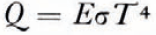
where σ is the Stefan-Boltzmann constant.
LeSchack and others (1973) have indicated that the ratio of the responses of sensors at different wavelengths in the relatively attenuation-free regions of the infrared (4-5 and 8-12 μm) indicate surface emissivity variation, as the surface temperature is independent of wavelength. Techniques for two-channel mixing by algebraic operators may eventually reduce some of the uncertainty introduced by emissivity variation.
Beyond these considerations it should be recognized that the surface thermal response is not independent of the thermal history of the near-surface zone but is conditioned by that history of diurnal evolution nested within annual evolution. The mechanics of this process can be understood in an abstract manner by examining the conceptual structure of a simple surface climate simulator (Reference OutcaltOutcalt, 1972[a]).
The surface temperature in a small area is influenced by three sets of variables which are astronomical, meteorological and geographical. These are outlined in Table I.

When viewed in this manner the familiar energy balance or conservation rule becomes a powerful analytical vehicle (Reference MyrupMyrup, 1969; Outcalt, 1972[a]). The four components of the surface energy-transfer regime can now be considered as complex functions of these three variable sets and the surface temperature T. Thus, the relationship between the net radiation R, soil S, and sensible H, and latent L heal fluxes can be expressed as a variation of the energy balance equation

The specific variables used in the computation of each component are discussed in detail by Outcalt (1972[a]). If all the variables sets are specified, the equation becomes a transcendental function of surface temperature alone. That surface temperature which will balance the heat flow across a surface is calculated by the sequential substitution of estimates into a suitable numerical algorithm which drives the conservation equation toward zero. When that condition is approached under conditions of correct variable set specification within a well-conditioned model structure, the model surface temperature, the substrate temperatures, and the components of surface energy transfer, match reality. In nature the soil thermal regime evolves through time t as a function of the second derivative of temperature T in a complex environment where substrate thermal diffusivity α is a function of both depth and temperature (due to freeze-thaw, etc.). This non-linear (parabolic) partial differential equation is

Thus the observed surface thermal response is conditioned by the near-surface thermal profile which evolved during a previous history of interaction between the variables listed in Table I. In an iterative, finite-difference model this feedback effect is simulated by nesting the substrate thermal diffusion loop (Equation (3)) within the equilibrium temperature solution-search loop (Equation (2}). This model structure has successfully reproduced the thermal and evaporation contrast as measured on the ground in the extremely complex topographic environment of an Alaskan alpine pass at five field micrometeorological sites with differing slope, exposure, horizon geometry and stratigraphy (Reference Brazel and OulcaltBrazel and Outcalt, 1973[a], Reference Brazel and Outcalt[b]), (see Figs 1 and 2). It has also been used to predict the observed thermal image contrast produced by thaw lakes beneath snow cover, sea-ice thickness (age), and thermal plumes resulting from human construction activity on the smooth snow-covered surface of the Arctic coastal plain (Outcalt, 1972[b], 1973), (see Figs 3 and 4). These contrasts resulting from differences in the radiative, thermal, and aerodynamic properties are best documented by imagery acquired along fixed flight lines at several times during the diurnal cycle. The phase and amplitude response of the observed thermal regime can then be compared to model response (see Fig. 5). The influence of the heat of fusion, which decreases the thermal diffusivity in ice-rich soils, has been documented and discussed in some detail by Reference Nakano and BrownNakano and Brown (1971), and Outcalt (1972[c]).
The positions of the micrometeorolopcal stations at Chitistone Pass, Alaska. ½ mile = 804 m, 100 feet = 30.5 m.

The simulated and observed thermal regimes at the Chitistone Pass micrometeorological stations. Clear weather midsummer observations were simulated.

At present, thermal modeling can be employed for the deterministic analysis of contrast in thermal infrared line-scan imagery. Target contrast is maximum under conditions of clear sky and low wind, and pre-flight modeling can be employed to select that portion of the diurnal cycle when contrast between target and background is optimum.
III. Some previous applications in glaciology
In the past, thermal imagery has been analyzed largely in an empirical manner to detect crevasses and study the structure of sea ice (e.g. Reference Poulin and HarwoodPoulin and Harwood, 1966; Reference McLerranMcLerran, 1964[a], Reference McLerran[b]). Horvath and Brown (1971) carried out a detailed analysis of sea ice and snow-covered tundra terrain near Barrow, Alaska utilizing numerous wavelength regions to estimate instantaneous net radiation values for specific target areas. Multispectral hardware and data reduction technology is advanced to a stage where it may soon be possible to produce computer maps of net radiation directly from data tapes containing multi-spectral information (Malila and Wagner, 1972).
The simulated surface contrast of the snow-covered tundra and thaw lakes shown in Figure 4.

Thermal imagery acquired south of the NARL site, Barrow, Alaska, 17.15 A.S.T., 11 October 1967. Dark (hot), light (cold). Note the warm plumes extending to the lee of the drum dumps (D) and unheated buildings (B), along the service road which is relatively warm compared to the snow-covered tundra surface. Snow-covered frozen lakes (L) and low-center polygons also appear to be relatively warm. Imagery courtesy of Environmental Institute of Michigan (formerly Willow Run Laboratories).

The solution of Equation (3) within the simulation of the effects of removing a 15 cm organic layer, exposing mineral soil, from the tundra at Barrow, Alaska. A late August, clear, calm environment was simulated. One thermal profile was generated each 15 min during the diurnal cycle. The upper set of curves assume the organic layer to be present; the lower ones correspond to no organic layer. Note the effect of freeze-thaw retarding the evolution of the substrate thermal structure, as shown by the clustering of lines just below the freezing point in the upper levels, and the increased amplitude of the disturbance after the removal of the low-diffusivity, overlaying, organic material.

IV. Potential applications in glaciology
The technology of thermal mapping has now evolved to the stage where it is a routine matter to process calibrated imagery into computer-compatible, digital form on magnetic tape. There is no justification within this hardware environment for using only the qualitative photo-interpretation mode of image analysis. Within glaciology, there are at least three areas where experiments in thermal mapping and modeling should yield valuable results:
(1) Sea and lake ice thickness forecasting
Simulation experiments, verified with off-shore imagery acquired near Barrow, Alaska, in October 1967, indicated that the surface thermal contrast in sea ice ranging in age from “polar floe” to “seasonal” could be successfully modeled. This analysis demonstrated that ice thickness (age) was positively correlated with solar albedo and negatively correlated with surface temperature (Reference Horvath and BlownHorvath and Brown, 1971). The thickness of sea ice in the imagery varied from 15 to 210 cm and was assumed to be overlain by 15 cm of packed snow in the simulation (Outcalt, 1973).
The movement of men and material onto ice cover which is at least partially seasonal is becoming more common in the high latitudes each winter season. Some effort should be expended on the prosecution of an integrated modeling and field-measurement experiment under conditions in which solar radiation is insignificant and thaw zones are present in the ice cover. Attention should also be paid to the effects of variable depth and structure of the snow cover (Reference PoulinPoulin, 1975). The goal of this venture should be the designing and testing of a “conservative ice-thickness model”which would permit underestimation of thickness but exclude the possibility of overestimation.
(2) Snow hydrology
Melting snow cover shows no thermal contrast due to local relief or material effects (e.g. wind-packed, fresh snow). Thus, thermal imagery may provide the ideal geophysical tool for monitoring the seasonal ripening of snow in mountain regions (personal communication in 1973 from A. D. C. Terroux). Simple imagery systems could be initially employed on scheduled commercial and military aircraft, limiting data acquisition to clear weather.
(3) Man-induced thermal modification
When man builds structures at high latitudes, the aerodynamic and radiative properties of the surface are frequently altered, and the thermal properties of the surface changed due to disturbances of the local hydrologic network and installation of construction materials. The "thermal plumes" down-wind from man-made structures discussed earlier provide a vivid example. Thermal imagery is an excellent device for documenting the changes in the surface thermal regime produced by "high-latitude urbanization". This type of documentation is the first step in attenuating undesirable side effects of construction. The urban heat-island effect is of more than academic interest in the circumpolar world where large structures are frequently built on ice-rich soils, and the existence of a heat-island effect can lead to structural failure and/or increased maintenance costs.
V. Some priorities for future research
As the thermal-response data are often collected on magnetic tape, there is a great potential for channel-mixing algebraic operations and spatial filtering of raw data. Maps of diurnal thermal range (e.g. produced by subtraction of values on a pre-dawn map from those on a noon map) would contain patterns related to material properties, etc. Unfortunately these time-dependent operators require a sophisticated registration technology to remove scanner distortion and effects due to flight-path variation. To the author’s knowledge no geographic registration system suitable for aircraft data is operational ! Picture processing technology could be applied to raw images or processed images to smooth information (to reveal underlying low-frequency patterns), outline areas of sharp gradient changes (two-dimensional second-derivative filter) and remove high-frequency noise. This technology has been developed to an extremely high degree (Reference RosenfieldRosenfield, 1969; Reference ToblerTobler, 1966). Spatial smoothing operators are particularly necessary to remove the effects of slope and exposure in micro-relief, which will produce high-frequency thermal contrast at low sun angles during the Arctic summer. In short, three classes of algebraic operators are suggested. These may be applied in an almost infinite sequence and are described in Table II.

Thus the sequence to prepare a smoothed map of emissivity variation would be (Cr * Sm). The operation of preparing a thermal range map initially smoothed thrice and then highlighted to display areas with rapid gradient change would be (Ts * Sm * Sm * Sm * Sd). The possibilities are nearly limitless.
In short, effort should be applied first to the problem of registration technology and secondly to the design of temporal, spatial, and spectral operators which can be applied directly to tapes of raw data and used in the computer to generate graphic output.
VI. Conclusion
Thermal imagery and contrast analysis cannot be separated from the evolutionary energy-transfer environment of which it is an integrated expression. The recognition of the interrelationship between geographic material variations and their expression through the evolution of the surface thermal regime is the key to utilizing the information content of imagery. In a parallel vein the potential power of modeling and data manipulation analysis is enhanced by the reduction of the effective thermal diffusivity during freeze-thaw. The potential of the existing technology can be realized by (1) the development of systems for operational data reduction utilizing temporal, spatial and spectral operators, {2) field experiments combining modeling, aerial data acquisition, and ground measurements, to establish the limits of recognition systems.
VII. Acknowledgements
The imagery at Barrow, Alaska, was acquired during a joint research project of Willow Run Laboratories (now Environmental Research Institute of Michigan) and Arctic Institute of North America sponsored under contract by the Office of Naval Research (ONR-426). The Chitistone Pass micrometeorological data were gathered as part of the Arctic Institute of North America—High Mountain Environment Project funded by the U.S. Army Research Office, Durham, North Carolina.



