Introduction
As an important organ of higher plants, seeds provide nutrients for initiation of plant growth in the next generation and protect the stability of the plant's genetic material. The expression patterns of seed-specific genes show both tissue and developmental-stage specificity. It was demonstrated that a storage protein gene in peas (Pisum sativum) is only activated and transcribed during a specific stage of seed development (Boulter et al., Reference Boulter, Evans, Ellis, Shirsat, Gatehouse and Croy1987). It was also found that both the transcriptional activity and the abundance of mRNA of the legA gene increased during the expansion of pea seed cotyledon cells (Thompson et al., Reference Thompson, Evans, Boulter, Croy and Gatehouse1989). Seeds can provide a good experimental model for studying tissue-specific gene expression, as well as genes that regulate development in plants (Boulter et al., Reference Boulter, Evans, Ellis, Shirsat, Gatehouse and Croy1987). However, there are currently no data comparing the expression characteristics of seed-specific genes among different species on a whole-genome scale.
Homologous genes in the same or different species originate from a common ancestor in the evolutionary process and share certain conservative protein domains. The evolutionary history of these genes may reflect the evolutionary history of the species to a certain degree. The functions of proteins encoded by homologous genes are usually highly conserved, but examples to the contrary do exist. Homologous genes in various species with different expression patterns are known to produce different phenotypes (Wendel, Reference Wendel2000; Sonnhammer and Koonin, Reference Sonnhammer and Koonin2002). Previous studies have shown that the USP gene is strongly expressed in the seeds of several plants (Fiedler and Conrad, Reference Fiedler and Conrad1995; Phillips et al., Reference Phillips, Artsaenko, Fiedler, Horstmann, Mock, Muntz and Conrad1997; Conrad et al., Reference Conrad, Fiedler, Artsaenko and Phillips1998; Czihal et al., Reference Czihal, Conrad, Buchner, Brevis, Farouk, Manteuffel and Adler1999; Saalbach et al., Reference Saalbach, Giersberg and Conrad2001). However, the expression of USP homologues is not only observed in developing seeds but also in the root tips of tobacco (Nicotiana tabacum) and Arabidopsis seedlings (Baumlein et al., Reference Baumlein, Boerjan, Nagy, Bassuner, Van Montague, Inze and Wobus1991; Zakharov et al., Reference Zakharov, Giersberg, Hosein, Melzer, Muntz and Saalbach2004).
The expression of seed-specific genes is regulated precisely by cis-acting elements and trans-acting factors in the promoter. Binding sites for the transcription factors E-box and G-box, which have been studied extensively, are highly conserved and usually found in the promoters of seed-specific genes (Chandrasekharan et al., Reference Chandrasekharan, Blshop and Hall2003). They play critical cis-regulatory roles in controlling the expression of seed-specific genes, both temporally and spatially. Studies have shown that the promoter of the PHASEOLIN gene, which is mainly expressed in developing cotyledons, exerts a tight spatio-temporal control on the gene's expression (Chandrasekharan et al., Reference Chandrasekharan, Blshop and Hall2003). Furthermore, studies have also identified an approximately 295 bp sequence containing more than 20 seed-specific cis-acting elements, among which the G-box binding site displayed the strongest effect on seed-specific gene expression, whereas a mutation of the G-box promoter resulted in a loss of activity (Li and Hall, Reference Li and Hall1999; Chandrasekharan et al., Reference Chandrasekharan, Blshop and Hall2003). An upstream element of seed-specific promoters, the RY-motif has been extensively studied and widely identified in seed-specific genes in monocots and dicots. Mutation of the RY-motif is known to reduce gene expression in both seeds and leaves (Reidt et al., Reference Reidt, Wohlfarth, Elierstrom, Czlhai, Tewes, Ezcurra, Rask and Baumlein2000). Finally, many other elements located in the promoters of seed-specific genes have been identified, including a B-box (Ezcurra et al., Reference Ezcurra, Ellerstrom, Wycliffe, Stalberg and Rask1999), prolamin-box, CAAT-box, AACA-motif (Wu et al., Reference Wu, Washida, Onodera, Harada and Takaiwa2000) and legumin-box (Shirsat et al., Reference Shirsat, Meakin and Gatehouse1990).
In this study we compared the expression patterns of seed-specific gene homologues of Medicago, soybean, Arabidopsis and rice. The results of the comparison of both the levels and patterns of gene expression among these four species indicated that the expression variation of the homologous genes was small in the species that were closely related and great in species that were distantly related. Furthermore, we compared the cis-acting regulatory elements of these genes in the four species of interest and found a large variation of expression among the different plants. These results suggest that the greatest discrepancy of homologous gene expression may be caused by the large differentiation of cis-elements in the promoter region.
Materials and methods
Genomic data analysis
In this study, gene expression data for Medicago, soybean, Arabidopsis and rice were downloaded from the Medicago truncatula Gene Expression Atlas of Samuel Roberts Noble Foundation, Inc. (http://mtgea.noble.org/v3/) (Benedito et al., Reference Benedito, Torres-Jerez, Murray, Andriankaja, Allen, Kakar, Wandrey, Verdier, Zuber, Ott, Moreau, Niebel, Frickey, Weiller, He, Dai, Zhao, Tang and Udvardi2008), the SoyBase and the Soybean Breeder's Toolbox (http://soybase.org/soyseq/tables_lists/index.php) (Severin et al., Reference Severin, Woody, Bolon, Joseph, Diers, Farmer, Muehlbauer, Nelson, Grant, Specht, Graham, Cannon, May, Vance and Shoemaker2010), the AtGenExpress Visualization Tool (http://www.weigelworld.org/resources/microarray/AtGenExpress/) (Schmid et al., Reference Schmid, Davison, Henz, Pape, Demar, Vingron, Schölkopf, Weigel and Lohmann2005), and the RiceGSE of RiceGE5 database (http://natural.salk.edu/database/RiceGE5/) (Zhang et al., Reference Zhang, Odom, Koo, Conkright, Canettieri, Best, Chen, Jenner, Herbolsheimer, Jacobsen, Kadam, Ecker, Emerson, Hogenesch, Unterman, Young and Montminy2005), respectively. Gene expression data of the four species analysed in this study were from the 3-week-old seedling stage for leaves and roots, and identical to stage 12 of Arabidopsis (Sanders et al., Reference Sanders, Bui, Weterings, McIntire, Hsu, Lee, Truong, Beals and Goldberg1999) for flowers. Gene expression data of seeds were determined 36, 35, 56 and 29 d after pollination (at which points seeds are at physiological maturity) for Medicago (Benedito et al., Reference Benedito, Torres-Jerez, Murray, Andriankaja, Allen, Kakar, Wandrey, Verdier, Zuber, Ott, Moreau, Niebel, Frickey, Weiller, He, Dai, Zhao, Tang and Udvardi2008), soybean (Severin et al., Reference Severin, Woody, Bolon, Joseph, Diers, Farmer, Muehlbauer, Nelson, Grant, Specht, Graham, Cannon, May, Vance and Shoemaker2010), Arabidopsis (Sanders et al., Reference Sanders, Bui, Weterings, McIntire, Hsu, Lee, Truong, Beals and Goldberg1999) and rice (Zhang et al., Reference Zhang, Odom, Koo, Conkright, Canettieri, Best, Chen, Jenner, Herbolsheimer, Jacobsen, Kadam, Ecker, Emerson, Hogenesch, Unterman, Young and Montminy2005), respectively. The genomic sequences of Medicago, soybean, Arabidopsis and rice were downloaded from the Mt3.5 Release (http://tofu.cfans.umn.edu/) (Young and Udvardi, Reference Young and Udvardi2009), SoyBase and the Soybean Breeder's Toolbox (Severin et al., Reference Severin, Woody, Bolon, Joseph, Diers, Farmer, Muehlbauer, Nelson, Grant, Specht, Graham, Cannon, May, Vance and Shoemaker2010), TAIR (http://www.arabidopsis.org/) (Clark et al., Reference Clark, Schweikert, Toomajian, Ossowski, Zeller, Shinn, Warthmann, Hu, Fu, Hinds, Chen, Frazer, Huson, Schölkopf, Nordborg, Rätsch, Ecker and Weigel2007) and PlantGDB (http://www.plantgdb.org/OsGDB/) (Dong et al., Reference Dong, Schlueter and Brendel2004), respectively.
Statistical and comparative analysis of the expression patterns of seed-specific genes
Seed-specific genes were identified using the Z-score transformation normalization method, with cut-off values of a gene expression level ratio ≥ 5 and a Z-score ≥ 6. The relative ratios of gene expression levels among four different organs (seed, leaf, floral organ and root) were measured using the following equation:
 $$\begin{eqnarray} Ratio = \frac { X }{MAX( O )} \end{eqnarray}$$
where X represents the expression level of the target organ and O represents the expression level of all of the other organs. Additionally, the Z-score transformation normalization method was applied to compare the expression levels of different organs (Li et al., Reference Li, Xu, Yang, Kong and Xue2007; Wei et al., Reference Wei, Xu, Deng, Su, Xue and Wang2010; Liu et al., Reference Liu, Ma, Na and Wang2013). Z-scores (Zi) were calculated by dividing the difference in expression level between the target organ (Xi) and all of the other organs (μ, mean) by the standard deviation (SD) of all of the other organs, using the following equation:
 $$\begin{eqnarray} Zi = \frac { Xi - \mu }{SD} \end{eqnarray}$$
Gene expression levels in the four angiosperm seeds were analysed using the above equations. Based on nucleotide sequence similarity, a reciprocal BLAST was run using local BLAST software (blast-2.2.23-ia32-win32) to search for homologues of the seed-specific genes from one species among the other three species, with a cut-off E-value ≤ 1.0E − 05. The expression data were visualized using MeV v4.6 (http://www.tm4.org/mev/).
cis-Element analysis
The PLACE database (http://www.dna.affrc.go.jp/PLACE/) was used to search for cis-elements in the promoter regions of homologous seed-specific genes in the four angiosperm species (Higo et al., Reference Higo, Ugawa, Iwamoto and Korenaga1999). We selected a 2000 bp promoter region upstream of the start codon in each gene to search for possible cis-elements.
Results
Identification of seed-specific genes on a genomic scale
We identified seed-specific genes by comparing the expression levels of genes in the seeds with those in the leaf, floral organ and root. The comparison revealed that 605 genes are specifically expressed in Medicago seeds. Using similar methods in the other three species, we identified 581, 778 and 722 genes that demonstrated specific expression in the seeds of the soybean, Arabidopsis and rice, respectively.
Identifying homologous seed-specific genes
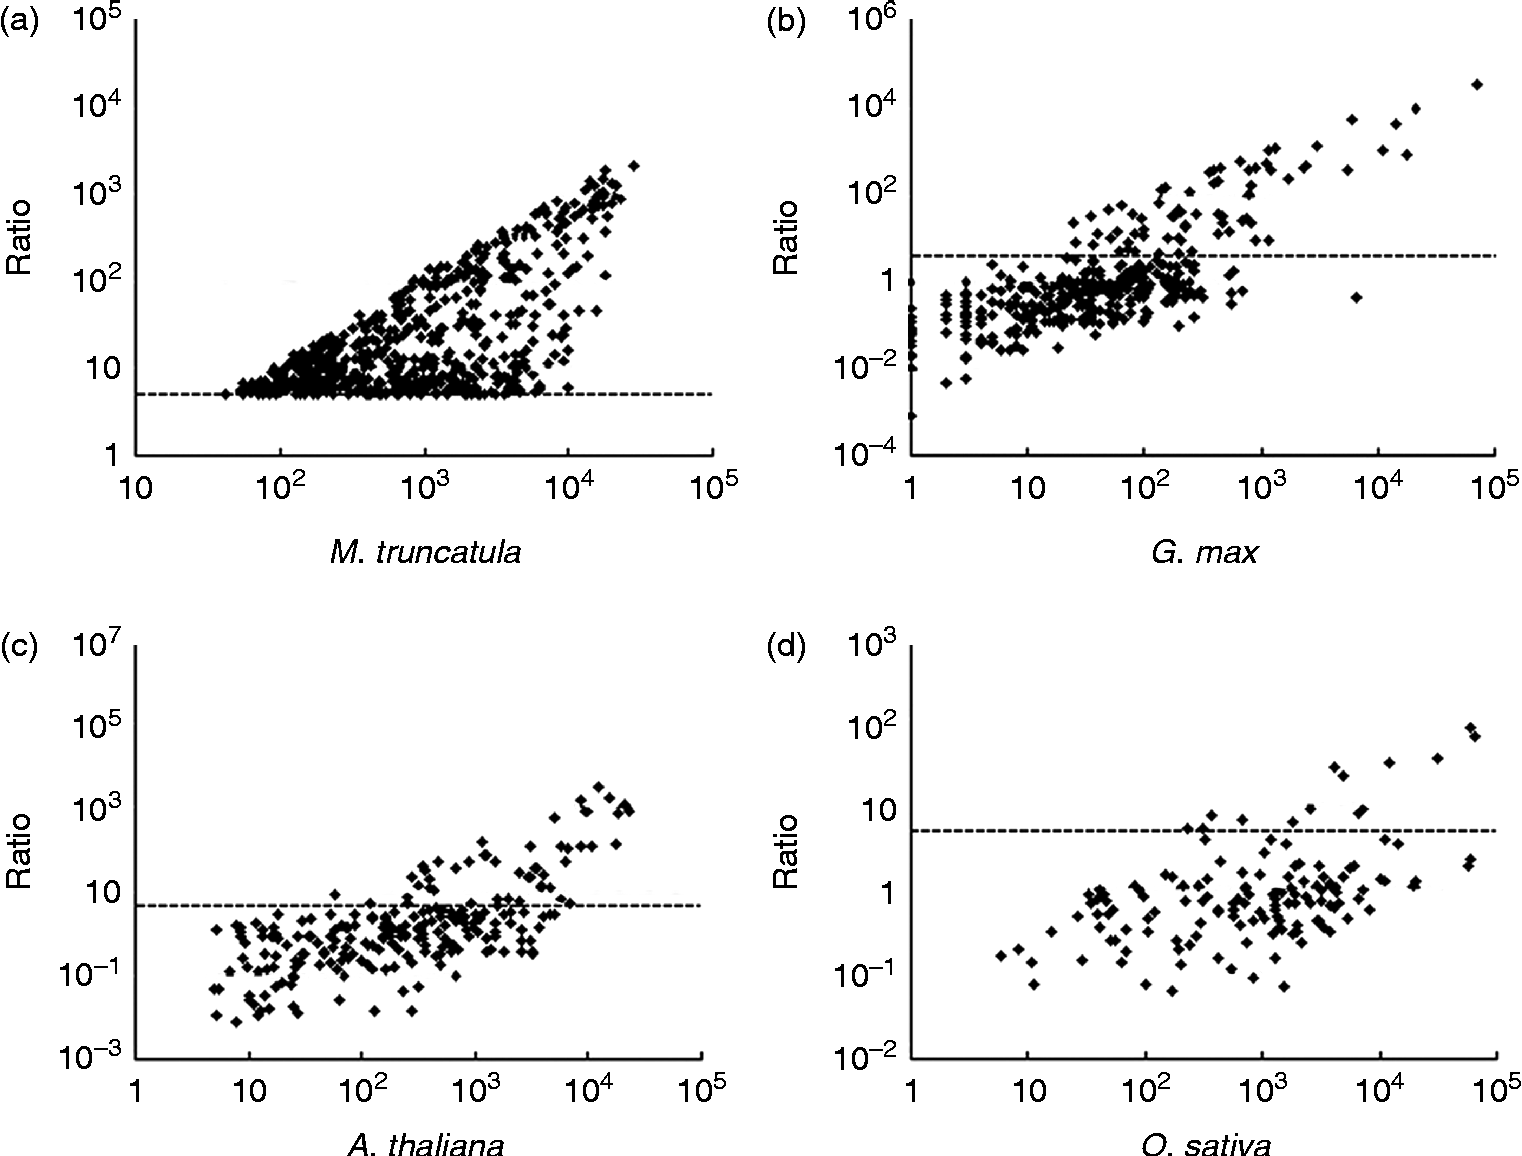
The potentially conserved and divergent features of seed-specific genes in Medicago and their homologues in the other three angiosperms were compared based on results from the published databases (Dong et al., Reference Dong, Schlueter and Brendel2004; Clark et al., Reference Clark, Schweikert, Toomajian, Ossowski, Zeller, Shinn, Warthmann, Hu, Fu, Hinds, Chen, Frazer, Huson, Schölkopf, Nordborg, Rätsch, Ecker and Weigel2007; Young and Udvardi, Reference Young and Udvardi2009; Severin et al., Reference Severin, Woody, Bolon, Joseph, Diers, Farmer, Muehlbauer, Nelson, Grant, Specht, Graham, Cannon, May, Vance and Shoemaker2010). Using BLAST searches with a cut-off E-value ≤ 1.0E − 05, we found 482, 249 and 158 Medicago homologues in the soybean, Arabidopsis and rice genomes, respectively. However, not all of the homologues were specifically expressed in the seeds. Using the Z-score and ratio transformation normalization method, with a gene expression level ratio ≥ 5.0 and a Z-score ≥ 6.0, we determined that 73 of the soybean homologues, 51 of the Arabidopsis homologues, and 15 of the rice homologues were specifically expressed in the seeds (Fig. 1 and supplementary Fig. S1).
Ratios of gene expression levels of Medicago seed-specific genes and their homologues in the soybean, Arabidopsis and rice. The x-axis shows the gene expression levels in the seeds. (a) The ratios of gene expression levels of all 605 seed-specific genes in Medicago are greater than or equal to 5. (b) Gene expression level ratios of the 482 soybean homologues using 605 seed-specific genes in Medicago to BLAST against the soybean genome. (c) Gene expression level ratios of the 249 Arabidopsis homologues. (d) Gene expression level ratios of the 158 rice homologues. All homologues were identified by comparing the 605 seed-specific genes in Medicago against the respective genomes of the other three species using BLAST, with a cut-off E-value ≤ 1.0E − 05. The dotted line on the scale indicates a value of 5.

Similar methods were used to identify homologues of seed-specific genes in soybean, and 397, 248 and 173 soybean homologues were found in the Medicago, Arabidopsis and rice genomes, respectively. We then determined that 133 of the Medicago homologues, 66 of the Arabidopsis homologues and 37 of the rice homologues were specifically expressed in seeds (see supplementary Figs S2 and S3). Similarly, we searched for homologues of seed-specific genes from Arabidopsis and identified 331, 394 and 201 homologues in Medicago, soybean and rice, respectively. Of these, 51, 34 and 22 genes were specifically expressed in the seeds of Medicago, soybean and rice, respectively (see supplementary Figs S4 and S5). Finally, 119, 221 and 136 homologues of rice seed-specific genes were found in the Medicago, soybean and Arabidopsis genomes. A total of 13 of the Medicago homologues, 24 of the soybean homologues and 22 of the Arabidopsis homologues were specifically expressed in the seeds (see supplementary Figs S6 and S7). Compared with results from the other three species, rice shared relatively few homologous seed-specific genes with the other species.
Expression pattern analysis of seed-specific genes
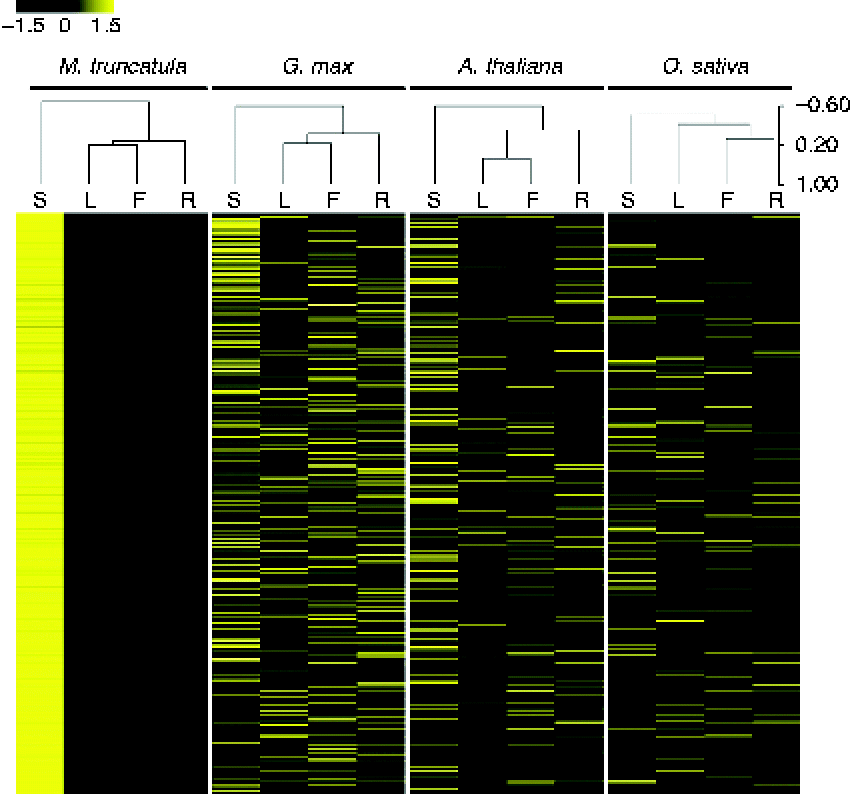
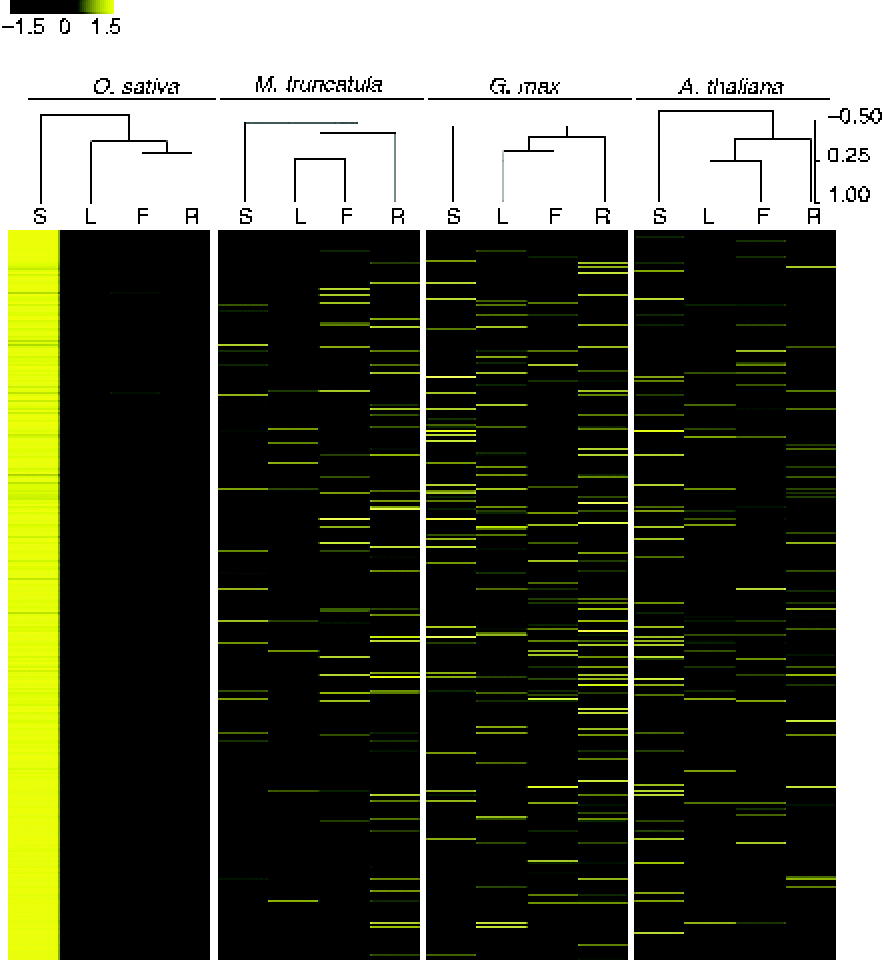
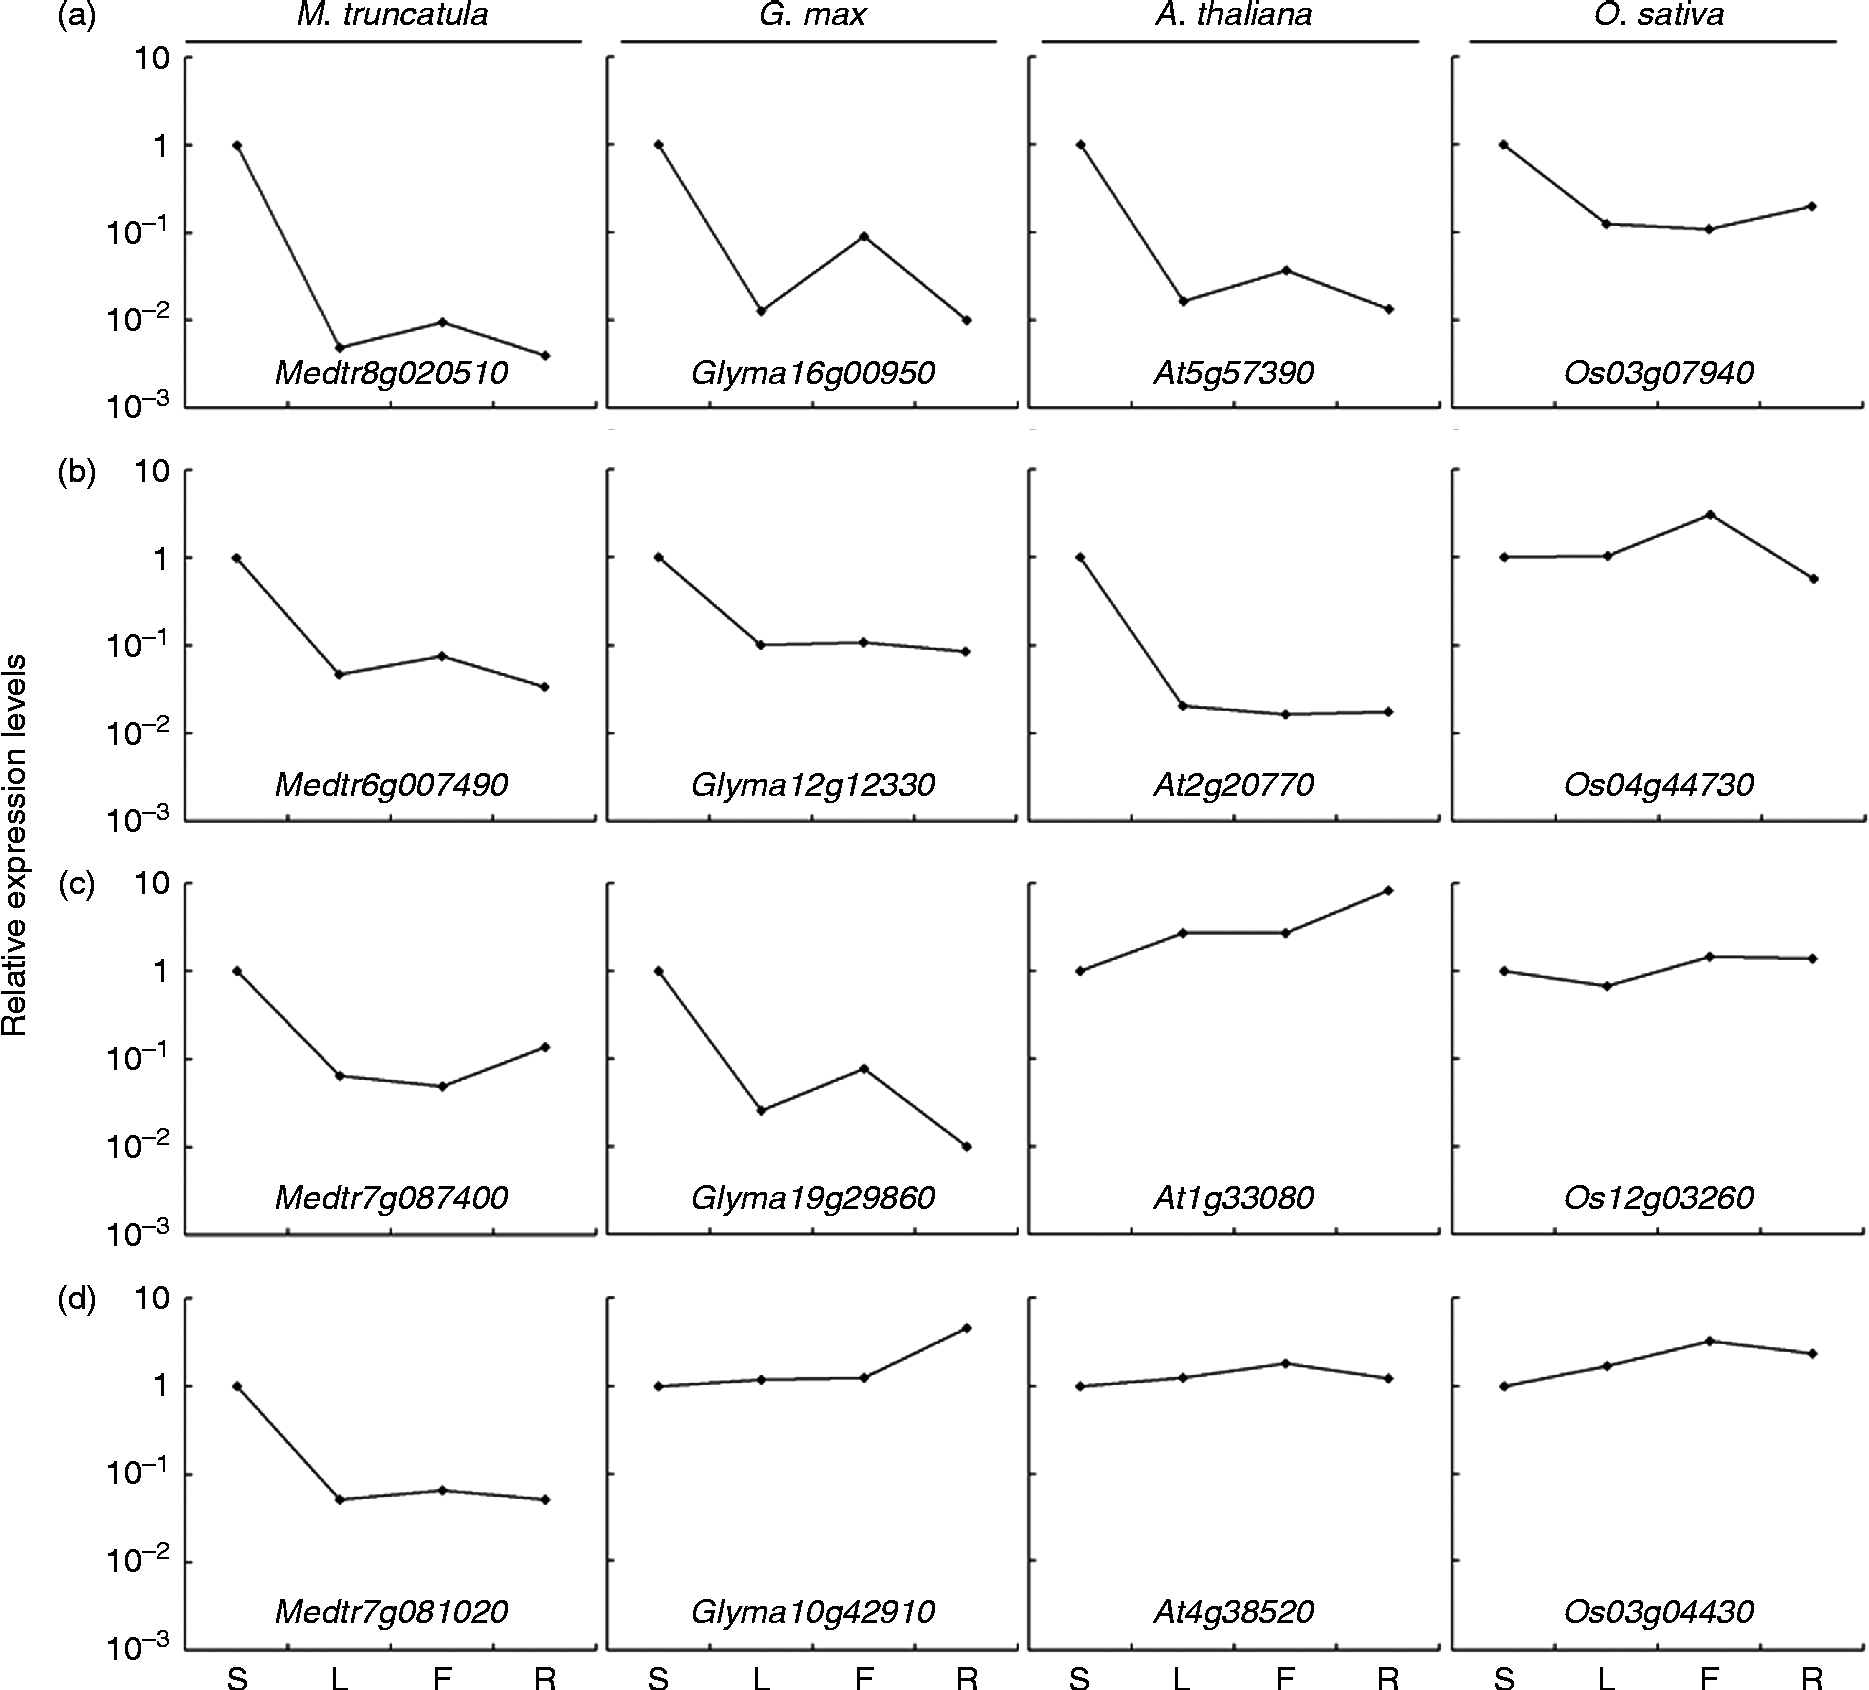
The expression patterns of the M. truncatula seed-specific genes were further compared with those of their homologues in the other three species. Using log2 seed/ [MAX (the gene expression values in other organs)] (Chanderbali et al., Reference Chanderbali, Yoo, Zahn, Brockington and Wall2010; Liu et al., Reference Liu, Ma, Na and Wang2013), it was demonstrated that all of the genes were upregulated in the Medicago seeds and only a few of the homologues were upregulated in the other three species. Soybean contained the highest levels of upregulation, followed by Arabidopsis and rice. Cluster analyses showed that the clade lengths of leaves, flowers and roots were gradually reducing with the evolutionary relationships, becoming further among the four species (Fig. 2). We used similar methods to compare the rice seed-specific expression genes to their homologues in the other three angiosperms, and found that Arabidopsis contained the largest number of seed-specific homologues and Medicago the smallest number (Fig. 3). Logically speaking, for one seed-specific gene in Medicago, the expression of the three homologues in the other three species can only be grouped into four different categories. That is zero, one, two and three homologues with seed-specific expression. Therefore, homologous genes in the four species showed differential expression patterns; this can be summarized by creating four categories (Fig. 4) with successively different expression patterns, which may be connected to the cis-elements in the homologues.
(colour online). Expression patterns of Medicago seed-specific genes and their homologues in soybean, Arabidopsis and rice. The bar represents the scale of expression levels of the genes. The scale of the log2 ratios ranges from − 1.5 (black) to 1.5 (yellow). S, seed; L, leaf; F, flower; R, root.
(colour online). Expression patterns of rice seed-specific genes and their homologues in Medicago, soybean and Arabidopsis. The bar represents the scale of expression levels of the genes. The scale of the log2 ratios ranges from~1.5 (black) to 1.5 (yellow). S, seed; L, leaf; F, flower; R, root.
Groups of homologous genes found in the four plant species and their respective expression patterns. (a) Medtr8g020510 and its three homologues are all specifically expressed in the seed. (b) Except for Os04g44730, the homologues are specifically expressed in the seed. (c) Medtr7g087400 and Glyma19g29860 are specifically expressed in the seed, while the other homologues are not. (d) Only Medtr7g081020 is specifically expressed in the seed.
Analysis of the role of cis-elements in the expression of seed-specific genes
We first identified genes that were specifically expressed in the seeds using the Z-score transformation normalization method with cut-off values of a ratio ≥ 5.0 and a Z-score ≥ 6.0, and then performed BLAST searches against the seed-specific genes of the four species using a cut-off E-value ≤ 1.0E − 05 to identify their homologues in the other species. We then searched for cis-acting regulatory elements located as far apart as 2000 bp upstream of the start codon using the PLACE database. This analysis identified the following seed-specific cis-elements in promoters among the four species investigated: − 300 ELEMENT (Thomas and Flavell, Reference Thomas and Flavell1990), E-box, CANBNNAPA (Ellerstrom et al., Reference Ellerstrom, Stalberg, Ezcurra and Rask1996; Stalberg et al., Reference Stalberg, Ellerstom, Ezcurra, Ablov and Rask1996), DPBFCOREDCDC3 (Finkelstein and Lynch, Reference Finkelstein and Lynch2000), SEF1MOTIF (Allen et al., Reference Allen, Bernier, Lessard and Beachy1989), CAREOSREP1 (Sutoh and Yamauchi, Reference Sutoh and Yamauchi2003) and AACACOREOSGLUB1 (Wu et al., Reference Wu, Washida, Onodera, Harada and Takaiwa2000). Additionally, with the study of cis-elements in the promoter regions of Medicago genes showing seed-specific expression and their homologues in the other three species, we found that the total number of cis-elements was reduced when the evolutionary relationships became further apart among the four species (see supplementary Table S1). Further, we studied four groups of homologous genes with increasingly divergent expression patterns, as summarized in Fig. 4. In the first group, Medtr8g020510 and its three homologues were all specifically expressed in seeds. In the second group, Medtr6g007490, Glyma12g12330 and At2g20770 were specifically expressed in seeds while Os04g44730 was not. In the third group, Medtr7g087400 and Glyma19g29860 were specifically expressed in seeds, while the other two homologues did not show specific expression in seeds. Finally, in the fourth group, only Medtr7g081020 showed specific expression in seeds. Upon analysing the cis-elements presented in the ten seed-specific genes, the − 300 ELEMENT and CANBNNAPA cis-elements were found in the upper left corner of Fig. 4 (Table 1). In contrast, these two cis-elements were not found in the promoter regions of the six homologous genes in the lower right corner of Fig. 4 that indicates non-seed-specific expression (Table 1). This finding suggests that − 300 ELEMENT and CANBNNAPA may play important regulatory roles in the expression of seed-specific genes.
cis-Element analysis in the promoter regions of the four groups of homologous genes shown in Fig. 4. Each row represents a distinct group of homologous genes

– Indicates that the homologue in the particular species does not contain the group of cis-elements shown.
Discussion
With the completion of sequencing and expression profiling of the Medicago, soybean, Arabidopsis and rice genomes, a wealth of information is now available for a comparable study of the characteristics of seed-specific genes in these four species. The results of this research may provide novel insights into the evolution and development of seeds in these four species. In the present study, seed-specific genes in Medicago, soybean, Arabidopsis and rice were identified, and the number of seed-specific genes in each of the four species was found to vary. These results may be correlated with the distinct seed morphology and the different evolutionary histories (Baskin and Baskin, Reference Baskin and Baskin1998). Further statistical analysis revealed that the number of homologues of Medicago seed-specific genes in each of the other three species varies, with 482, 249 and 158 homologues found in the genomes of soybean, Arabidopsis and rice, respectively. The number of Medicago homologues in the soybean genome was greater than that found in the Arabidopsis or rice genome. Furthermore, most of the soybean homologues also showed specific expression in soybean seeds, which might be explained by the fact that Medicago and soybean are both legumes and thus share a very close evolutionary relationship (Doyle and Luckow, Reference Doyle and Luckow2003). Evolutionarily speaking, Medicago and Arabidopsis have a close genetic relationship as they are both dicotyledonous rosids (Yoo et al., Reference Yoo, Altman, Soltis, Soltis and Soltis2010), which appeared nearly 108–117 million years ago (Wikstrom et al., Reference Wikstrom, Savolainen and Chase2001). While there were differences in expression patterns between pairs of homologues in Arabidopsis and Medicago, they were less than those observed between pairs of homologues in rice and Medicago (Fig. 2), which are relatively distantly related, as rice is a monocot and belongs to a group that diverged from dicots approximately 125 million years ago (Crane et al., Reference Crane, Friis and Pedersen1995; Jiao et al., Reference Jiao, Wickett, Ayyampalayam, Chanderbali, Landherr, Ralph, Tomsho, Hu, Liang, Soltis, Soltis, Clifton, Schlarbaum, Schuster, Ma, Leebens-Mack and dePamphilis2011). We found similar results when we performed BLAST searches for the homologues of seed-specific genes in soybean, or in Arabidopsis, in the genomes of each of the other three species (see supplementary Figs S8 and S9). In addition, the analysis of the expression patterns of seed-specific genes in rice and their homologues in other plants showed that only 119 homologues were found in Medicago, which is the lowest number of homologues shared by any two species (Fig. 3). This suggested that single or more independent gene duplication events were followed by one or more independent sub- or neo-functionalization events among the homologues in the seed of the four species. Taken together, our comparative analysis of the seed-specific genes in the four species showed that the variation in the expression patterns of homologous genes is low among closely related species and high among more distantly related ones.
Although the final amount of gene product is determined at both the transcriptional and post-transcriptional levels, the temporal and spatial expression pattern and transcript level of a gene are mostly regulated by the cis-elements presented in the promoters (Qu et al., Reference Qu, Xing, Liu, Xu and Song2008). In analysing the cis-elements present in Medicago seed-specific genes and their homologues, we found that the different expression patterns may be a function of the characteristics of the cis-elements. Seven different cis-elements were identified from Medicago seed-specific genes and their homologues. Through the statistical analyses of the cis-elements of the seed-specific expression genes in Medicago and their homologues, we found that the total number of cis-elements was reduced when the evolutionary relationships became more distant among the four species. Apparently, the degree of variation in the expression patterns of seed-specific homologous genes was low among closely related species but higher among more distantly related ones. CANBNNAPA was one of these seed-specific cis-elements found in the seed storage protein gene napA promoter of Brassica napus; mutation or deletion studies indicated that this cis-element is involved both in embryo expression pattern in the seed and promoter leakage in non-seed tissue (Ellerstrom et al., Reference Ellerstrom, Stalberg, Ezcurra and Rask1996). The − 300 ELEMENT (also called the prolamin box or endosperm box), which is conserved in many seed endosperm-specific genes of cereals, is an essential component determining seed endosperm-specific expression (Thomas and Flavell, Reference Thomas and Flavell1990). In the present research, − 300 ELEMENT was found in the promoter of Os03g07940. Os03g07940 belongs to the euAP2 branch of the AP2 transcription factor family (Kim et al., Reference Kim, Soltis, Wall and Soltis2006; Tang et al., Reference Tang, Li and Chen2007), which plays important roles in determining seed size, seed weight and the accumulation of seed oil and protein (Chuck et al., Reference Chuck, Meeley and Hake1998; Maes et al., Reference Maes, van de Steene, Zethof, Karimi, D'Hauw, Mares, van Montagu and Gerats2001; Jofuku et al., Reference Jofuku, Omidyar, Gee and Okamuro2005; Ohto et al., Reference Ohto, Fischer, Goldberg, Nakamura and Harada2005). The expression of Os03g07940 proved to be seed-specific, so we inferred that − 300 ELEMENT might be associated with Os03g07940 specific expression in rice seeds.
We further analysed the promoters of 16 homologous genes from the four species, and the results showed that two cis-elements, the − 300 ELEMENT and CANBNNAPA were present in ten seed-specific genes (Fig. 4, Table 1). This suggests that these cis-elements may play critical roles in the regulation of seed-specific gene expression. Collectively, our results suggest that the lack of conservation in the expression of homologous genes across different species may be a consequence of the presence (or lack thereof) of different cis-elements in promoter regions. We further speculate that mutating the cis-elements could lead to changes in gene expression patterns, which could then lead to phenotypic difference in the seeds of these four plant species.
In summary, we screened for and identified 605, 581, 778 and 722 genes that were specifically expressed in the seeds of Medicago, soybean, Arabidopsis and rice, respectively. In comparing the expression patterns of these genes and their homologues, we found that the expression patterns of homologous genes in different plant species were not necessarily conserved. Further analysis revealed that the reason for this lack of conservation might be due to the presence (or lack thereof) of different cis-elements in homologues from different plant species as a result of their divergent evolutionary histories.
Supplementary material
To view supplementary material for this article, please visit http://dx.doi.org/10.1017/S0960258513000305
Acknowledgements
We thank Tianlong Cheng, Yu Wang and Peng Liu for their help with the data analysis.
Financial support
This study was supported by the National Basic Research Program of China (2014CB138704), the National Natural Science Foundation of China (31072072 and 31272492), and the fundamental research funds for the central universities (lzujbky-2012-94 and lzujbky-2013-82).
Conflicts of interest
None.