1 Introduction
The aim of this study is to investigate a suspected sound change in progress by which the Bavarian dialect feature of complementary vowel and stop length may be giving way to the influence of Standard German where vowel and stop length can be freely combined. Standard German has a phonemic vowel length contrast (e.g. tense /ʃtaːt/ ‘state’ vs. lax /ʃtat/ ‘town’) as well as a fortis–lenis contrast for stops (e.g. lenis /boːdən/ ‘floor’ vs. fortis /boːtən/ ‘messengers’) and duration is one of the main acoustic cues to both contrasts: fortis stops have proportionally longer closure phases than lenis stops (e.g. Kohler Reference Kohler1977). This cue becomes most important when the aspiration cue is absent (Kohler Reference Kohler1979, Jessen Reference Jessen1998), which is frequently the case, e.g. in medial position of trochaic words with an /ən/-ending when the stop is released nasally after the schwa has been deleted. As well as being typically more centralized in the vowel space (Ramers Reference Ramers1988, Strange & Bohn Reference Strange and Bohn1998), lax as opposed to tense vowels are also characterized in production and perception by shorter durations (e.g. Jessen Reference Jessen1993). Vowel duration, however, is not only an important cue to the phonemic vowel length contrast; it varies intrinsically also as a function of the post-vocalic obstruent's underlying fortis–lenis distinction: vowels are generally shorter before fortis than lenis stops (Chen Reference Chen1970, Kohler Reference Kohler1977). Although this inverse relationship between intrinsic vowel and consonant duration is not universal (Mitleb Reference Mitleb1984) and depends, for example, on prosody (Davis & Summers Reference Davis and Van Summers1989), it is nevertheless well documented for a number of languages (see Ladefoged & Maddieson Reference Ladefoged and Maddieson1996). Kluender, Diehl & Wright (Reference Kluender, Diehl and Wright1988) argued that these complementary timing patterns aid the perception of phonemic contrasts such that longer closure durations are perceptually enhanced by a shortening of the preceding vowel duration (but see Fowler Reference Fowler1992, for a different account). The vowel length contrast, on the other hand, seems to have little influence on post-vocalic consonant durations (Braunschweiler Reference Braunschweiler1997, Restle & Mooshammer Reference Restle and Mooshammer1999).
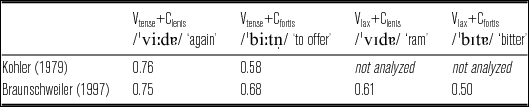
Since languages like Standard German freely combine tense–lax vowels (V) and fortis–lenis consonants (C), the resulting timing patterns are complex. Phonemic contrasts are primarily signaled by V to V+C ratios that are characteristic for a given vowel + stop combination (see Table 1). All four combinations occur in intervocalic, word-medial position in the German lexicon, although there is a frequency bias towards words with Vtense+Clenis and Vlax+Cfortis combinations (Kleber, John & Harrington Reference Kleber, John and Harrington2010). Words with tense vs. lax vowels also differ in the location of the syllable boundary: tense vowels in open syllables are followed by a syllable boundary while lax vowels in closed syllable are followed by an ambisyllabic consonant.
Mean ratios for V+C combinations plus one example per combination. The data from Braunschweiler (Reference Braunschweiler1997) has been recalculated following the method in Kohler (Reference Kohler1979).

The Central Bavarian dialect (which is spoken in the south-east of Germany and most parts of Austria) is distinct from Standard German as the correlation between vowel length and the fortis–lenis distinction has become phonologized: lenis (i.e. short) obstruents are preceded only by tense (i.e. long) vowels, while fortis (i.e. long) consonants are always preceded by lax (i.e. short) vowels. Because of this dialect feature, there are two possibilities for speakers of Central Bavarian to produce, e.g. the Standard German word /beːt / ‘to pray’: they either neutralize the vowel length contrast towards the lax vowel and produce a fortis stop as in [bet] or [bɛt] (which is then homophonous with Standard German /bɛt/ ‘beds’) or they realize a tense vowel but then they lenite the /t/ as [d] as in [beːdn] (see Wiesinger Reference Wiesinger and Russ1990: 449). Because of this co-dependency of vowel and stop length, the question arises as to whether one of the two (vowel length or fortis–lenis) is phonologically contrastive in Central Bavarian. Many dialectologists argue that a long (i.e. tense) vowel is a phonetic consequence of the lenis stop, i.e. the fortis–lenis contrast is phonological while vowel length is predictable (e.g. Hinderling Reference Hinderling1980, Scheutz Reference Scheutz and Wiesinger1984, Wiesinger Reference Wiesinger and Russ1990). We will refer to this view as the consonantal approach. Bannert (Reference Bannert1976), on the other hand, argues that complementary length within VC sequences is phonologically contrastive in Central Bavarian. Bannert (Reference Bannert1976) progressively shortened vowel durations and lengthened obstruent durations and found that such a shift in temporal structure was sufficient for native Bavarian listeners to perceive either a VtenseClenis or VlaxCfortis sequence. In other words, Bannert (Reference Bannert1976) proposed that prosodic quantity causes one sound to be long (either a vowel or a stop) and that the adjacent sound is then predictably short. This account will be referred to as suprasegmental. One of the major issues of the present study is to resolve this theoretical issue by analyzing Central Bavarian speakers’ realizations of the Standard German vowel length contrast not only before fortis stops but also before sonorant consonants. Since there is no phonemic length or fortis–lenis contrast in Standard German sonorants these consonants should not vary considerably in duration unless vowel and stop length are co-dependent. That is, if complementary length is decisive then Bavarians nevertheless should show longer sonorant durations after lax than after tense vowels. If, however, vowel length depends on the underlying fortis–lenis distinction of the following consonant in Central Bavarian varieties, then Bavarians should suspend the tense–lax contrast before sonorants, given that there are no long vs. short sonorants.
The second main aim is to investigate whether the dialectal feature of complementary length levels out in younger generations of Bavarians. Dialect leveling is defined as a diachronic process during which regional varieties become more similar to the standard language (Trudgill Reference Trudgill1986, Kerswill Reference Kerswill, Britain and Cheshire2003) or a close dialect (Hinskens Reference Hinskens1998) as a result of increased speaker mobility and language contact (Milroy Reference Milroy2002), i.e. external factors. The reasoning for predicting a contact-induced change for Central Bavarian is that there is evidence for two other sound changes in progress in German regional varieties, both of which appear to be due to contact with Standard German. In Augsburg Swabian an /s-ʃ/-merger before /t/ is being undone (Bukmaier, Harrington & Kleber Reference Bukmaier, Harrington and Kleber2014) and in East Franconian the intervocalic fortis–lenis merger is being reversed (Harrington, Kleber & Reubold Reference Harrington, Kleber, Reubold, Fuchs, Weirich, Pape and Perrier2012). The presence of a phonemic fortis–lenis and a /st/–/ʃt/ contrast in Standard German makes dialect leveling the likely cause for these changes. Assuming that these contrasts used to be completely suspended in the broad dialects, then these processes could not have been triggered by phonetically motivated internal factors such as synchronous consonant gradation in spontaneous speech (Kohler Reference Kohler1984, Bauer Reference Bauer2008) given that mergers are considered to be irreversible by linguistic means (see Labov Reference Labov1994, for a detailed discussion). Dialect leveling, on the other hand, is one of the key mechanisms for stopping linguistically motivated or regular sound changes (Wrede Reference Wrede1919, Hinskens Reference Hinskens1998).
In order to examine whether a sound change involving a loss of complementary length in Central Bavarian may be underway, we acoustically analyzed minimal pair words with the vowel length contrast before fortis stops produced by younger and older Bavarians (Section 2). These words were taken from a larger corpus of German regional varieties designed for apparent-time analyses. Unfortunately, the corpus does not contain Standard German speech data, but the regional variety of Saxon German which is represented in this corpus is suited for a comparison with Bavarian given that this variety has a phonological vowel length contrast as found in Standard GermanFootnote 1 (see also Section 2.2.1.1). The acoustic analysis was supplemented by a follow-up perception experiment (Section 3).
2 Speech production
The hypotheses to be tested in speech production are as follows:
(H1prod) Bavarian speakers, but not Saxon speakers, signal the tense–lax vowel distinction before fortis stops by means of an additional cue, namely stop closure duration.
(H2prod) Bavarian speakers will lengthen sonorants after lax vowels to a greater extent than Saxon speakers (assuming that complementary length, rather than vowel length, is phonologically contrastive in Bavarian).
(H3prod) H1prod and H2prod will be more apparent for older than younger Bavarians (on the assumption that there is a greater tendency for younger Bavarians to tend towards a more standard pronunciation). There will be no differences between younger and older Saxons since Saxon German has a phonemic vowel length.
2.1 Method
2.1.1 Speech materials and recordings
To investigate hypotheses H1prod–H3prod we chose from the above-mentioned corpus the following minimal pairs differing in Standard German with respect to the vowel in the lexically accented syllable nucleus:

The post-vocalic consonant was either an alveolar fortis stop or an alveolar sonorant. Despite the difference in syllable boundary location, disyllabic words have the advantage of precise closure duration measurements and they facilitate the comparison with the claims made in the literature given that the majority of words investigated by Bannert (Reference Bannert1976) were of a disyllabic structure, too.
Recordings for this corpus were made in quiet rooms at the speakers’ homes in the respective dialect areas (see Section 2.1.2 below) using a Sennheiser USB headset, a MobilePre USB audio interface and the SpeechRecorder software (Draxler & Jänsch Reference Draxler and Jänsch2004) that was installed on a laptop computer (Toshiba Tecra). The sampling rate was 44.1 kHz. Ten repetitions of each target word (the ten words mentioned above plus 36 other words) were presented to speakers one at a time in randomized order with two seconds between each presentation. The preset time limit and the large number of different words reduces the likelihood of hyper-articulation, making the corpus suitable for the analysis of regional and age-dependent fine phonetic differences.
2.1.2 Speakers
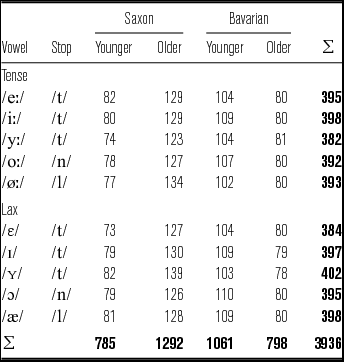
The corpus was read by 42 younger and older speakers from the Central Bavarian areas Munich and Altötting (c.100 km east of Munich) as well as from the city of Dresden and immediate surrounds where Saxon is spoken. The complete data sets for one older Bavarian and one younger Saxon speaker were excluded because none of the repetitions were read correctly for at least one of the ten test words. Thus, the Saxon speaker group comprised 13 older (five female and eight male, aged 50–80 years) and eight younger speakers (five female and three male, aged 18–40 years) and the Bavarian speaker group comprised eleven younger (eight female and three male, ten aged 20–30 years and one aged 43 years) and eight older speakers (five female and three male, aged between 50–80 years).Footnote 3 In cases where it was obvious that the subject read a different test word than the one presented on the screen, the tokens were relabeled.Footnote 4 This was done in 2.3% of the words, which were primarily produced by Saxon speakers. Sixty-four tokens had to be excluded because they were misread or uttered too late in the course of the recording, resulting in an incomplete signal. The distribution of the 3936 tokens that were included in the analyses presented below is given in Table 2.
Number of analyzed tokens shown separately for each vowel and for younger and older Saxon and Bavarian speakers.

2.1.3 Segmentation and data analysis
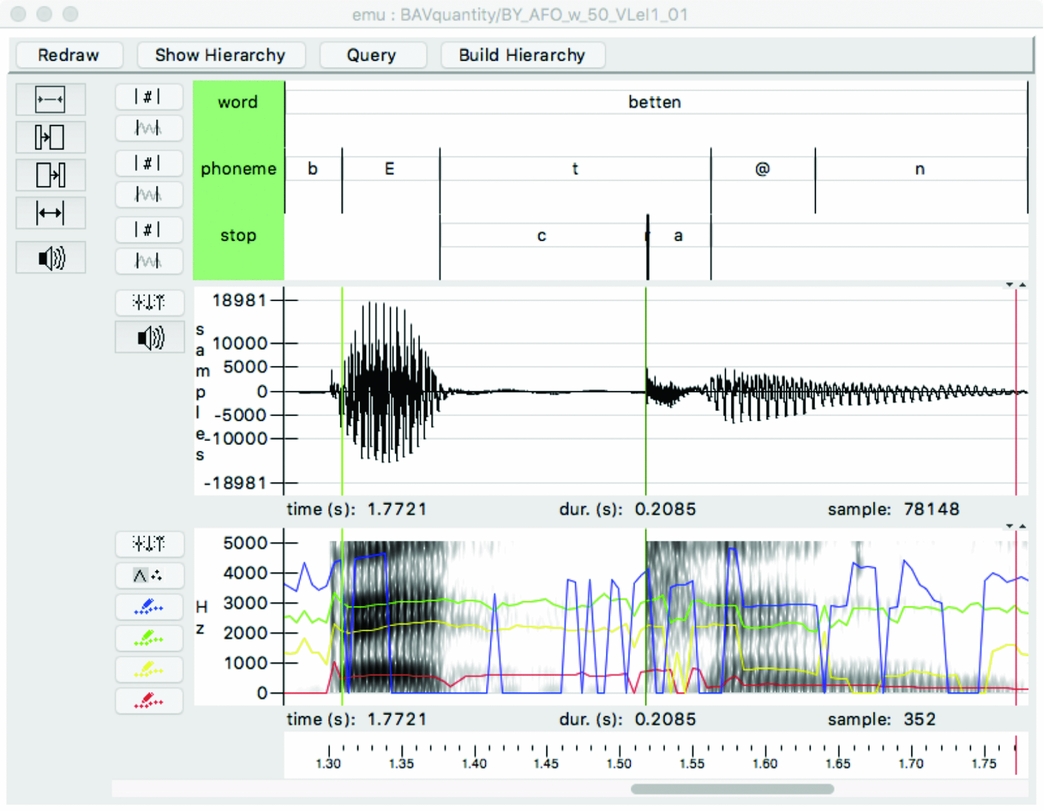
The data were automatically segmented with MAUS (Schiel Reference Schiel2004) and the segment boundaries were then checked and adjusted manually in Praat (Boersma & Weenink Reference Boersma and Weenink2008) according to the following criteria. The on- and offset of the vowel were always set to the beginning and end of a clearly visible second formant (F2). The vowel's offset coincides with the consonant's onset. The consonant's offset was placed at the beginning of the voicing of the following vowel if the consonant was a stop or at a clearly visible F2 if the consonant was a sonorant. The stop was further segmented into closure, burst and aspiration (= VOT) phases. The Praat TextGrid-files were then converted into Emu format and all files stored as an Emu speech database (Harrington Reference Harrington2010; see Figure 1). Although the focus of this study is on vowel length, we additionally tested for differences in vowel quality. We therefore calculated the first four formant frequencies in Emu with the following parameters: LPC order of 10, a pre-emphasis of 0.95, and a 30 ms Blackman window with a frame shift of 5 ms. The formant data were checked manually and obvious formant-tracking errors were hand-corrected if necessaryFootnote 5 both by inspection of the spectrograms and identification of outliers from plots showing the trajectories of the first (F1), second and third formant over the course of the entire vowel.
Segmentation example of the word betten produced by an older female Bavarian speaker. The bottom panel shows the spectrogram and the superimposed formant frequencies. Obvious formant-tracking errors (as shown here in blue for the forth formant frequency) have been corrected. The formant frequencies and the duration of the accented vowel (here E) and the closure phase (c) have been extracted from this emu-database in R.

The formant frequencies as well as the durations in milliseconds of the accented vowel (Vdur), the closure of the medial stop (Closdur) and of the sonorant (Sdur) were extracted in R using the emu package. We then calculated the Vdur/(Vdur+Closdur) ratio and the Vdur/(Vdur+Sdur) ratio. The degree of contrast maintenance Diffobs (or Diffson) is the difference between the mean Vdur/(Vdur+Closdur) ratio (or Vdur/(Vdur+Sdur) ratio) of all ten repetitions of the lax vowel words and the mean Vdur/(Vdur+Closdur) ratio (or Vdur/(Vdur+Sdur) ratio) of all tense vowel words per speaker and per minimal pair resulting in 200 values (5 minimal pairs × 40 speakers). The following measures were our dependent variables: Vdur/(Vdur+Closdur) ratio, F1 and F2 frequencies at the temporal midpoint of the vowel (Section 2.2.1) and ln(Vdur), ln(Closdur), ln(Sdur), Diffobs, and Diffson (Sections 2.2.2 and 2.2.3). Natural logs (ln) were used instead of the absolute durations to demonstrate the duration range within a vowel category (i.e. tense vs. lax) independently of the greater variation inherent to tense compared to lax vowels (Mooshammer & Geng Reference Mooshammer and Geng2008).
Obstruents (Section 2.2.2) and sonorants (Section 2.2.3) were analyzed separately. If not indicated otherwise, repeated-measure ANOVAs were conducted with Region (two levels: Bavarian vs. Saxon), Age (older vs. younger) and Vowel length (tense vs. lax vowels) as fixed factors; speaker was entered as a random factor. Since we were not interested in any effects of vowel quality on duration ratios, we averaged across the three minimal pairs with fortis stops and the two minimal pairs with sonorants, respectively, per speaker.Footnote 6
2.2 Results
2.2.1 Preanalyses
In order to factor out potential artifacts in the duration analyses described in 2.2 we carried out the following preanalyses.
2.2.1.1 /t/-lenition
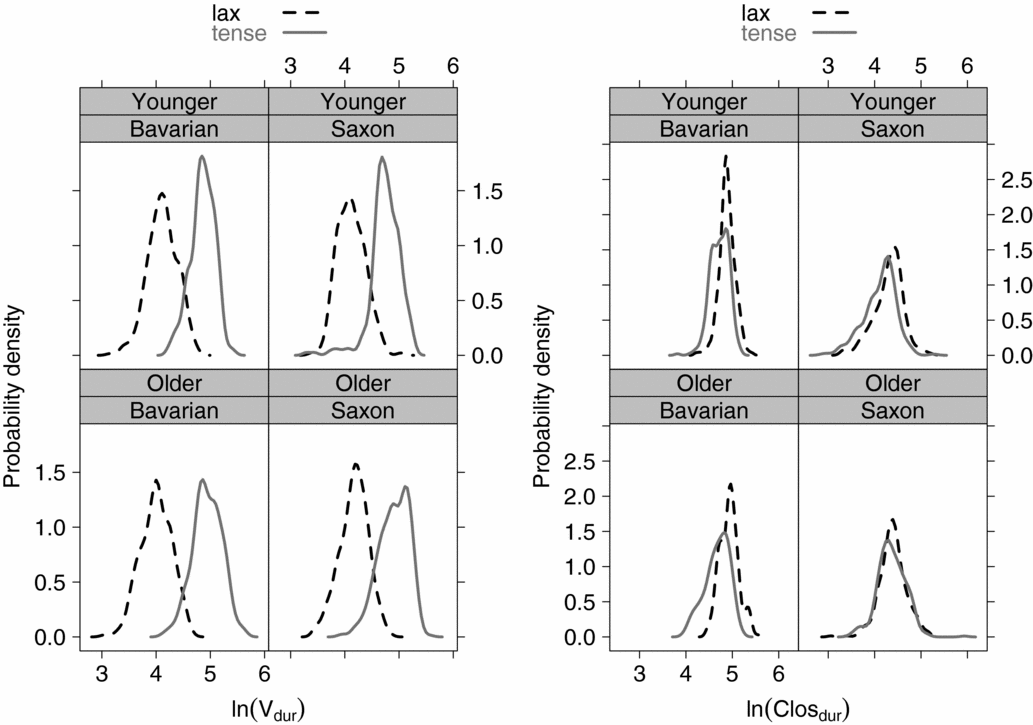
In the Saxon variety of German the opposition between fortis and lenis stops can be neutralized in favor of the lenis stops in all contexts (Bergmann Reference Bergmann and Russ1990). A mixed model with Vdur/(Vdur+Closdur) ratio as the dependent variable and speaker and word (beten vs. betten vs. bieten vs. bitten vs. Hüte vs. Hütte) as random factors revealed a significant effect for the fixed factor Region (χ2 = 45.1, p < .001) but neither for Age nor for the interaction between these two. Independent of the underlying vowel length Saxon speakers show a general tendency to produce fortis stops with a shorter closure phase than Bavarian speakers (see the right panel of Figure 2), but their mean Vdur/(Vdur+Closdur) ratios were still in the range of fortis stop values (see Table 1 above). The most important finding from this preanalysis, however, is that the extent of /t/-lenition was the same for older and younger Saxons.
Probability density plots of ln(Vdur) (left panel) and ln(Closdur) (right panel) in all lax (dashed, black) and tense (solid, gray) vowel words with post-vocalic stops separately for the four speaker groups.

2.2.1.2 Deletion of schwa
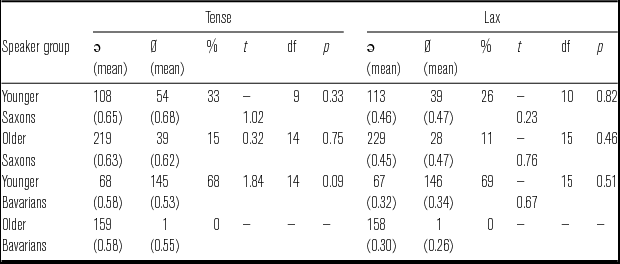
Since previous studies showed that a following schwa may influence the duration of the preceding consonant (Davidson Reference Davidson2006, Torreira & Ernestus Reference Torreira and Ernestus2011), we analyzed the occurrence of schwa deletion in all target words with en-ending and tested whether the absence vs. presence of a schwa (i.e. a nasal vs. oral release) had an effect on the Vdur/(Vdur+Cdur) ratio. If Cdur was longer in tokens containing a schwa compared to those where the schwa was deleted then the Vdur/(Vdur+Cdur) ratio should be smaller in the former vs. the latter tokens all else being equal.
As shown in Table 3, Saxon speakers realized the schwa in 70% to 90% of all tokens and younger Saxons did so on average to a greater extent. The age difference, however, was far more pronounced in the Bavarian speaker group with younger Bavarians deleting schwa in almost two thirds of all instances and older Bavarians almost never. Schwa deletion was highly speaker dependent but not word dependent, i.e. speakers either deleted or realized the schwa and they did so irrespective of the word (see appendices in Kleber Reference Kleber2011). Out of 1574 words with en-ending, 214 lax vowel words and 239 tense vowel words were produced without a schwa. Because of the high inter-speaker variation, we compared the mean Vdur/(Vdur+Cdur) ratios between tokens with and without schwa separately for lax and tense vowel words within each of the three speaker groups younger and older Saxons and younger Bavarians using two-sample t-tests. Neither of the tests reached significance (see Table 3), indicating that Vdur/(Vdur+Closdur) ratios were not significantly influenced by whether the stops were released orally or nasally.
Number of tokens with schwa (ə) and with schwa deletion (Ø) and their mean Vdur/(Vdur+Cdur) ratios, the percentage of tokens with schwa deletion, and the t, df, and p-values from the two-sample t-tests shown separately for tense and lax vowels from younger and older, Saxon and Bavarian speakers.

2.2.1.3 Formant frequency analysis
Two separate mixed models with F1 and F2 frequencies, respectively, as dependent variables, Region, Age and Vowel length (two levels each) as fixed factors and speaker and minimal pair (beten–betten vs. bieten–bitten vs. Hüte–Hütte vs. Sohne–Sonne vs. Höhle–Hölle) as random factors both revealed a significant three-way interaction effect between Region, Age, and Vowel length (F1: χ2 = 12.4, p < .001; F2: χ2 = 6.0, p < .05). Subsequent post-hoc tests showed significant differences between the F1 and F2 frequencies of tense and lax vowels in all four speaker groups but no other significant differences. Compared to their tense counterparts, lax vowels showed significantly higher F1 frequencies in all minimal pairs and significantly lower and higher F2 frequencies in minimal pairs with front unrounded and back vowels, respectively, indicating that they were produced with a more open and centralized vowel quality. These patterns show that all speaker groups distinguished tense and lax vowels in terms of quality and that they did so to the same extent. Since neither Region nor Age affected F1 and F2 frequencies significantly, all between speaker group differences for tense–lax vowels described in the next section are therefore entirely due to duration.
2.2.2 Obstruents
This section investigates target words containing fortis stops and tests whether Bavarians not only vary vowel but also closure duration to signal tense vs. lax vowels.
As can be seen in the left panel of Figure 2 vowel duration was shorter for lax than for tense vowels in all speaker groups (on average 71.2 ms, sd = 13.7), i.e. Bavarian speakers did not neutralize the vowel length contrast. This observation was confirmed by a significant main effect for Vowel length (F(1,36) = 862.4, p < .001) revealed by a repeated-measures ANOVA with ln(Vdur) as the dependent variable. There were no other significant effects except for two significant interaction effects between Region and Vowel length (F(1,36) = 10.4, p < .01) as well as between Age and Vowel length (F(1,36) = 8.2, p < .01). These significant interactions already suggest that the tense–lax distinction was pronounced differently by Bavarians vs. Saxons as well as by older vs. younger speakers, but before we look at these differences in more detail below, we need to determine the variation within closure duration.
A second repeated-measures ANOVA with ln(Closdur) as the dependent variable revealed significant main effects for Vowel length (F(1,36) = 52.4, p < .001) and Region (F(1,36) = 67.5, p < .001) as well as significant interaction effects between Vowel length and Region (F(1,36) = 7.7, p < .01) and Vowel length × Region × Age (F(1,36) = 10.7, p < .01). The right panel of Figure 2 shows that closure durations were slightly shorter after tense vowels and more so in tokens produced by Bavarians (on average 25 ms, sd = 7.9) and younger Saxons (12.4 ms on average) compared to older Saxons (1 ms on average). This indicates that Bavarians vary the duration of the fortis stop depending on the underlying length of the preceding vowel.
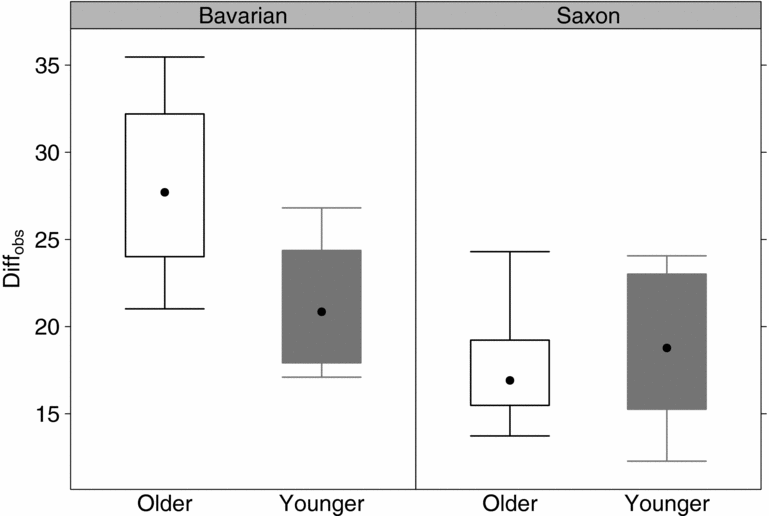
This co-dependency between vowel and closure durations is most pronounced for older Bavarian speakers, as shown by the Diffobs values (the measure for quantifying the neutralization degree) in Figure 3. The greater Diffobs values for older Bavarians are a consequence of the enhanced vowel and closure duration differences between lax and tense vowel tokens found for this speaker group. A repeated-measures ANOVA with Diffobs as the dependent variable revealed significant main effects for Region (F(1,36) = 24.9, p < .001) and Age (F(1,36) = 4.4, p < .05) and a significant interaction between these two factors (F(1,36) = 8.9, p < .01). Commensurate with Figure 3, Diffobs was greatest for older Bavarians and smallest for Saxons. While there was no difference between older and younger Saxons, a regression analysis with Diffson as the dependent variable and speaker group coded for increasing order (three ordered levels: older Bavarians > younger Bavarians > older Saxons)Footnote 7 as independent variable confirmed that there was a significant trend from older Bavarians to older Saxons with younger Bavarians taking up an intermediate position (χ2(1) = 23.3, p < .001).
Mean Vdur/(Vdur+Closdur) ratio differences between tense and lax vowels before obstruents (Diffobs) averaged across all three minimal pairs shown separately for younger and older, Bavarian and Saxon speakers. Each of the four boxes contains one data point per speaker.

2.2.3 Sonorants
In this section we investigate vowel durations before sonorants which allows us to investigate whether complementary length is decisive (as claimed by Bannert Reference Bannert1976 in the suprasegmental approach) or whether vowel length is allophonic (as claimed in the consonantal approach, e.g. Hinderling Reference Hinderling1980).
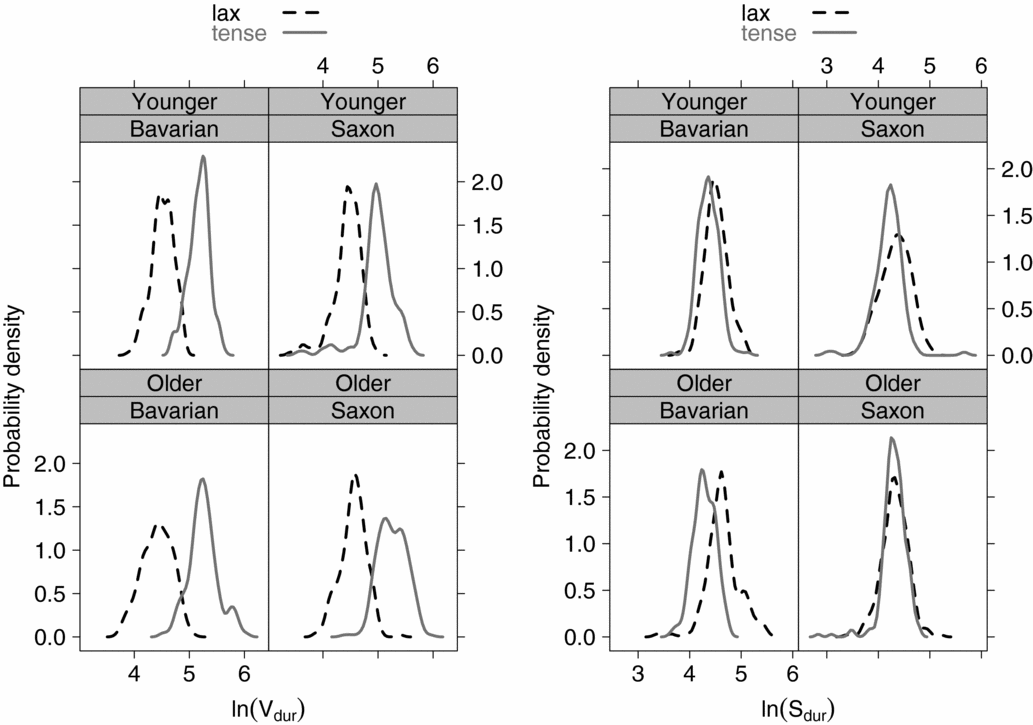
A repeated-measures ANOVA with ln(Vdur) of all words containing a sonorant as dependent variable, and Vowel length, Region, and Age as fixed factors showed a significant main effect of Vowel length (F(1,36) = 857.9, p < .001) and two significant interaction effects between Region and Vowel length (F(1,36) = 6.9, p < .05) as well as Age and Vowel length (F(1,36) = 13.2, p < .01). The significant main effect confirms that vowel duration was – commensurate with the left panel of Figure 4 – significantly shorter in lax than in tense vowels. This vowel duration difference was in general greater for Bavarian (older: 113 ms; younger: 86.3 ms) than Saxon (older: 101 ms; younger: 65 ms) speakers and in older than in younger speakers (as the interaction effects show), but the age difference was about the same for both dialect groups. The main conclusion from this analysis is that Bavarians did not neutralize the vowel length contrast before sonorants.
Probability density plots of ln(Vdur) (left panel) and ln(Sdur) (right panel) in all lax (dashed, black) and tense (solid, gray) vowel words with post-vocalic sonorants separately for the four speaker groups.

A second repeated-measures ANOVA with the same fixed factors but with ln(Sdur) as the dependent variable revealed again a significant main effect for Vowel length (F(1,36) = 33.5, p < .001) but also for Region (F(1,36) = 8.3, p < .01). As can be seen from the right panel of Figure 4, sonorants were longer after lax than after tense vowels and this lengthening effect was more pronounced for Bavarians (older: 35.7 ms; younger: 14 ms) than for Saxons (older: 1.3 ms; younger: 10.8 ms) which is also shown in the significant two-way interaction between Region and Vowel length (F(1,36) = 13.0, p < .01). Furthermore, a three-way interaction between Region × Age × Vowel length (F(1,36) = 10.8, p < .01) suggests that the sonorant duration difference was greater in older Bavarians than in younger Bavarians and in lax than in tense vowels.
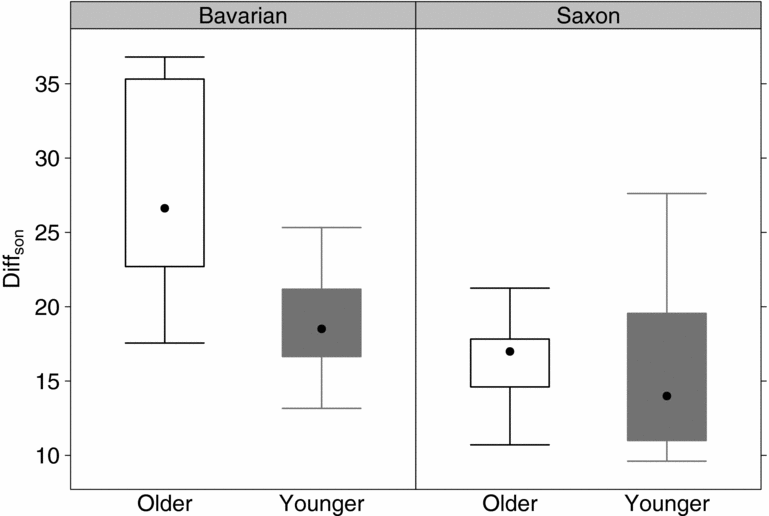
This regional age difference becomes even more apparent in the Vdur/(Vdur+Sdur) ratio difference. A repeated-measures ANOVA with Diffson as dependent variable and Region and Age as fixed factors showed significant main effects for Region (F(1,36) = 22.9, p < .001) and Age (F(1,36) = 8.1, p < .01) and a significant interaction between these two factors (F(1,36) = 7.3, p < .05). Commensurate with Figure 5, Diffson was greatest for older Bavarians and smallest for Saxons. While there was no difference between older and younger Saxons, a regression analysis with Diffson as the dependent variable and speaker group coded for increasing order (three ordered levels: older Bavarians > younger Bavarians > older Saxons) as independent variable confirmed that there was a significant trend from older Bavarians to older Saxons with younger Bavarians taking up an intermediate position (χ2(1) = 20.9, p < .001). The enhanced Diffson difference for Bavarians is due to greater sonorant lengthening as the above statistics and Figure 4 show. This finding also suggests that sonorant lengthening after lax vowels is not purely phonetic but differs between speaker groups depending on the phonological system of the dialect.
Mean Vdur/(Vdur+Sdur) ratio differences between tense and lax vowels before sonorants (Diffson) averaged across the two minimal pairs shown separately for younger and older Bavarian and Saxon speakers. Each of the four boxes contains one data point per speaker.

2.3 Discussion
Three main conclusions arise from the acoustic analysis: (i) Bavarians do not neutralize the vowel length contrast before fortis obstruents or before sonorants; (ii) Bavarians show more robust differences between tense and lax vowels than Saxons because they shorten and lengthen the post-vocalic consonants after tense and lax vowels, respectively; and (iii) the regional differences between Bavarians and Saxons are more pronounced for older speakers.
The first two findings support hypotheses H1prod and H2prod which predicted the realization of the vowel length contrast before fortis obstruents and sonorants by speakers of Bavarian. The vowel length contrast was produced in terms of different vowel and – to a lesser extent – consonant durations. Phonetic lengthening of consonants following lax vowels could be possibly a result of closed syllable vowel shortening (Maddieson Reference Maddieson and Fromkin1985) or longer ambisyllabic consonants (see Restle Reference Restle2003). However, such phonetic lengthening should be present in all speaker groups given that the syllabification rules in the test words are the same. The results for the Saxon control group speakers showed indeed slightly longer consonants after lax vowels but this effect was much stronger for Bavarian speakers who produced the sonorants and underlying fortis stops in the Standard German target words with significantly different durations depending on the preceding vowel. Interpreting the differences in vowel duration as a corollary of a phonemic fortis–lenis contrast in stops would be in line with the predictions made by the consonantal approach. On the other hand, the finding that Bavarian speakers not only realize the vowel length contrast before sonorants but do so by an additional duration difference in sonorants that depends on the underlying length of the preceding vowel suggests either that vowel length is not allophonic in Bavarian or that Bavarian has a phonemic opposition between long and short consonants (see Seiler Reference Seiler2005). The latter idea is consistent with the consonantal approach but it would again raise the question as to whether vowel or consonant quantity is phonemic in Bavarian given their mutual predictability. Alternatively, these results provide phonetic evidence in support of Bannert's suprasegmental account under which complementary length is phonemic in Bavarian – as opposed to other German varieties with contrastive vowel length, in this case Saxon. Since there is no conclusive evidence for a quantity contrast in sonorants in the broad Bavarian dialect (see General Discussion below) and to avoid an analysis in which the phonemic status of either vowel or consonant quantity remains controversial, we follow Bannert's model of complementary length in Bavarian.
Our third hypothesis addressed the issue of dialect leveling in Bavarian. Patterns of complementary length were more prominent for older than younger Bavarian speakers in the data, which is in line with the hypothesis that Bavarian is undergoing dialect leveling. Younger Bavarians tend to signal the contrast between tense and lax vowels independently of the following consonant whereas older Bavarians vary the duration of the consonant accordingly.
3 Speech perception
This section presents results from a perception experiment, its aim being to examine whether the emerging two-contrast-system in Bavarian – in which vowel length and fortis–lenis can be freely combined – is also observable in perception. This was done by investigating whether the four speaker groups interpreted acoustically ambiguous stimuli differently and if so towards which phonemic categories their perception was shifted. For this purpose, we used a Vdur/(Vdur+Closdur) ratio continuum from Hagen /haːɡən/ (a male first name and the name of a German city) to hacken /hakən/ ‘to chop’ that was judged in a two- and a three-alternative-forced-choice (2AFC vs. 3AFC) task, the latter serving as a control. These specific words (and not one of the minimal pairs from the corpus of Section 2)Footnote 8 were chosen for two reasons. First, compared to all other vowel length pairs, the Standard German /aː/ vs. /a/ opposition is manifested by vowel duration alone and not by vowel quality (see e.g. Jessen Reference Jessen1993, also Section 2.2.1.3 above). Second, and this is the reason for using post-vocalic /k/ instead of /t/, this particular continuum covers a three-way contrastFootnote 9 from VːC to VːCː to VCː (a following ː refers to either a tense vowel or fortis stop, while the absence of this length marker indicates a lax vowel or lenis stop) with the VːCː combination corresponding to the German word Haken /haːkən/ ‘hook’. The main research question was: To which phonemic category combination do (older) Bavarians assign VC-timing patterns that do not occur in their dialect? The following two specific hypotheses (the first one formulated to allow for two possible scenarios) were tested in the 2AFC task, where only Hagen and hacken responses were possible:
(H1perc) Bavarians assign stimuli from the middle of the continuum either more often to hacken (compared to Saxons) if they reinterpret a VːCː timing pattern as VCː, or to Hagen if they reinterpret it as VːC.
(H2perc) The perceptual bias towards one or the other word predicted in H1perc will be less pronounced in younger than in older Bavarians (assuming that younger Bavarians will randomly assign a VːCː pattern to words with a VːC and VCː sequence, because all patterns occur in Standard German).
With reference to the literature on Central German lenition (e.g. Bergmann Reference Bergmann and Russ1990) and the findings in Kleber (Reference Kleber2011, Reference Kleber, Krefeld and Pustka2014) we included a third hypothesis:
(H3perc) Saxons will perceive more stimuli as Hagen commensurate with the tendency to lenite fortis stops in production, i.e. to realize them with shorter closure duration.
3.1 Method
3.1.1 Listeners
Eleven younger (mean age 25.7 years, eight females) and 11 older (mean age 52.2 years, seven females) Bavarians as well as 11 younger (mean age 24.4 years, six females) and 11 older (mean age 59.5 years, seven females) Saxons participated in the perception experiment.Footnote 10 Ten of the 44 listeners also participated in the production task analyzed in Section 2: of these, three were from the older Bavarian, three from the younger Saxon and four from the older Saxon group.
3.1.2 Stimuli and experimental set-up
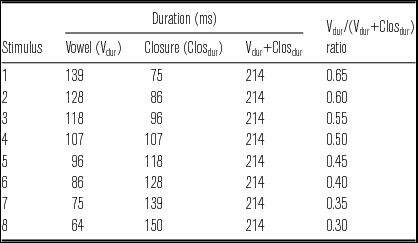
The stimuli were based on a natural production of Hagen spoken by a 47-year-old male Standard German speaker from Lower Saxony (an area where a regional variety is spoken that is very close to Standard German), who was recorded at a sound-attenuated booth at the Institute of Phonetics and Speech Processing in Munich. The sampling rate was 44.1 kHz. This natural production with a nasal release (i.e. no schwa and no aspiration) and a Vdur/(Vdur+Closdur) ratio of 0.65 (vowel: 139 ms; stop: 75 ms)Footnote 11 was taken as the first stimulus of the continuum (see Table 4). Any residuals to voicing during closure were removed prior to the manipulation of the other stimuli so that the Vdur/(Vdur+Closdur) ratio remained the only available cue. The remaining seven stimuli were derived by successively shortening the vowel and lengthening the closure phase of the stop, respectively, using the manipulation function in Praat. As seen in Table 4, the Vdur+Closdur duration was kept constant throughout the continuum and the step size with which the Vdur/(Vdur+Closdur) ratios varied between stimuli was 0.05. To ensure the validity of the Vdur/(Vdur+Closdur) ratios, vowel and stop durations were compared against ten repetitions each of natural productions of Hagen (from which the first stimulus was chosen; mean Vdur/(Vdur+Closdur) ratio: 0.65), Haken (mean Vdur/(Vdur+Closdur) ratio: 0.49), and hacken (mean Vdur/(Vdur+Closdur) ratio: 0.30) that were obtained from the same model speaker prior to the creation of the continuum. The stimuli were then spliced into the carrier phrase Maria hat [Stimulus] gesagt (literally: ‘Maria has [stimulus] said’).
Vowel and closure durations (rounded to nearest ms) as well as the Vdur/(Vdur+Closdur) ratios for each of the eight stimuli of the Hagen–hacken continuum.

Ten repetitions of each stimulus sentence were presented to the listeners in randomized order on a computer screen. The experiment was self-paced, i.e. there was no time-pressure for giving a response, but each token could only be listened to once. In the instructions given prior to the experiment the subjects were told to judge the stimuli as quickly as possible and that there were no wrong answers. After the 2AFC task was completed, all listeners judged the same stimuli (again repeated ten times each) in a control 3AFC task to further validate the stimuli. During this 3AFC task the participants were presented with all three words written orthographically on the screen (Hagen, Haken, or hacken) and asked which word they perceived. All 44 listeners perceived the first two stimuli most often as Hagen, the last two stimuli most often as hacken and stimuli 4 and 5 predominantly as Haken. Stimulus 3 and stimulus 6 were perceived as intermediate between categories: stimulus 3 was judged half of the time as Hagen and half of the time as Haken while stimulus 6 was judged half of the time as Haken and half of the time as hacken. In the remainder of this section we concentrate on the results of the 2AFC task.
Sigmoid functions were fitted to the responses using binary logistic regression separately per listener using the relation
 $$\begin{equation*}{p_a} = \frac{{{e^{\left( {m \cdot Stim + k} \right)}}}}{{1 + {e^{\left( {m \cdot Stim + k} \right)}}}}\end{equation*}$$
in which pa was the proportion of hacken responses, Stim the stimulus number in the continuum, and m and k the listener-specific slope and intercept respectively. 50% decision boundaries were obtained for each listener from –k/m.
3.2 Results
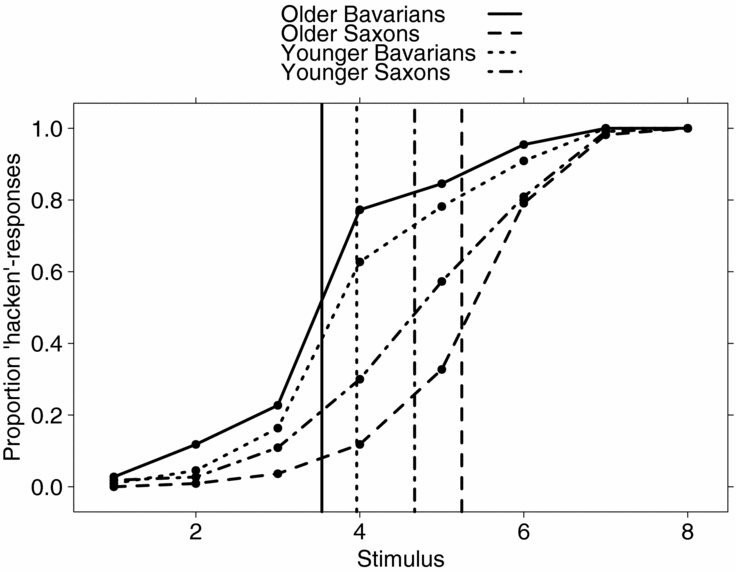
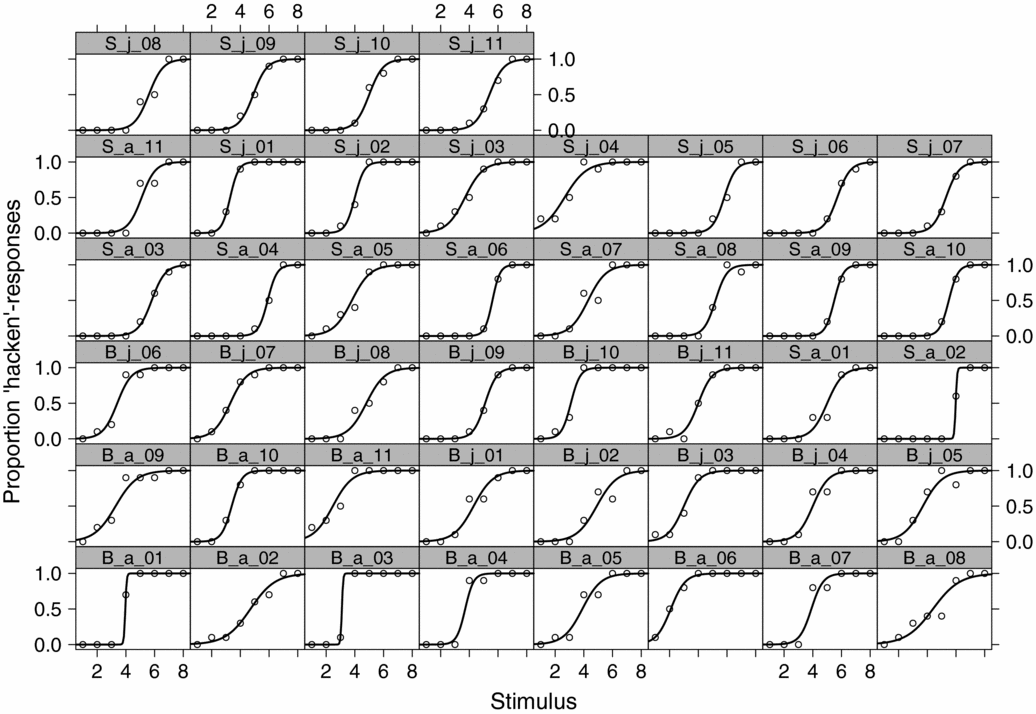
Figure 6 shows that the average response curves for the four listener groups (see Figure A1 in the appendix for speaker-specific response curves) are (i) left-shifted for Bavarian as opposed to Saxon listeners and (ii) closer together for younger than older speakers. Bavarian listeners, and in particular older Bavarian listeners, perceived more stimuli as hacken, while Saxon listeners judged considerably more stimuli as Hagen. Stimulus 3 and stimulus 6, judged as ambiguous during the 3AFC task (reported above), were now unambiguously assigned to the adjacent categories Hagen (stimulus 3) and hacken (stimulus 6). The assignment of stimuli 4 and 5, however, differed according to listener group. Bavarians classed the majority of these VːCː stimuli as VCː (hacken) while Saxons judged the same stimuli more often as Hagen, i.e. as VːC. The intermediate positions of the younger listener groups’ category boundaries as well as their (slightly) flatter psychometric curves indicate that they assigned the Haken-like stimuli from the middle of the continuum fairly randomly to one of the two words compared to the older speakers from the same region (stimulus 4: older Bavarians = 77.3% vs. younger Bavarians = 62.7%; stimulus 5: older Saxons = 32.7% vs. younger Saxons = 57.2%).
Proportional hacken-responses averaged across listeners separately for older and younger, Bavarians and Saxons responding to the eight-step continuum. The decision boundaries averaged across listeners per listener group are shown as vertical lines.

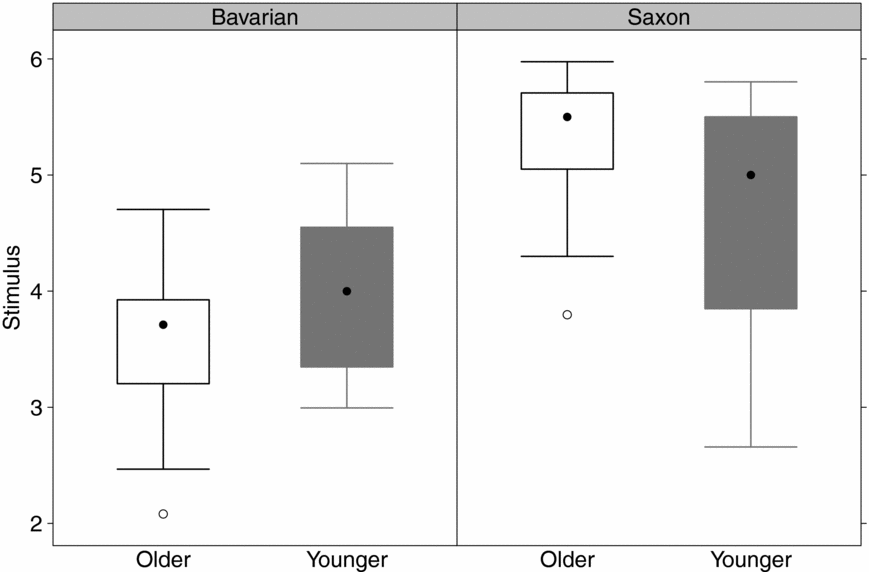
The superimposed mean decision boundaries in Figure 6 as well as the distribution of listener-specific decision boundaries in Figure 7 support these observations. The greater variation in younger vs. older listeners’ boundary location along the continuum mirrors the less pronounced bias towards one category. A repeated-measures ANOVA with the 50% decision boundary as the dependent variable and with the two between-subject factors Region (two levels: Bavarian, Saxon) and Age (two levels: Older, Younger) as independent variables showed a significant main effect for Region (F(1,40) = 23.0, p < .001) but not for Age. The significant main effect for Region is consistent with the greater proportion of hacken-responses for Bavarian listeners (indicated by the left-shifted decision boundaries and lower boundary values). Post-hoc Bonferroni corrected t-tests revealed that only older Bavarians and older Saxons differed significantly in the placement of the decision boundaries along the Hagen–hacken-continuum (t(19.6) = –5.47, p < .001). However, a regression analysis with decision boundary as the dependent variable and listener group coded for increasing order (four ordered levels: older Bavarians > younger Bavarians > younger Saxons > older Saxons) as independent variable showed a significant effect of listener group (R2 = 0.40, F(1,42) = 28, p < .001), and thus confirmed the observation in Figure 7 that there is a significant trend from older to younger Bavarians to younger and to older Saxons.
Distribution of the 50% decision boundaries separately for older (white) and younger (gray), Bavarian (left) and Saxon (right) listeners. Each of the four distributions consists of one decision boundary per speaker.

3.3 Discussion
The first finding of the perception experiment was that Bavarian listeners perceive ambiguous stimuli more often as hacken, which was one of the two scenarios predicted in hypothesis H1perc. Saxon listeners, on the other hand, perceive the same ambiguous stimuli more often as Hagen. This result supports hypothesis H3perc which predicted this outcome because of the general tendency for Saxons to lenite fortis stops in production and perception (see Kleber Reference Kleber2011, Reference Kleber, Krefeld and Pustka2014), i.e. Saxon listeners interpret the stop as lenis and as a consequence the vowel as tense. Bavarian listeners, however, interpret Vdur/(Vdur+Closdur) ratio at or below 0.5 as variants of the VCː combination, i.e. ambiguous stimuli are perceived as lax vowel plus fortis stop sequences.
Hypothesis H2perc predicted that this perceptual bias would be less marked in younger Bavarians and our findings are in line with this prediction. There was a significant trend for a less distinct bias towards hacken in younger Bavarians although the non-significant age effect in the ANOVA suggests that this effect is less pronounced in perception than production – as discussed further below. A further, unexpected finding was the apparent difference according to the age of the Saxon listeners. The trend analysis revealed that younger Saxons show perceptual lenition less often than older Saxons. This finding suggests a sound change in progress regarding the post-vocalic neutralization of the fortis–lenis contrast in Saxon for which only very tentative evidence was found in previous studies (see Kleber Reference Kleber2011, Reference Kleber, Krefeld and Pustka2014).
4 General discussion
The motivation for the present analysis was twofold: The first goal was to resolve whether vowel length in Bavarian is allophonic and the second goal was to investigate a sound change in progress in production and perception by which the context-dependency of the vowel length contrast diminishes.
More specifically, the first goal addressed the extent to which Bavarian and Saxon speakers maintain the Standard German vowel length contrast when they produce a regional variety of Standard German. According to the literature (e.g. Wiesinger Reference Wiesinger and Russ1990) there are two possible realizations of the vowel length contrast before a fortis obstruent in Central Bavarian: Bavarian speakers either neutralize the vowel length contrast towards lax vowels and produce a fortis, i.e. a long stop, or they preserve the contrast but additionally lenite (i.e. shorten) the stop when it occurs after a tense vowel. Our results from the production study showed that the tense–lax contrast before fortis stops was cued by Vdur/(Vdur+Closdur) ratio differences in both dialect groups and that the Vdur/(Vdur+Closdur) ratio differences between tense and lax tokens were greater for Bavarians than Saxon speakers. This regional difference was particularly marked for the lax vowel tokens. There are no indications that Saxons differ markedly in their degree of /t/-lenition after tense vs. lax vowels (see Figure 2) which would be one possible interpretation of the Vdur/(Vdur+Closdur) ratio differences between the two dialects. Instead it is much more likely that – commensurate with the description of complementary length in the literature – this difference comes about because Bavarian speakers distinguish tense and lax vowels via consonant as well as vowel duration.
As a consequence of the observed length distribution in Bavarian, the phonemic status of vowel length and stop length (i.e. whether it has a fortis–lenis contrast) is controversial. Our results for sonorant contexts present evidence in favor of Bannert's (Reference Bannert1976) model, which proposes complementary length within VC sequences and which contradicts the hitherto traditional consonantal approach that considers the fortis–lenis contrast to be phonemic and vowel length to be allophonic. First, Bavarians did not neutralize the Standard German vowel length contrast which would have been expected if vowel length was allophonic. Second, Bavarians showed considerable lengthening for sonorants even though there is no fortis–lenis contrast for sonorants and which cannot be explained by closed syllable vowel shortening because then the same amount of lengthening should be observed for the control speakers. Note that in the broad Central Bavarian dialect post-vocalic nasals are frequently deleted and/or the preceding vowel becomes nasalized (e.g. Standard German /ʃtaɪn/ ‘stone’ and /kɛnən/ ‘to know’ Central Bavarian /ʃtoã/ and /ɡẽna/) and that lateral consonants occur only in pre-vocalic position (in post-vocalic position laterals are vocalized, e.g. Standard German /hals/ ‘neck’, Central Bavarian /hɔɪz/). In order to produce the Standard German vowel plus sonorant sequence and to maintain the phonological vowel length contrast, Bavarian speakers apparently realize the sonorant in the same way that they lengthen stops to signal the fortis–lenis distinction. The correlation between vowel and consonant length in Bavarians’ sonorant realizations shows that differences in consonant duration should not be interpreted as signaling a phonemic fortis–lenis contrast; instead they contribute together with different vowel durations to phonemic complementary length. However, whether the complementary length pattern also occurs in monosyllabic words or before consonant clusters needs to be investigated experimentally in further studies (see e.g. Moosmüller & Scheutz in press).
The second goal of this study was to establish whether older Bavarians exploit the regionally marked Vdur/(Vdur+Closdur) ratio difference between lax and tense vowels to a greater extent than younger Bavarians, following the assumption that older speakers show more tendencies to preserve dialectal features in Standard German than younger speakers of the same speech community. Our production results indeed showed a significant trend for smaller Vdur/(Vdur+Closdur) ratio differences between lax and tense vowels in younger than in older Bavarians. Younger Bavarians’ ratio differences were approaching the ratio differences found for Saxons.
The Bavarian production results are in general compatible with those from the perception experiment that was designed to test whether the observed sound change can also be observed in perception. Bavarian listeners again showed a trend towards different categorizations of stimuli from a VːC to a VCː continuum: older Bavarians perceived more stimuli as hacken, i.e. they interpreted minimal vowel shortening and concurrent consonant lengthening as fortition whereas such a bias towards one category was less marked for younger Bavarians. Taken together, these results point to a sound change in progress by which the phonemic co-dependency between vowel and consonant length diminishes in younger speakers of Bavarian. Although the trend is observed both in production and perception, the Bavarian age group difference appears to be slightly less pronounced in perception, given the significant interaction effects with Age in production but not in perception (note that this observation is based on an indirect comparison because the participants in the two analyses were not the same). Surprisingly, we also found an apparent age effect in our control group of Saxon listeners that stands in contrast to the non-significant age effect in production. Drawing on previous findings in Kleber (Reference Kleber2011, Reference Kleber, Krefeld and Pustka2014), we predicted a tendency towards perceptual lenition for Saxons but no age difference within this group. The bias towards Hagen-responses, however, was more marked in older than in younger Saxons, which suggests that Saxons possibly also participate in a sound change by which the tendency to lenite fortis stops wanes (see also Kleber Reference Kleber, Krefeld and Pustka2014). Both of these mismatches imply that the two speech modalities may be out of alignment at a specific point in time during a sound change in progress. Whether the observed change in Bavarian has potentially progressed more in younger Bavarians’ production or in older Bavarians’ perception cannot be resolved here. However, such a mismatch between production and perception is taken as the origin of a sound change on the listener's side in a number of models of sound change (e.g. Ohala Reference Ohala and Jones1993, Harrington, Kleber & Reubold Reference Harrington, Kleber and Reubold2013) and support for the idea that changes in perception precede those in production has been presented in Kleber, Harrington & Reubold (Reference Kleber, Harrington and Reubold2012).
We argued in the introduction that these changes are more likely motivated by external factors such as language contact than by internal factors; although vowel length neutralization is an attested sound change in the world's languages which can be related to internal phonetic factors (Bauer & Warren Reference Bauer, Warren, Kortmann, Schneider, Burridge, Mesthrie and Upton2004). In particular, in domain-final position it is conceivable that vowel length neutralization emerges as a consequence of a diminished contrast preservation due to final lengthening (Kubozono Reference Kubozono, Gussenhoven and Warner2002, Myers & Hansen Reference Myers and Hansen2005). One existing study reports a general tendency towards smaller tense–lax quotients in younger than in older speakers of various German varieties (Bethge Reference Bethge1963), which theoretically could have been caused by internal factors because the difference was observed for speakers of different regional varieties. This diminished contrast, however, could also result from a shortening of so-called overlong tense vowels characteristic of a number of German dialects (see Bethge Reference Bethge1963: 206), i.e. from dialect leveling, since these overlong vowels are not part of the phonology of Standard German. For the following reasons we believe that the observed change is due to dialect leveling and is thus a change from the Bavarian one-contrast system (with complementary length being decisive) to the Standard German two-contrast system (where vowel and consonant length can be freely combined). In the first instance, neither production nor perception results indicate that younger Bavarians (and the younger speakers in Bethge's analysis for that matter) will give up the vowel length contrast completely. Younger Bavarians do realize the vowel length contrast but without producing a considerable duration difference in consonants. Secondly, in contrast to domain-final position, there are no compelling reasons for collapsing contrastive vowel length in word-medial position – with the exception perhaps of fast or deaccented speech (see Harrington et al. Reference Harrington, Kleber and Reubold2013). On the contrary, if other internal factors such as closed syllable vowel shortening or open syllable vowel lengthening were at work, then they should trigger an increase in Vdur/(Vdur+Closdur) ratio differences in younger Bavarians given that the tense and lax vowels in this study occurred in open vs. closed syllables, respectively. Thirdly, Bavarians are constantly exposed to the vowel length contrast in other German varieties, especially Standard German but also varieties like Saxon, where tense and lax vowels are distinguished primarily by vowel duration (Weiss Reference Weiss1976).
Our findings are in line with a general tendency for dialect leveling observed in a number of studies on German dialects (e.g. Wagener Reference Wagener2002, Lameli Reference Lameli and Gunnarsson2004) that present evidence for fewer dialect features in younger than older generations and a convergence to the supraregional variety. Most of these studies are based on auditory analyses and changes need to be perceptible in order to be captured as such. Very often – perhaps most notably in consonants – such changes are on the verge of a phonemic change. However, at several points in time during a period of change (e.g. the initiation stage), many deviations from the traditional realization may be gradual and subtle in fine phonetic detail (see e.g. Hawkins & Midgley Reference Hawkins and Midgley2005 for small but steady increases in /u/-fronting across generations) and possibly not perceptible. There is a large body of evidence showing consistent differences in speech acoustics that go unnoticed by the ear of a listener (see the literature on covert contrasts in language acquisition, e.g. Scobbie et al. Reference Scobbie, Gibbon, Hardcastle, Fletcher, Broe and Pierrehumbert2000) and eventually even lead to transcription errors (Pouplier & Hardcastle Reference Pouplier and Hardcastle2005). Research has only recently been concerned with acoustic and perceptual analyses of German dialects that are able to investigate in more detail gradual variation within speakers or within one speech modality – as is the case with the age-dependent spectral differences in /s/–/ʃ/ reported by Bukmaier et al. (Reference Bukmaier, Harrington and Kleber2014), which were not perceptible.
In order to trace the time-course of sound changes, the investigation of fine phonetic differences is absolutely essential for models that relate the reversal of mergers to near mergers (Labov Reference Labov1994) or see diachronic change as a gradual process (Ohala Reference Ohala and Jones1993, Lindblom et al. Reference Lindblom, Guion, Hura, Moon and Willerman1995). Following Lindblom's (Reference Lindblom, Hardcastle and Marchal1990) H&H theory, which predicts that speakers deliberatively choose from a continuum between hypoarticulated and hyperarticulated speech depending on the listeners’ needs, Lindblom et al. (Reference Lindblom, Guion, Hura, Moon and Willerman1995) argue that sound change occurs when a speech community selects new pronunciation forms that better match the communicative needs. Complementary timing patterns in VC sequences may aid perception (Kluender et al. Reference Kluender, Diehl and Wright1988) but speakers and listeners are able to produce and perceive more complex timing patterns, as the well separated Vdur/(Vdur+Closdur) ratios for the Standard German patterns VC, VːC, VCː, and VːCː show. In his investigation of vowel quantity in Swedish dialects, Schaeffler (Reference Schaeffler2005: 127) argued that
the additional change in consonant duration observed with complementary quantity could aid quantity perception but it is not as important as a “ratio account” of complementary quantity would suggest[;] consequently, there are no obvious or perceptual reasons for complimentary quantity[.]
Thus, following Lindblom (Reference Lindblom, Hardcastle and Marchal1990), speakers may lose a contrast, such as consonant length, when it does not serve another function such as distinguishing vowel length.
Acknowledgements
Part of this research is from the author's doctoral dissertation. The author thanks the editor Amalia Arvaniti, three anonymous reviewers, Jonathan Harrington and Mary Stevens for comments on this paper and Aysen Demir, Laura Folk, Regina Kaiser, Ann-Kathrin Killguss, Katharina Liebich, Veronika Neumeyer, Theresa Thoma, Dominique Vornwald, and Lisa Wälischmiller for recruitment and recording of subjects, data segmentation, and correction of formant-tracking errors.
Appendix. Speaker-specific response curves from the perception experiment
Psychometric curves of the proportional hacken-responses shown separately for each listener (B = Bavarian, S = Saxon, a = older, j = younger) together with the raw values shown as data points.