INTRODUCTION
Accurately and precisely estimating past populations has long been a primary goal for archaeologists (Naroll Reference Naroll1962; Hassan Reference Hassan1981; Bocquet-Appel et al. Reference Bocquet-Appel, Demars, Noire and Dobrowsky2005; Milner and Chaplin Reference Milner and Chaplin2010; Bintliff and Sbonias Reference Bintliff and Sbonias2016). While the impetuses for estimating past populations have varied over time, we recognize that population density is a significant variable in the development and transformations of societies. Accurate population estimates help us more fully understand the dynamic relationships that exist between people and their environments (Bandy Reference Bandy2004; Warrick Reference Warrick2008; Milner et al. Reference Milner, Chaplin and Zavodny2013; Shennan et al. Reference Shennan, Downey, Timpson, Edinborough, Colledge, Kerig, Manning and Thomas2013; Liebmann et al. Reference Liebmann, Farella, Roos, Stack, Martini and Swetnam2016).
Numerous middle-range theoretical and methodological approaches have been applied in the pursuit of accurate, useful population estimates. At the broadest scale, population sizes can be estimated based on the carrying capacity of the environment, if information about environmental conditions and subsistence practices and technologies is available. At more specific scales, Warrick (Reference Warrick2008) and others (e.g., Hassan Reference Hassan1981) have argued that settlement data of various kinds are best for estimating populations. Radiocarbon (14C) dates as data have also been used, at various scales, as yet another proxy for measuring ancient populations (Rick Reference Rick1987; Peros et al. Reference Peros, Munoz, Gajewski and Viau2010; Steele Reference Steele2010; Bamforth and Grund Reference Bamforth and Grund2012; Timpson et al. Reference Timpson, Colledge, Crema, Edinborough, Kerig, Manning, Thomas and Shennan2014).
Each of these approaches have their own strengths and weaknesses. For example, both total settlement area and household-level estimates can be used to model population size (Warrick Reference Warrick2008; Brannan and Birch Reference Brannan, Birch, Kellett and Jones2017), yet settlement-area methods produce less accurate estimates than methods based on intra-settlement data. Settlement area-based estimates are synchronic in nature and estimates derived from occupational area are therefore, at best, a reflection of the sum of occupation and therefore represent the maximum sum of population for a given period. The problem of contemporaneity in archaeology is a perennial one (Schacht Reference Schacht1984; Cameron Reference Cameron1990; Dewar Reference Dewar1991; Grove Reference Grove, Ruebens, Romanowska and Bynoe2012). Without temporal control, occupation area derived estimates have little to add to understandings of the relationship between population dynamics and social change.
Intra-settlement area-based estimates are more reliable in this respect, but in regions lacking standing architecture, estimates of total roofed area can be difficult, or impossible, to produce. Remote sensing methods have proven to be a cost- and labor-effective means to create data that can produce these sorts of estimates (e.g., Davis et al. Reference Davis, Walker and Blitz2015), but access, training, and implementation remains limited to specialists, albeit a growing number of them.
In terms of large-scale data in the United States, individual state site files are often the best source of settlement data available. However, state site files are more likely to include information on total settlement area, rather than areas of occupation for individual components, let alone estimates of roofed area. Often even that information may not be available. For example, in the state of Georgia’s archaeological site file, only slightly more than half of all entries have any areal data.
Other approaches model population levels based on the relationship between populations and the accumulation of material refuse (Hassan Reference Hassan1981). Estimates of population size made from material accumulations rely on ethnographic analogies of production and discard along with archaeological data derived from systematic or complete excavation strategies (Sullivan Reference Sullivan2008; Arthur Reference Arthur2009). These methods can result in more temporally situated estimates of occupation, based on the temporal control that is available for the materials in question. These estimates, with their potentially higher temporal resolution, are more easily applied to understanding relationships between population changes and social transformations than the maximal population estimates derived from occupation areas. However, these kinds of estimates rely on accurate control of variables that may not be able to be directly informed by the archaeological record. The accuracy of accumulations-based approaches is directly related to the degree of fit between the practices that created the archaeological record of a site and the ethnographic analogies used to estimate rates of material deposition.
The primary means by which 14C data has been applied to demographic analysis has been through the creation and analysis of summed probability plots. This approach has been used on regional, or even continental scales, to identify patterns of growth and decline that proponents argue reflect either demographic or occupational trends depending on the scale of the data (Rick Reference Rick1987; Shennan and Edinborough Reference Shennan and Edinborough2007; Smith et al. Reference Smith, Williams, Turney and Cupper2008; Thomas Reference Thomas2008a, Reference Thomas2008b, Reference Thomas2008c; Peros et al. Reference Peros, Munoz, Gajewski and Viau2010; Steele Reference Steele2010; Bamforth and Grund Reference Bamforth and Grund2012; Armit et al. Reference Armit, Swindles and Becker2013; Timpson et al. Reference Timpson, Colledge, Crema, Edinborough, Kerig, Manning, Thomas and Shennan2014). Although trends evident in summed probability distributions likely reflect human activity, there are reasons to be cautious in interpreting these products. Numerous investigators have noted issues in inferring population dynamics from summed 14C distributions due to the difficulties in accounting for biases in taphonomy, sample selection, and human behavior (Surovell and Brantingham Reference Surovell and Brantingham2007; Surovell et al. Reference Surovell, Finley, Smith, Brantingham and Kelly2009; Williams Reference Williams2012; Contreras and Meadows Reference Contreras and Meadows2014; Brown Reference Brown2015).
In this article, I present complementary methods for the estimation of site-level populations using a combination of data that is commonly available to archaeologists, namely 14C data and systematically collected intra-site survey data. These data are often available even when estimates of house-floor occupation area or other commonly used proxies for past populations are absent or unattainable. I briefly highlight some issues that arise when using these kinds of data and provide potential solutions. I argue that adopting an explicitly multi-method approach can produce ranges of estimates that, when evaluated together can more accurately reveal demographic trends. In this paper, I calculate population estimates using two methods: 1) occupation area, and 2) ceramic accumulations within 14C defined occupation spans. Distinct periods of occupation and abandonment were identified from the 14C sample and applied to period-level population estimates to model the demographic history of the Kenan Field site and relate it to the regional record of change in settlement and economy on the Georgia Coast.
STUDY SITE AND REGIONAL SETTING
The coast of Georgia comprises a series of islands along the southern Atlantic Coast of the modern United States known as the Georgia Bight, which extends from Cape Fear, North Carolina to Cape Canaveral, Florida. The Georgia Bight has been the subject of professional archaeological inquiry since the late 19th century (i.e., Moore Reference Moore1897). The region exhibits large and spatially complex sites, with the most broadly known of these being shell ring villages (Thompson and Andrus Reference Thompson and Andrus2011; Thompson and Worth Reference Thompson and Worth2011). Research on the formation, transformation, and constitution of communities on the Georgia Bight has revealed the importance of recognizing the dynamic, entangled relationships between peoples, their histories, and their environments (Larsen Reference Larsen1990; Thomas Reference Thomas2008a, Reference Thomas2008b, Reference Thomas2008c.; Thompson and Turck Reference Thompson and Turck2010; Thompson and Andrus Reference Thompson and Andrus2011; Thompson and Worth Reference Thompson and Worth2011; Andrus and Thompson Reference Andrus and Thompson2012; DePratter and Thompson Reference DePratter, Thompson, Thompson and Thomas2013; Napolitano Reference Napolitano, Thompson and Thomas2013; Sanger Reference Sanger, Thompson and Thomas2013; Thompson and Andrus Reference Thompson and Andrus2013; Thompson et al. Reference Thompson, Turck, DePratter, Thompson and Waggoner2013; Turck and Alexander Reference Turck, Alexander, Thompson and Thomas2013; Turck and Thompson Reference Turck and Thompson2016; Sanger and Ogden Reference Sanger and Ogden2018). Over the past several decades, these programs of study have resulted in a wealth of excavation data that in turn has supported the creation of both implicit and explicit models of sociopolitical organization in the region (Pearson Reference Pearson1977, Reference Pearson and Smith1978; Pluckhahn and McKivergan Reference Pluckhahn and McKivergan2002; Thomas Reference Thomas2008a, Reference Thomas2008b, Reference Thomas2008c; Thompson and Worth Reference Thompson and Worth2011). While regional and island surveys have done much to improve our models of spatial distributions of populations throughout the region during these centuries, we lack high resolution demographic reconstructions which could significantly add to discussions on the nature of coupled socio-ecological systems and the maintenance, and ultimate subversion, of egalitarian relations.
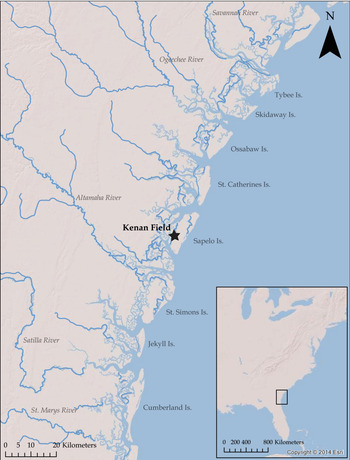
Kenan Field (9MC67), on Sapelo Island, GA (Figure 1), is a 60-ha, multicomponent site that has been occupied recurrently since approximately 4500 BPFootnote 1 . The site occupies the entirety of a rectangular promontory, abutted on three sides by tidal waterways. The site exhibits two low earthen mounds, 591 surface shell middens, and sub-surface deposits (Crook Reference Crook1978, Reference Crook and Juengst1980a, Reference Crook and Juengst1980b, Reference Crook1986). The site is not deeply stratified and has been impacted by historic agricultural plowing. The archaeological record that remains is a palimpsest (sensu Bailey Reference Bailey2007) that complicates attempts to untangle the site’s history of American Indian occupation.
Map showing the location of the Kenan Field site on the Atlantic Coast of Georgia, USA.

METHODS
Areal and Accumulations Based Population Estimates
I employ both areal- and accumulations-based methods to estimate changing populations at Kenan Field over time. Modeling populations based on occupation area requires an estimate of expected population density. Brannan and Birch (Reference Brannan, Birch, Kellett and Jones2017) estimated populations at the Singer-Moye site in the Chattahoochee River valley of southwestern Georgia from systematically collected excavation data by deriving settlement density estimates from high-resolution magnetometer surveys of the comparable sites of Moundville, Alabama (Davis et al. Reference Davis, Walker and Blitz2015) and Etowah, Georgia (Walker Reference Walker2009). From those surveys, Brannan and Birch (Reference Brannan, Birch, Kellett and Jones2017) calculated the average roofed area (e.g., m2) of probable domestic structures for a sample of several surveyed hectares at both Moundville and Etowah. They then used Casselberry’s (Reference Casselberry1974) ethnographic model of 6 m2 of roofed area per person to calculate population estimates. To avoid overestimating their population thresholds, Brannan and Birch (Reference Brannan, Birch, Kellett and Jones2017) calculated both a high- and a low-density population estimate per hectare at each site (i.e., 52.7 people per ha for low density areas and 98.7 people per hectare for high density areas). The high-density population estimate for each site was based on the average population estimates for all tested hectares and the low-density figure was based on the hectare from each site that exhibited the lowest population density. These estimates were then applied to the shovel-test survey data from Singer-Moye to estimate phase-level populations. Thiessen polygons derived from excavation locations were classified as high or low density based on the recovered numbers of ceramic sherds and these polygons were then used to calculate site-wide population estimates (Brannan and Birch Reference Brannan, Birch, Kellett and Jones2017: 67).
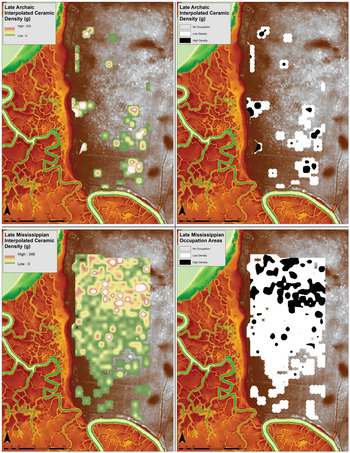
To apply these density estimates to Kenan Field, I calculated occupational area for each component from Natural Neighbor interpolated density surfaces for each ceramic period based on the results of an intensive shovel-test survey (Table 1; Figure 2; Ritchison Reference Ritchison2019). Briefly, 911 shovel tests on a 20-m grid, each measuring 50 × 50 cm, were excavated until culturally sterile strata were encountered. Recovered ceramics were identified and classified based on the typological sequence accepted for the study region (DePratter Reference DePratter1991; see also Williams and Thompson Reference Williams and Thompson1999). Each cell of the interpolated density surfaces was classified as either high-density or low-density based on whether the interpolated value of the cell was above or below the mean weight (i.e., M = 14.7 g) of the most ubiquitous identified ceramic category (i.e., Savannah/Irene types) to standardize the method across all periods. Areas without interpolated ceramic density values were classified as non-habitation zones.
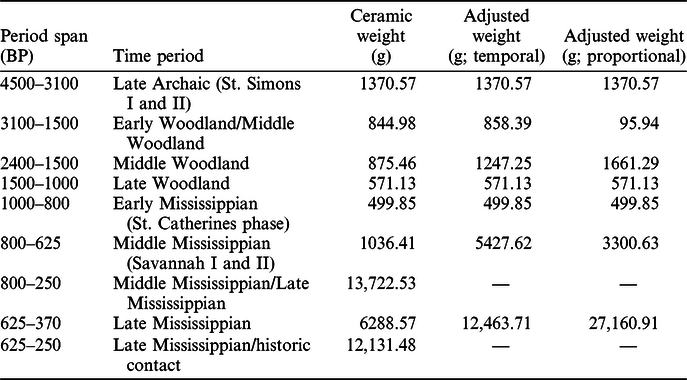
Ceramic weights per period from the shovel test survey with the results the two described reapportionment schemes.

Example of occupation area calculation methods highlighting Late Archaic and Late Mississippian periods.

The other method I used was based on the model provided by Varien and Mills (Reference Varien and Mills1997), where known rates of ceramic accumulations and population estimates were used to calculate the duration of occupation at the Duckfoot site. However, this method can also be used to calculate the size of populations when total ceramic accumulation and occupation span are known.
Estimating total ceramic accumulation for the entire site is possible due to the systematic nature of the shovel-test survey conducted at the site. However, the ceramic sequence of the Georgia Coast as currently understood poses difficulties in deriving estimates of accumulation from the survey data, especially in the more recent occupations. Excavated ceramics were often placed into “hybrid” categories during analysis due to the high degree of similarity evident in the three Middle and Late Mississippian period phases, Savannah, Irene, and Altamaha. All three ceramic types exhibit grit-tempering (i.e., medium to large quartz sand inclusions in the paste). Although each ceramic type has distinct surface decorations (e.g., Savannah complicated curvilinear stamping and check-stamping, Irene filfot cross complicated stamping motifs, and Altamaha line-block stamping motifs [see DePratter Reference DePratter1991 and Williams and Thompson Reference Williams and Thompson1999]), the assemblage analyzed here contained predominantly small, fragmentary body sherds. Consequently, sherds often fit the criteria of more than one type.
I used two methods to reapportion the weights of “hybrid” ceramics into the distinct phases used in the analysis. The first method was temporal (Table 1). The duration of each period, as defined by DePratter (Reference DePratter1991), was used to, for example, assign Savannah/Irene ceramic weights to the Savannah and Irene periods separately. Ceramics were thereby reassigned from their hybrid categories into distinct ceramic periods. According to DePratter (Reference DePratter1991), the Savannah period lasted from 825–625 BP (i.e., 200 years) and the Irene period from 625–370 BP (i.e., 255 years). Based on this, 44% of weight of Savannah/Irene ceramics were added to the total weight of Savannah ceramics and 56% was added to the total weight of Irene ceramics.
The second method of reapportionment was based on applying the evident proportion of Savannah to Irene to Altamaha ceramics, e.g., using this approach, 83.5% of the total Savannah/Irene ceramic weight was assigned to the Irene period (Table 2). I used both sets of these adjusted ceramic weights to estimate population size and both sets of estimates are provided in the results.
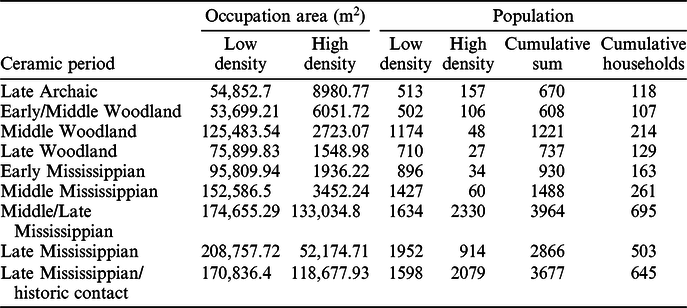
Population estimates derived from the occupational areas per period based on shovel-test survey results.

Once hybrid types were reapportioned, an average ceramic weight per cubic meter excavated was used to extrapolate an estimate of total ceramic refuse at the site. Following Varien and Mills (Reference Varien and Mills1997), this value was reduced to 57.5% of the total to estimate the proportion of cooking-pot sherds relative to sherds from other vessel types, given a lack of a comparable estimate of proportionality of use-cases for ceramic assemblages from the study region. This value was then divided by the duration of occupation derived from the 14C data described below and two estimates of yearly household ceramic accumulation as provided by Varien and Mills (Reference Varien and Mills1997) derived from estimates of the duration of household lifespan (i.e., 20 or 25 years of 266.15 g of consumed cooking ware per year at the Duckfoot site). The duration of site occupations was estimated from the sample of 14C dates discussed below. This resulted in a range of values representing the average number of households active per year during each period. This process is represented by the formula,
 $$H{h_Y} = {\rm{ }}{{\left( {{{\left( {{{{C_E}} \over {{E_V}}}x\,{T_V}} \right)x{P_{CV}}} \over t}} \right)} \over {H{h_{CV}}}}$$
where Hh Y = the average number of occupied households (estimated to represent 5.7 individualsFootnote 2 ) per year, Hh CV = the yearly household cooking vessel consumption (g), t = the temporal span of occupation period (here based on median and maximum modeled site occupation spans), C E = the total amount of excavated ceramics per period (g), E v = the total excavated sample volume (m3), T v = the estimated volume comprising all archaeological materials at the site (m3), and P CV = the percent of the assemblage comprising cooking vessels.
14C Dating
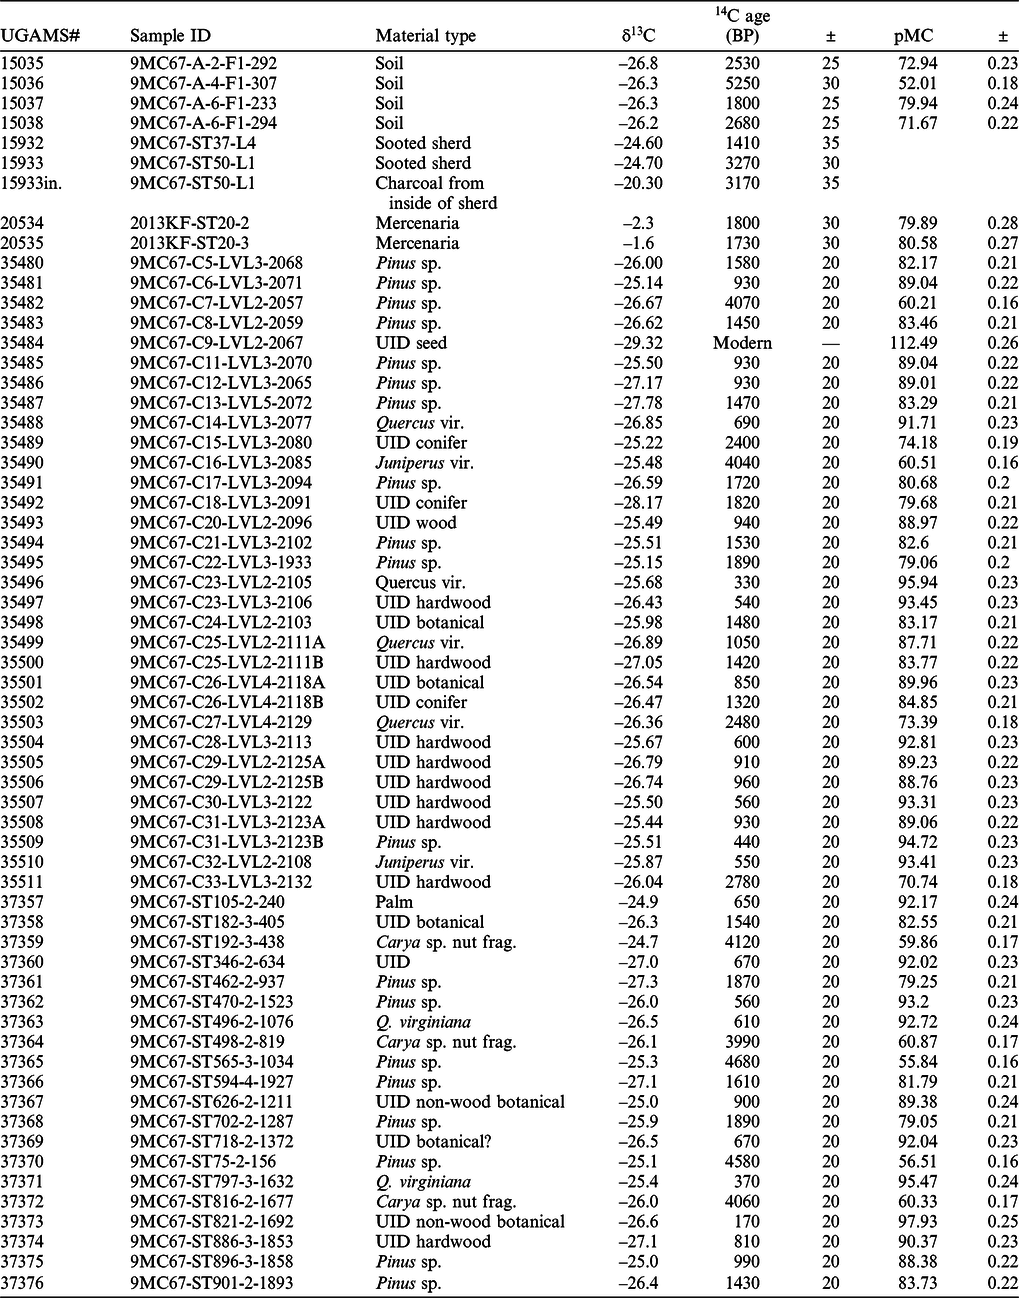
The 14C dating program for Kenan Field was conducted to provide a chronological framework for evaluating changes in physical community organization. In total, 61 14C dates were run (Ritchison Reference Ritchison2019). Of these dates, only a single modern signature was returned. Samples for these assays were collected in three phases. The first phase includes the dates from samples collected during the initial 2013 field season. These samples were exploratory in nature, and targeted specific features and artifacts (e.g., a Late Archaic midden, Late Archaic ceramics, and a feature with as-of-then unknown provenience).
The second phase of dating included samples from materials collected during the excavation of 33 units (Ritchison Reference Ritchison2019). Briefly, these test excavations were 50 × 50-cm excavations conducted in arbitrary 20-cm levels into a sample of the over 500 surface shell midden piles found across Kenan Field. These features have generally been associated with Savannah and Irene period components in the study region (Pearson Reference Pearson1977; Crook Reference Crook1978, Reference Crook1986; Thompson and Worth Reference Thompson and Worth2011; Pearson Reference Pearson2014). Each of the Operation C tests was placed to excavate a shell midden visible on the surface. Samples from the excavation of these features were retained from the base of undisturbed shell deposits, either from the floor or profiles; charred botanical remains were preferred. Given the character of these dense shell features, it is improbable that these recovered charred materials were non-anthropogenic. This sampling strategy was intended to target the terminus post quem of these shell features, such that, if the charred materials recovered were not the product of direct human action, they would still generally reflect temporal patterns of human activity at the site.
Following excavation and testing of the Operation C samples, samples collected during an earlier shovel-test survey were used to date encountered features determined to represent secure contexts. Selection criteria from the survey tests required that samples were from intact, sub-plow zone contexts, within or below dense shell deposits. Dates are reported in Table 3. A Kernel Density Estimate model (Bronk Ramsey Reference Bronk Ramsey2017) of these dates (excluding one abnormally early date and one modern return) was evaluated to determine the primary periods of site occupation to a more precise degree than the regional ceramic sequence allowed. Given the total span of these dates, it is unlikely that occupation at Kenan Field was continuous, even with every major ceramic chronological period represented in the excavated assemblage. While 59 dates are not enough to positively rule out possible occupations during the “gaps” observed in the KDE model, the variety of contexts that were dated should represent, at least, the more intensive occupations at Kenan Field. The estimates that follow can be adjusted as additional dates become available.
Radiocarbon dates from Kenan Field (9MC67).

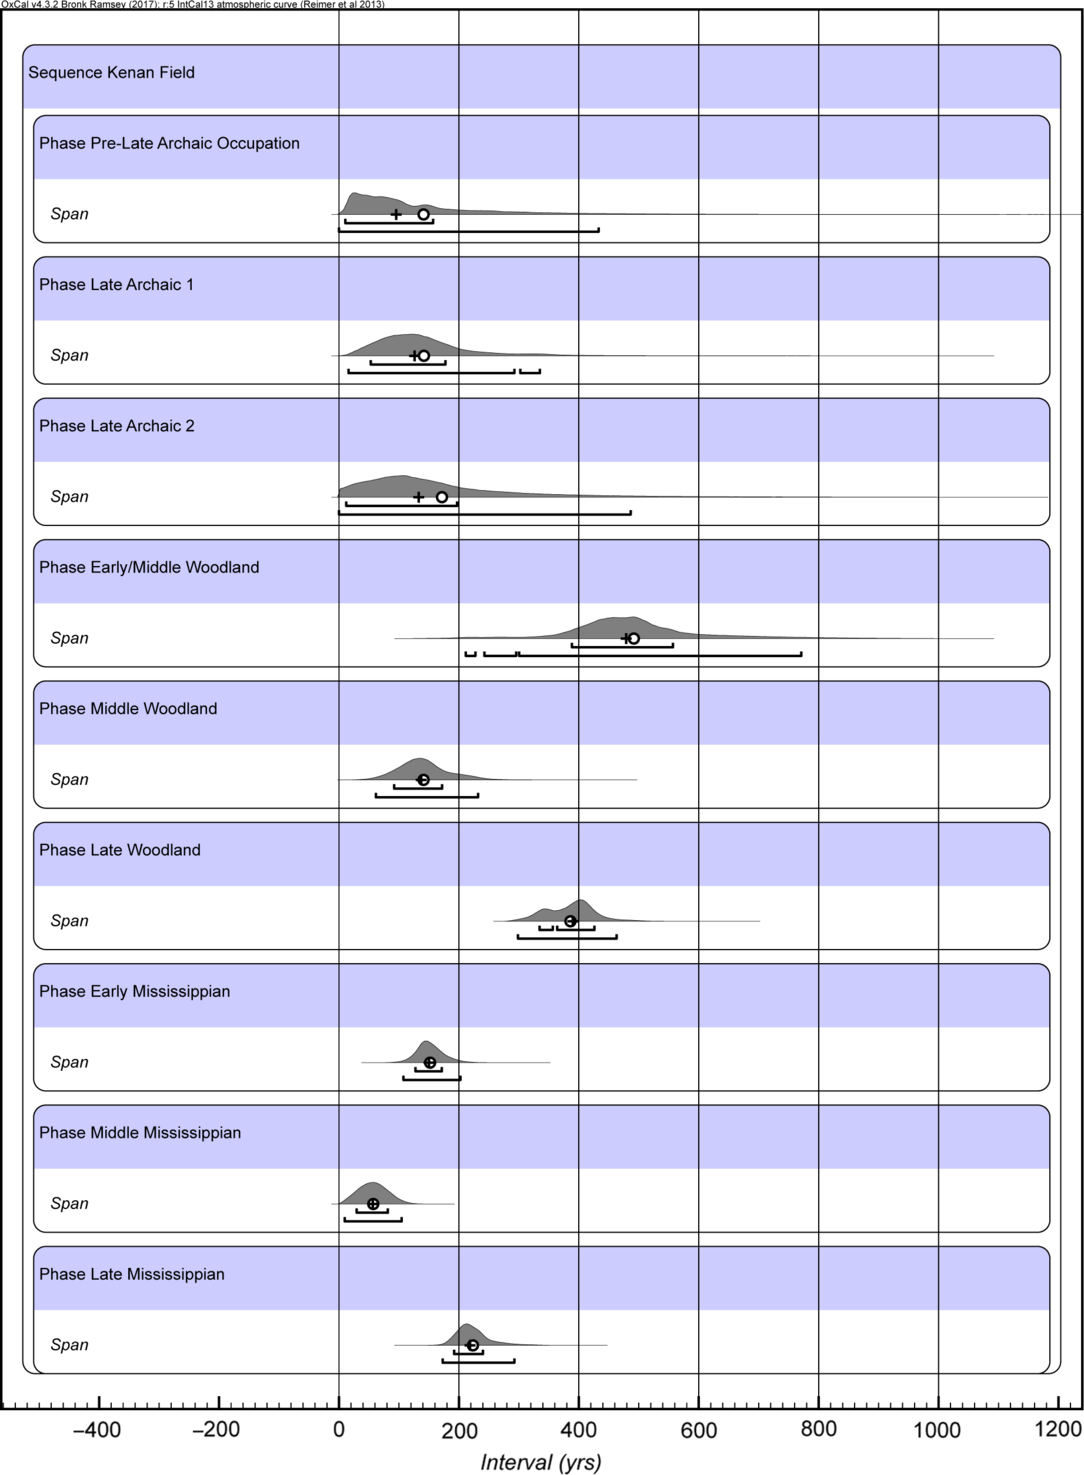
The dates within each high-probability cluster were then modeled as sequential Phases in OxCal 4.3 (Bronk Ramsey Reference Bronk Ramsey2009) and were calibrated with IntCal13 (Reimer et al. Reference Reimer, Bard, Bayliss, Beck, Blackwell, Bronk Ramsey, Buck, Cheng, Edwards, Friedrich, Grootes and Guilderson2013) to determine likely start and end dates, as well as an estimated span of occupation periods (Figure 3; see Supplemental Materials 1 for code and Supplemental Table 1 for modeled results). Dates on marine shell were corrected for the local marine reservoir effect following Thomas et al. (Reference Thomas, Sanger, Royce, Thompson and Thomas2013). Boundaries were placed in the model where gaps were visually evident in the KDE Model. The median and maximal values for the spans (at the 95% confidence interval) calculated by this Phase model were used in the population density estimates, but not in the temporal ceramic reapportionment process described previously, because it is impossible to reapportion the spatial distributions of these materials as was done for the assemblages as described previously.
Graphical depiction of the modeled spans of periods of occupation at the Kenan Field site with mean (circle), median (cross), and 1-sigma and 2-sigma confidence intervals illustrated.

RESULTS
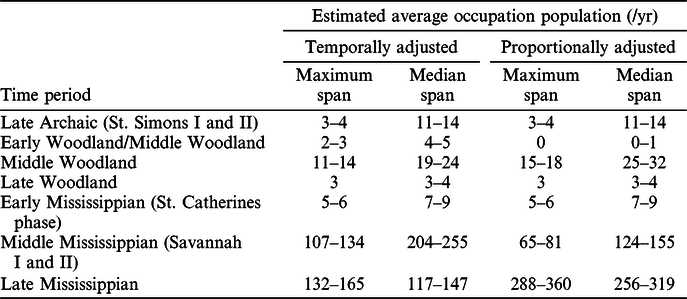
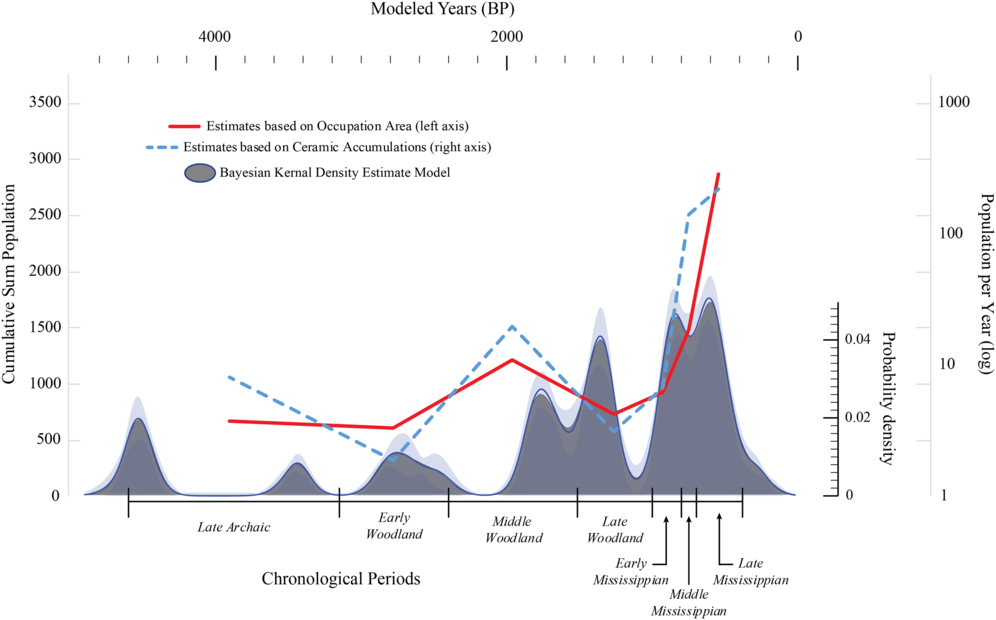
I employed two methods to estimate populations at Kenan Field. The results of the calculations are presented in Table 2 and Table 4. Based on the areal extent of occupation, the trends observed in the population estimates mirror those observed above in the distributional analysis (Ritchison Reference Ritchison2019). Activity at Kenan Field generally increased over time, with a significant increase in population during the period from the Late Archaic period to the Middle/Late Mississippian period (Table 3). The areal extent method is limited in both resolution and accuracy but suggests a maximum accumulated population of nearly 4000 people during the Savannah and Irene periods (Table 2).
Population estimates derived from ceramic accumulations and modeled occupational spans for each of the two methods of ceramic weight reapportionment.

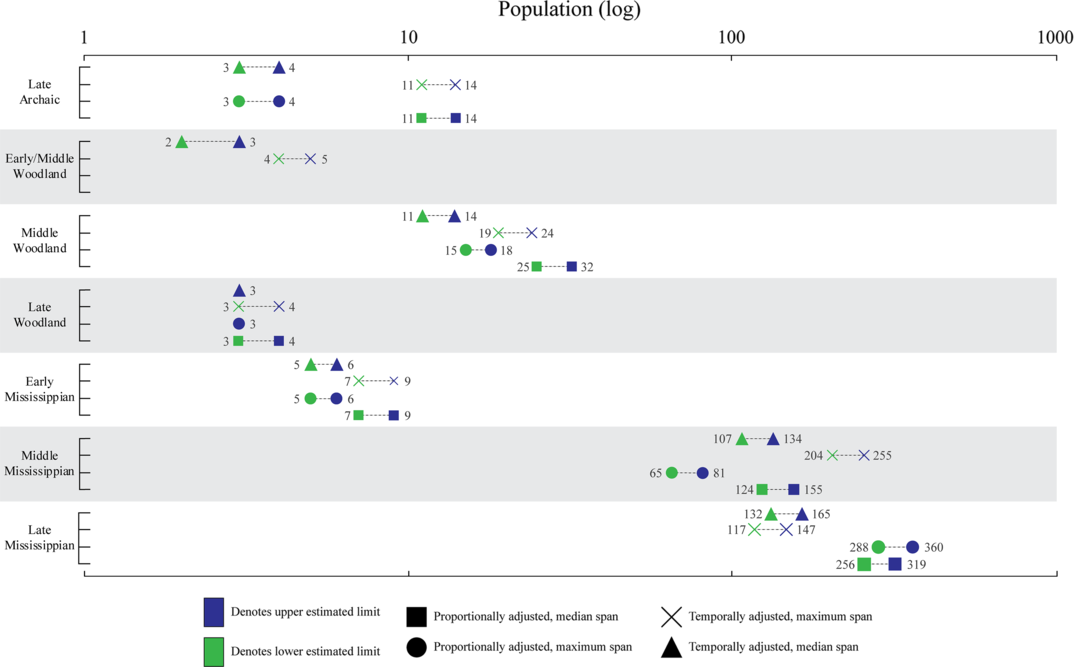
The second method was based on total ceramic accumulation. The results of this method are presented in Tables 2 and 3 (see also Figure 4 for a comparison of the various permutations of the accumulations-based estimates). The same trends are apparent, but the estimates instead represent the size of average, contemporaneous populations and are therefore much lower values per period. Average contemporaneous populations at the site ranged from a low of 2 to 3 people up to 360. There is a significant range in the number of households potentially occupying the site during the Late Mississippian Irene period based on the two reapportionment methods (i.e., ranging between 132 and 165 people when accumulations calculations were based on the temporal reapportionment and between 288 and 360 for the proportional reapportionment). Although this method suggests a possible range of population increases at the site from the Middle to Late Mississippian periods (i.e., from a minimum 100% increase to over 1000%), even the minimum possible increase was substantial.
Ceramic accumulation-based population estimates per period. Green symbols represent minimum estimated values (25-yr household use-life). Blue symbols represent maximum estimated values (20-yr household use-life). Single points represent situations where minimum and maximum population estimates are identical. Average estimated contemporaneous populations of less than one are not visualized. (Please see electronic version for color figures.)

DISCUSSION
The two methods described above are not directly comparable, as the occupation area-based method ignores issues of contemporaneity, and are best understood as relative, but both can be used to understand demographic trends over time. In this respect, both methods reveal similar patterns of growth in populations over time. Kenan Field was a dynamic, central-place settlement over the course of its history, and likely gained a heightened importance (and population) during the Middle and Late Mississippian periods. This growth was likely related to a region-wide population increase and reorganization following the abandonment of the nearby Savannah River Valley (Anderson Reference Anderson1994; Anderson et al. Reference Anderson, Stahle and Cleaveland1995; Ritchison Reference Ritchison2018b, Reference Ritchison2019). The combination of systematic shovel test data and 14C data reported here creates a model of population change, for at least one site, that is more sensitive to the specifics of the archaeological record than has previously existed for the region.
Three periods of occupation/abandonment are of note at Kenan Field. First, Late Archaic (ca. 4500–3100 BP) occupations at the site occur only before and after the shell-ring phenomena (Thompson and Worth Reference Thompson and Worth2011), suggesting that shell-ring occupations represent a distinct settlement strategy where specific points on the landscape were subjected to concentrated use to the exclusion of previously used locations. Population estimates suggest that occupations at Kenan Field during this period occurred intermittently, although exact lengths of individual periods of occupation cannot be determined from the available data. Second, abandonment of the site during the latter portion of the Wilmington period (ca. 1500–1000 BP) coincides with the initial development of ranking in the region (Thomas Reference Thomas2008c) and adoption of a new ceramic type (Ritchison Reference Ritchison2018a). Finally, occupational density dramatically increased from the Savannah period (ca. 800–625 BP) to the Irene period (ca. 625–370 BP), with no break in the occupational sequence. This increase in density is likely related to the large-scale immigration event that occurred post-AD 1350 (Ritchison Reference Ritchison2018b) and drove the development of new community practices (Ritchison Reference Ritchison2019).
Thomas (Reference Thomas2008b) pooled the probabilities of 116 14C dates to investigate long-term patterns of activity on St. Catherines Island. The St. Catherines Island pooled probability curve shows a long-term pattern of increasing levels of human activity, with the greatest growth occurring during the Irene period. A KDE model of the 59 Kenan Field dates associated with pre-Euro-American human activity follow the same general pattern observed in the island-wide sample from St. Catherines (Figure 5). Further, the Kenan Field KDE model appears to correlate with results of the population estimation methods applied here. The similarity between these 14C datasets demonstrates that increased activity in the Irene period was a region-wide pattern and that this increase in activity, in combination with growth in the number of sites, likely reflects an increasing population. This also suggests that other trends observed in the St. Catherines data, such as gaps at the start of the Middle Woodland period and at the end of the Late Woodland period, reflect regional patterns. Modeling of occupational periods at Kenan Field demonstrates the likelihood that major sites were abandoned during periods of lower populations and human activity on the coast. The similarity in patterns here may also lend additional credence to the use of the expansive St. Catherines Island dataset created by the American Museum of Natural History to generalize about the broader region. Given the dominant position that St. Catherines Island research has held in the archaeological literature of the region, this is a welcome finding.
Results of the two population estimation approaches overlaid on the KDE model of dates from Kenan Field. Note that the right axis is on a log scale to effectively portray the order of magnitude increase in estimated population at site during the Middle and Late Mississippian periods. Further, the illustrated population curve based on the ceramic accumulations-based calculations represents an average value across all permutations (i.e., temporal vs. proportional ceramic reapportionment and 20- vs. 25-year household occupations).

Specifically, the methods I used provide an estimated sum, or average, number of people creating ceramic refuse at the study site across a defined span of time. Decades of research on the southeastern coasts of the United States have demonstrated that populations were largely sedentary across the time span in question, but the possibility of seasonal population fluctuations at the site level cannot be ignored (Thomas Reference Thomas2008a; Thompson and Andrus Reference Thompson and Andrus2011; Colaninno and Compton Reference Colaninno and Compton2019; Sanger et al. Reference Sanger, Quitmyer, Colaninno, Cannarozzi and Ruhl2019). However, the methods applied here would not be sensitive to seasonal population fluctuations at the site.
Overall, these population estimates are conservative. For example, the focus on the use of temporally diagnostic sherds certainly underestimates total ceramic accumulation for each period as several non-diagnostic types were probably in use across many of the temporal boundaries employed here. This is why I did not employ the results of the Bayesian chronological model in the reapportionment process. Dates used in the model were frequently not associated with ceramics and, as such, the dates reported here are taken to reflect general occupation and use of the site and not the specific use of any given type of ceramic. Similarly, the low estimates of fewer than 2–3 households per year in the earliest periods of occupation should be understood as reflecting intermittent occupations within each phase of identified site use that cannot be clearly differentiated at this time. Although neither of the methods employed provides more than a rough proxy of population change at Kenan Field, these methods can together provide a more complete picture of population dynamics at Kenan Field than either method alone.
It should also be understood that there are limitations based on the temporal framework used in this study. DePratter’s (Reference DePratter1991) ceramic chronology has been revised (Thomas Reference Thomas2008b) and reevaluated (Ritchison Reference Ritchison2018a). There is consequently an increasing recognition that the temporal ebb and flow of ceramic production needs further investigation. However, Thomas’s (Reference Thomas2008b) revised chronology remains similar to DePratter’s (Reference DePratter1991), with the notable change of concatenating the Early Mississippian St. Catherines period and the Middle Mississippian Savannah period due to the nature of recovered ceramic assemblages on St. Catherines island, specifically. My own reevaluation of DePratter’s (Reference DePratter1991) chronology demonstrated that while there are reasons to more closely interrogate the timing and span of production for several ceramic types (e.g., primarily types attributed to the Woodland and Early Mississippian periods), the general structure of the chronology is sound (Ritchison Reference Ritchison2018a). The use of legacy 14C dates in this reevaluation was sufficient to highlight potential areas of future inquiry, but not to argue for changes to the region’s currently accepted chronological sequence. In this paper, I opted to use DePratter’s (Reference DePratter1991) chronology to facilitate intra-regional comparisons.
These methods, as applied here, are inherently limited in several ways relating to the underlying data. Both methods are built upon the abstraction of the same survey results. Varien and Mills’ (Reference Varien and Mills1997) calculations for the relationship between population and ceramic accumulation are based on a specific cultural context. How these variables relate to one another on the Georgia Coast, as well as through time, needs to be better understood if these estimates are to be made more accurate. I have assumed in my estimated population model that a specific number of people produced and discarded, in situ, a certain amount of ceramics, and that this ratio did not change over time. This is almost certainly not the case, on the Georgia Coast or elsewhere, because ceramics are produced and consumed in culturally mediated ways that are constantly in flux due to changes in technology, social organization, and socio-ecological systems. Continued investigations of intra-settlement organization, primarily in terms of household-level contexts that are currently lacking for the Georgia Coast (see Keene and Garrison Reference Keene, Garrison, Thompson and Thomas2013), may eventually allow for regionally specific variables relating to ceramic production and consumption to be applied in these population estimations.
Even with the above limitations noted, this study has broader implications for understanding demographic change via the archaeological record. Systematically collected ceramic datasets are a common product of archaeological research, as are more accurate chronologies as a result of the ongoing “Third Radiocarbon Revolution” (Bayliss Reference Bayliss2009; Wood Reference Wood2015). Population estimates have always been contentious and varied based on region, method, scale, and available data (Hassan Reference Hassan1981; Milner Reference Milner1986; Warrick Reference Warrick2008; Milner and Chaplan Reference Milner and Chaplin2010; Jones and DeWitte Reference Jones and DeWitte2012), but with ever improving chronological frameworks, continued efforts to estimate ancient demographic patterns should accompany the creation of new, or improvement of extant, regional and site-level chronologies. Better population estimates will lead to more complete understandings of complex socio-ecological relationships.
The systematic nature of the shovel test survey conducted at Kenan Field allowed for simple estimation of the total accumulation of ceramics for any period. However, the broad temporal span and overlap evident in any ceramic chronology reduces the accuracy of any population estimates. Additionally, due to reoccupation and reuse of the site over the past 4000 years, shell features found across the site are not always clearly attributable to specific periods of occupation. Given the frequency at which sub-plow zone shell deposits which did not include diagnostic ceramics were encountered during the shovel test survey, the intensity of human activity during the pre-Mississippian occupations at this site, and importantly throughout the region at other large multi-component sites, are likely under-represented.
CONCLUSION
Populations at Kenan Field have generally increased over time, with the population estimates and 14C data suggesting that the rate of growth varied over time. The 14C data further identifies spans during which the site went unused. Similar trends over time are apparent in each of the population estimation methods. Namely, populations increased by an order of magnitude during the Mississippian period, particularly during the Late Mississippian Irene phase.
Knowledge is generated from the archaeological record based on nested middle-range theoretical assumptions. Regional typological sequences (often based on seriations at just one or a few sites) are frequently the bedrock of our scaffolded interpretations regarding change over time, even when absolute dating methods are standard practice. Bayesian methods have increasingly allowed archaeologists to interrogate processes of change at ever-finer temporal resolutions and have called into question the accuracy of our often-reified chronological sequences. Even with Bayesian chronological methods providing a way to distance our interpretations of the past from the seriated chronologies created decades ago, we have not widely leveraged these methods beyond the creation of new chronological frameworks. We should consider how our constructed chronologies underlie nearly every other “downstream” interpretation and should purposefully attempt to test our chronological assumptions while pushing the boundaries of what is knowable about the past.
Here, I have applied Bayesian modeling to increase the interpretive potential of a data set from a site that can be described as a shallow archaeological palimpsest. This sort of record has confounded certain types of interpretation (such as demographic reconstructions) due to a lack of control over material contexts and associations. This is not at all an unusual problem at sites that exhibit long, complicated histories of human activity. To address this problem, the methods outlined here provide a means by which we can productively use what archaeologists already typically have in our “toolkits”, systematically collected material from survey and site-level 14C dating. Critically approaching established culture-historical sequences with both new data and old data re-evaluated with new methods and in new frameworks can provide deeper, more historical perspectives on major cultural transformations.
ACKNOWLEDGMENTS
This research was supported in part by the National Science Foundation DDRI Grant #1643072. Additional support was provided by the National Science Georgia Coastal Ecosystems LTER. Excavation was supported by innumerable volunteers and multiple field schools from the University of Georgia, the University of South Florida, the University of Kentucky, and the University of Indianapolis. I would like to thank the guest editor of this issue and five anonymous reviewers for their helpful and productive comments. Thanks also go to the UGA Laboratory of Archaeology, the Center for Applied Isotope Studies, and the Georgia Department of Natural Resources, Historic Preservation Division, and the DNR staff of Sapelo Island, GA and the R.J. Reynolds Wildlife Management Division. Special thanks to Jennifer Birch and Stefan Brannan for pushing me to speak about populations with numbers, and not only in generalities.
SUPPLEMENTARY MATERIAL
To view supplementary material for this article, please visit https://doi.org/10.1017/RDC.2020.107.