Implications
Out-wintering pads (OWPs) are a low-cost system for managing cows off pasture during the winter. However, to be economically viable, post-partum performance for cows on OWPs must not be compromised. Cows on unsheltered OWPs had lower body condition scores pre partum, produced less heat and lost more heat to the environment than cows in cubicle housing or on a sheltered OWP. However, all cows gained condition, and post-partum live weight and milk yields were not negatively affected in unsheltered cows. Thus, OWPs do not appear to compromise productive performance immediately post partum.
Introduction
Dairy farming in Ireland is primarily based on a spring calving, pasture-based system. In Irish dairying systems, grazed grass has a lower cost than alternative feeds (Shalloo et al., Reference Shalloo, Dillon, O’Loughlin, Rath and Wallace2004), and a spring calving system allows the amount of grazed grass in the diet of the cow to be maximised while lactating (Dillon et al., Reference Dillon, Roche, Shalloo and Horan2005). However, during the winter, cows are usually kept off pasture for animal welfare reasons, limitations in the grass supply and to avoid the negative effects of adverse weather conditions on the soil, which could cause poaching (this occurs when the hooves of grazing animals penetrate the soil surface, which causes progressive loss of soil structure (Mulholland and Fullen, Reference Mulholland and Fullen1991). Currently, dairy herd sizes in Ireland are increasing for economic reasons (Donnellan et al., Reference Donnellan, Dillon, Shalloo, Hennessy and Breen2002). This necessitates the concurrent expansion of winter confinement facilities. A low-cost alternative to cubicle (free-stall) accommodation, which is the most common dairy cow confinement system in Ireland (Egan et al., Reference Egan, Leonard, Griffin, Hanlon and Poole2001), are out-wintering pads (OWPs) (Regan et al., Reference Regan, Maher and Ryan2002). These consist of a wood-chip-bedded lying area, or ‘pad’, with or without shelter, and they generally have a concrete area adjacent, from which the animals are fed.
Provided that they are managed correctly, OWPs pose little threat to the udder and limb health of non-lactating cows when compared with cubicle accommodation (O’Driscoll et al., Reference O’Driscoll, Boyle, French, Meaney and Hanlon2008a and 2008Reference O’Driscoll, Boyle, French and Hanlonb). There are also indications that they improve cow comfort, compared with cubicle systems (O’Driscoll et al., Reference O’Driscoll, Hanlon and Boyle2008c). Nevertheless, it is essential that cow performance is not compromised on OWPs, if they are to be economically viable. Exposure to adverse environmental conditions induces a variety of behavioural and physiological responses associated with impaired performance, and thus animal housing aims to eliminate or moderate negative effects of the environment (National Research Council (NRC), 1981). Cows exposed to harsh weather spend less time feeding (Redbo et al., Reference Redbo, Ehrlemark and Redbo-Torstensson2001; Tucker et al., Reference Tucker, Rogers, Verkerk, Kendall, Webster and Matthews2007 ) and more time standing (Kiernan, Reference Kiernan2004; Tucker et al., Reference Tucker, Rogers, Verkerk, Kendall, Webster and Matthews2007) compared with sheltered cows. Cold conditions and excessive standing causes an increase in the secretion of cortisol, particularly in thin cows (Fisher et al., Reference Fisher, Verkerk, Morrow and Matthews2002; Tucker et al., Reference Tucker, Rogers, Verkerk, Kendall, Webster and Matthews2007), which is in turn associated with reduced growth (Purchas et al., Reference Purchas, Barton and Kirton1980). In Ireland, pregnant non-lactating dairy cows are almost exclusively fed grass silage during the pre-partum period, which is a low calorific diet. This, combined with lack of shelter and consequent physiological and behavioural reactions to inclement weather, could mean that performance indicators are negatively affected in cows on OWPs compared to cows in cubicles.
Another concern when keeping cows outdoors during winter is the possibility of cold stress. The lowest critical temperature of an animal is the temperature below which the animals’ metabolic rate and the rate of non-evaporative heat loss increase linearly (Autio et al., Reference Autio, Heiskanen and Mononen2007). Nutrition level, hair length, environmental conditions, subcutaneous fat depth and heat production are among factors that interact to influence the lowest critical temperature (Wagner, Reference Wagner1988). Indeed, Tucker et al. (Reference Tucker, Rogers, Verkerk, Kendall, Webster and Matthews2007) reported that a high body condition score (BCS) can mitigate the effects of winter weather on dairy cows. Dairy cows in the last trimester of pregnancy preferentially partition energy towards the growth of the foetal calf as opposed to self maintenance (Bauman and Currie, Reference Bauman and Currie1980), which could increase susceptibility of dairy cows to cold stress.
This paper describes two studies carried out over consecutive winters in Ireland. The objective was to investigate the effect that various OWP designs have on dairy cow live weight, BCS, dry matter (DM) intake, heat energy production (HEP) and sensible heat loss (SHL), compared with a conventional cubicle housing system. In addition, carryover effects on milk yield and milk composition, live weight and BCS were investigated for 8 weeks post partum. We hypothesised that unsheltered cows would have lower live weight and BCS gain pre partum, a higher feed intake, greater heat energy loss (HEL) and lower HEP than sheltered cows. Consequently, we expected that these cows would have lower live weight, BCS and milk production post partum.
Material and methods
The studies were conducted at the Teagasc ‘Ballydague’ research farm, which is part of Moorepark Dairy Production Research Centre, Fermoy Co., Cork, Ireland (50°07′N; 8°16′W) between December 2004 and June 2005 (Year 1) and December 2005 and June 2006 (Year 2).
Animals and treatments
Year 1
One hundred and forty-seven pregnant dairy cows (Bos taurus) were blocked into 49 groups of 3 animals, according to breed (Holstein–Friesian, n = 26; Normande, n = 14; Montbeliarde, n = 26; Norwegian Red, n = 28; Montbeliarde × Holstein–Friesian, n = 28; Normande × Holstein–Friesian, n = 20), parity (1.78 ± 1.58, mean ± s.d.; range = 0 to 5), expected calving date (median = 14 Feb 2005, range = 14 January 2005 till 23 April 2005) and BCS (3.09 ± 0.29). One cow from each group was randomly assigned to one of the following treatments on the 6 December 2004 (day 1); (i) indoor cubicle housing, (ii) an unsheltered OWP and (iii) a sheltered OWP. Thus, there were 49 animals in each of the three treatments.
Year 2
Ninety-six pregnant dairy cows were blocked into 12 groups of 8 animals. Groups were balanced according to breed (Holstein–Friesian, n = 54 or Norwegian Red = 42), parity (1.56 ± 1.785; range = 0 to 5), expected calving date (median = 20 February 2006, range = 26 January 2006 till 14 April 2006) and BCS (2.95 ± 0.34). One cow from each group was randomly assigned to one of two replicates of the following treatments: (i) cubicles; (ii) unsheltered OWP; (iii) sheltered OWP, all three of which had a concrete feed area; and (iv) an unsheltered OWP with a self-feed silage pit. Thus, there were 12 animals, or sampling units, in each treatment replicate. Multiparous and primiparous animals were assigned to treatment on 17 November 2005 (day 1) and 5 December 2005 (day 19), respectively.
In both years, the studies were carried out using a spring calving management system. Cows were assigned to their treatments until calving.
Housing and management
Year 1
The cubicles were bedded with rubber mats (23 mm in depth, Farm Mat™; Alfco Farm Services Ltd, Trim, Co. Meath, Ireland), and were provided at a cow to cubicle ratio of 1 : 1. All flooring was solid concrete and an automatic scraper cleaned the floor six times daily. The wood-chip-bedded lying areas on the OWPs were constructed as described by O’Driscoll et al. (Reference O’Driscoll, Boyle, French and Hanlon2008b). Cows on the unsheltered OWP had a wood-chip-bedded space allowance of 12 m2 per cow, whereas cows on the sheltered OWP were provided with 6 m2 wood-chip-bedded surface. The latter OWP was sheltered on two sides by erecting a 1.83 m high semi-porous barrier (Nicofence®; R.J.M. Mooney & Son Ltd, Dublin 12, Ireland), and overhead by a polythene tunnel (Colm Warren polytunnels Ltd, Co. Meath, Ireland). Cows were fed grass silage from a post and rail style feed barrier (60 cm per cow), on a concrete feed area that was 4.2 m wide (i.e. 2.52 m2 per cow). Manure was manually cleaned from the feed area once in each day. The OWPs were cleaned off and wood chip replaced on days 15, 44 and 62.
Between days 1 and 10 inclusive, lactating and non-lactating cows were kept separate within each treatment, in order that lactating cows could easily be gathered for milking morning and afternoon. All cows were dried off by day 11, and managed as a single group until day 15. Between days 15 and 43 inclusive, a subgroup of cows from each treatment (SUB; n = 10 cows) was separated from the rest of the group using either a metal wire (OWP treatments) or a gate (cubicles). These cows were managed identically to the rest of the cows in their respective treatments.
The mean calving date was 21 February 2005 (day 78). Approximately 6 days before calving (5.9 ± 4.41 days) cows were removed to a straw-bedded calving house. As cows were removed for calving, the space allowance in each treatment was adjusted to maintain the correct stocking density for the remaining animals. Cows remained with their calves until the next milking, then returned to a different straw-bedded house for one night. Cows that calved before day 72 (n = 73) were kept in their pre-calving treatments by night and were at pasture by day, whereas cows calving from day 72 onwards were at pasture by day and night.
Year 2
Housing and management of animals in the unsheltered and sheltered treatments was the same as in Year 1. However, cows in the sheltered treatment had a wood-chip-bedded space allowance of 12 m2 per cow, instead of 6 m2. Cows in the self-feed OWP had a wood-chip-bedded space allowance of 14.52 m2 per cow. This was equivalent to the 12 m2 wood-chip-bedded area and 2.52 m2 concrete feed area space allowances provided in the other two OWP treatments. The concrete feeding areas of the sheltered, unsheltered OWPs and the cubicle house were cleaned six times daily by an automatic scraper. The feed faces in each self-feed OWP replicate were 13.5 m in length. In order to prevent spoilage of the silage, it was necessary for 26 animals to feed from these areas. For this reason, 14 ‘filler’ animals were allocated to each of these replicates. In Year 2, the OWPs were cleaned and the wood chips replaced on days 65 and 107.
All multiparous animals were dried off by day 1. Between days 1 and 18, multiparous animals from both replicates of each treatment were kept as a single group. On day 19, they were split into their respective replicates. The mean calving date was 21 February 2006 (day 97). Animals were removed for calving approximately 3 days before calving (3.2 ± 5.51 days) to a straw-bedded calving shed, and managed as in Year 1. Cows that calved between days 69 and 89 (n = 40) were kept on an unsheltered OWP by night and were at pasture by day, whereas cows calving from day 90 onwards were at pasture by day and night.
Feeding management
In both years, all cows were offered perennial ryegrass (Loilum perenne) silage during the study period. Cows in the three treatments with a concrete feed area were offered silage from the same silage pit. Silage was offered ad libitum daily in the morning at approximately 3.5 kg (3.39 ± 2.45 kg) DM per cow above requirement in order to ensure ad libitum feeding. In Year 2, animals from the self-feed treatment were fed from a silage pit that was constructed on top of the wood-chip bedding. An electric wire was adjusted daily to permit access to fresh silage. Fresh water was available from self-filling troughs for each treatment. During Year 2, animals in both replicates were provided with separate water bowls.
At pasture, the cows were managed as a single herd. Pasture consisted primarily of perennial ryegrass. Cows were allocated fresh grass daily (Dillon et al., Reference Dillon, Crosse, Stakelum and Flynn1995) and were also supplemented with concentrates during this time. All concentrate feeding was offered in individual stalls in the milking parlour in two equal feeds each day. The average daily allowance of concentrates for the first 8 weeks of lactation during Year 1 was 5.2 ± 1.37 kg/day and during Year 2 was 5.0 ± 1.48 kg/day. Thus, during the first 8 weeks of lactation, the average concentrate intake per cow in each treatment during Year 1 was cubicles = 286.4 ± 9.33 kg, unsheltered OWP = 290.6 ± 9.05 kg and sheltered OWP = 289.3 ± 9.09 kg, and during Year 2 was cubicles = 283.0 ± 10.83 kg, unsheltered OWP = 280.4 ± 11.31 kg, self-feed OWP = 274.3 ± 11.04 kg and sheltered OWP = 278.9 ± 11.02 kg. There was no difference in concentrate intake for each treatment. The ingredient composition of the concentrate offered (kg/t) was as follows: barley 250, corn gluten 260, beet pulp 350, soya-bean meal 110 and minerals plus vitamins 30. The chemical composition was crude protein 16.8%, DM digestibility (DMD) 79.7%, NDF 32.2% and metabolisable energy (ME) 11.6 MJ/kg.
Meteorological data
Ambient air temperature and relative humidity (RH) were recorded using Gemini Tinytag Extra Dataloggers, TGX-3580 (Gemini dataloggers Ltd, Chichester, West Sussex, UK) between 20 December 2004 and 3 February 2005, and between 3 January 2006 and 21 March 2006. In Year 1, a data logger was placed in each of the treatments and data were recorded at 10 min intervals. In Year 2, one data logger was placed directly between the two replicates of the cubicles, sheltered and unsheltered OWPs, and data were recorded as before.
Wind speed and rainfall were recorded at 10 min intervals by an automatic weather station (Davis Vantage Pro™ fan aspirated; Davis Instruments Corp. Hayward, CA, USA) located in an unsheltered position adjacent to the OWPs. The data were downloaded to a computer by a data logger (Weatherlink® for Vantage Pro™; Davis Instruments Corp.). Data were collected in Year 1 between 16 December 2004 and 11 April 2005, and between 17 November 2005 and 28 April 2006 in Year 2. In addition, daily cloud cover was recorded in oktas between 0900 and 1000 h by a trained technician.
Live weight and BCS
Live weight was recorded during both the pre- and post-partum periods once weekly using calibrated stationary weighing scales (Dairymaster, Causeway Co., Kerry, Ireland). Cows were weighed and unfasted in the morning. A single observer scored BCS on a scale of 1 to 5 (1 = emaciated, 5 = extremely fat) with increments of 0.25 (Lowman et al., Reference Lowman, Scott and Somerville1976) approximately, every 3 to 4 weeks pre partum. BCS was also recorded within 1 to 2 weeks post partum (8 ± 5.1 day), and considered representative of BCS at calving.
HEP and HEL
During Year 1, HEP was estimated once per week for each cow in the SUB group in each treatment. Calculations were carried out for 4 weeks between days 15 and 43. In Year 2, HEP was estimated for all cows, for 5 weeks between days 47 and 78. Calculations were based on the model of Higgins and Dodd (Reference Higgins and Dodd1989), as per Hickey et al. (Reference Hickey, French and Grant2002). Thus, the rate of heat production (H w) for each animal was calculated from the following equation: H w=11.5 (ME − E ret), where ME = metabolisable energy intake from feed (MJ/day) and E ret = energy retained in live weight gain (MJ/day; Higgins and Dodd, Reference Higgins and Dodd1989). In order to convert H w to W/m2, body surface area was calculated from the following equation: 0.14 × L w0.57 (L w = live weight; Brody (1945) as cited by Berman (Reference Berman2003)).
In both years, HEL was estimated for cows that were used in HEP estimation, during the same 3-day period each week in which HEP was estimated. Heat lost comprises sensible and latent heat loss. Latent heat loss was assumed to have a constant value of 17 W/m2 (Higgins and Dodd, Reference Higgins and Dodd1989). SHL was estimated using the following equation: SHL = (T b – T a – (r . R n . I a)/(I t + I h + I a), where SHL is represented in W/m2, T b = core body temperature (°C), T a = air temperature (°C), r = interception factor associated with radiation exchange (0.62), R n = net radiation of the ground (W/m2), I a = environmental thermal resistance (km2/W), I t = tissue thermal resistance (km2/W) and I h = hair coat thermal resistance (km2/W).
Body temperature and hair length
In Year 1, rectal temperatures of each cow in the SUB group were recorded twice daily in the morning (between 0800 and 0900 h) and afternoon (between 1600 and 1700 h) on days in which the feed intake was recorded. Temperatures were recorded using digital clinical thermometers (FT-TH-001; Fortuna Healthcare, Enfield, Middlesex, England). In Year 2, the rectal temperature of all cows was recorded on one morning and one afternoon between 24 and 27 January, using a digital thermometer (GLA M750 digital thermometer; GLA Agricultural Electronics, San Luis, Obispo, CA, USA).
In Year 1, hair samples were taken from cows in the SUB group on 6 December 2004 and 1 March 2005. In Year 2, hair samples were obtained from all cows on 17 January 2006. The sample was pulled from the dorsal aspect of the transverse processes of the lumbar vertebrae (L4–6) immediately cranial to the coxal tubec, and consisted of approximately 100 to 200 hairs (similar to Boyle et al., Reference Boyle, Boyle and French2008). Hair was pulled from the skin to obtain the entire length. A subsample of 30 hairs from each sample was measured to 0.01 cm using a callipers and the mean hair length was estimated from these values.
Rectal temperature and hair length values were averaged for each cow within each year, so that each animal had a constant value for use in estimation of HEL and HEP.
Feed intake evaluation
Group feed intake. In Year 1, feed intake was recorded in the SUB group in each treatment over three consecutive days on four occasions between days 15 and 43. Silage was offered each day using a diet feeder that facilitated weighing of the feed. Any remaining feed was collected and weighed in the morning after the third day. Actual feed disappearance was calculated by adjusting offered feed and refusals using DM percentage calculated from the subsamples. During Year 2, group feed intake was recorded for all cows in each replicate, on three occasions between days 47and 64. Between days 67 and 73, group feed intakes were estimated daily, using the same method as before, but by weighing the feed leftover each day.
Individual feed intake. The DM intake (DMI) of each individual cow was estimated in year 2 between days 67 and 73 using the n-alkane technique (Mayes et al., Reference Mayes, Lamb and Colgrove1986), as modified by Dillon and Stakelum (Reference Dillon and Stakelum1989). Cows were dosed twice daily at approximately 0900 and 1600 h for 12 consecutive days (starting on day 62) with a paper bung (Carl Roth, GmbH, Karlesruhe, Germany) containing 500 mg of dotriacontane (C32). From days 7 to 12 of dosing, faecal grab samples were collected from each cow twice daily for the remainder of the dosing period. These samples were collected during the hour before dosing, in the morning and afternoon. The faecal samples from each cow were bulked (10 g of each sample) and dried at 40°C for 48 h in an oven with forced air circulation before chemical analysis.
The silage that was offered to the cows on each day that faecal samples were collected was also sampled. The ratio of herbage C33 (tritriacotane) to dosed C32 was then used to estimate intake. The n-alkane concentration was determined as described by Dillon (Reference Dillon1993).
Milk yield and composition
Milk yield and composition were monitored for 8 weeks post partum. Cows were milked twice daily, at approximately 0700 and 1530 h. Milk yield was measured at each milking for every cow using electronic milk metres (Dairymaster). Milk composition (fat, protein and lactose) was determined from one morning and evening milking sample taken each week by automated infrared absorption analysis using the Milkoscan 605 (Foss Electric, Hillerød, Denmark).
Feed analysis
Silage samples were taken three times weekly from offered feed in each treatment. Representative samples from each treatment or replicate was taken by collecting grab samples from the total length of the feed face. Exactly 100 g of each sample was dried at 40°C for 48 h in an oven with forced air circulation to calculate the DM percentage. Silage samples from each week within each treatment were then combined into a bulk sample. Chemical analyses were conducted on the weekly samples of the offered silage after freeze drying and grinding through a 1-mm screen using a hammer mill. These samples were then analysed for crude protein (Prot), in vitro DMD, NDF, ME (MJ/kg) and ash according to the methods referenced in McNamara et al. (Reference McNamara, O’Mara, Rath and Murphy2003) (FBA laboratories Ltd, Cappoquin Co., Waterford, Ireland).
Statistical analysis
Data were analysed using the Statistical Analyses System (SAS, V9.1). Before analysis, all data were examined for normality by examination of histograms and normal distribution plots (Proc Univariate). To obtain least square mean and standard error values for Year 1, statistical models were applied. Although statistical analysis should be interpreted with caution because of the lack of group replication, P-values obtained from the analysis are included. Meteorological data from both years were summarised (mean ± s.d.).
Live weight, BCS, milk yield and milk composition. Pre- and post-partum live weight and pre-partum BCS were analysed separately for each year using a linear model with repeated measures (Proc Mixed). Fixed effects were treatment (Year 1, n = 3; Year 2, n = 4), week (pre partum, n = 9; post partum, n = 8) and the interaction, lactation number (n = 4; 1, 2, 3 or 4 or greater) and breed (Year 1 n = 6; Year 2 n = 2). For pre-partum data, calving date and initial records were included as covariates. For post-partum data live weight, calving date and concentrate intake were covariates. Because a recording was taken each week for each cow, week was the repeated effect. Replicate, nested within treatment, was a random effect in Year 2. Cow BCS at calving was analysed using a similar model to post-partum live weight, but without repeated effects. Milk yield and composition were analysed using the same model as that used for analysis of post-partum live weight.
HEP and HEL. Data were analysed using a linear model with repeated measures (Proc Mixed). Fixed effects were treatment (n = 4), week (n = 5) and the interaction. For HEP, week was the repeated measure, and day was the repeated measure for HEL. In Year 2 replicate, nested within treatment, was a random effect.
DMI. Group DMI from Year 1 is summarised. Group DMI from Year 2 was analysed using the Mixed procedure. Fixed effects were treatment (n = 4), and whether intake was measured over 1 (n = 6) or 3 days (n = 3). Day of recording, nested in week, was the repeated effect. Individual intake was also analysed using the mixed procedure. Fixed effects were treatment, breed and lactation number, and calving date was a covariate. Replicate, nested within treatment, was a random effect. Means for each replicate using both techniques were compared using Pearson’s product moment correlation (Proc Corr).
The most appropriate covariance structure for each model was determined using the Akaike Information Criterion. A Tukey–Kramer adjustment was used to differentiate between treatment means.
Results
Meteorological data
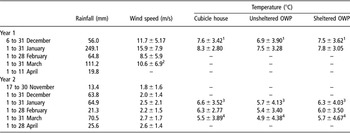
Meteorological data from both years are summarised in Table 1. The RH values in cubicles (90.9 ± 1.00%) and the covered OWP (89.4 ± 1.18%) were similar, but both were higher than the uncovered OWP (82.9 ± 1.03%). In general, ambient temperature during Year 1 (7.7 ± 0.29°C) was higher than Year 2 (6.4 ± 0.29°C).
Cumulative rainfall and average monthly wind speed recorded by the automatic weather station, and average monthly ambient temperature recorded by temperature data loggers placed in each treatment

OWP = out-wintering pad.
120 to 31 December 2004; 2Recorded between 1 and 24 March 2005; 3Recorded between 3 January 2006 and 31 January 2006; 4Recorded between 1 and 21 March 2006.
Mean daily rainfall in Year 1 (4.3 mm (0 to 5.52), mean (interquartile range)) was higher than in Year 2 (1.7 mm (0 to 1.50)). Mean daily wind speed was also higher during Year 1 (11.8 m/s (6.34 to 16.34) than Year 2 (2.4 m/s (1.06 to 3.44)).
Live weight and BCS
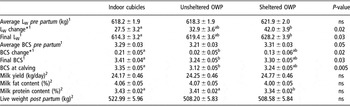
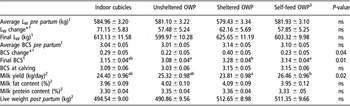
Live weight and BCS data from Year 1 are in Table 2. Live weight after 2 months on treatment and live weight change during the pre-partum period was higher in the OWP treatments than in cubicles, in particular in the sheltered OWP. There was no effect of treatment on overall pre- or post-partum live weights, live weight change, or live weight on day 81 in Year 2 (Table 3).
Mean (±s.e.) cow production parameters in each winter-housing treatment during Year 1

LW = live weight; BCS = body condition score; OWP = out-wintering pad; ns = non-significant.
1Measurements recorded pre partum. Live weight was recorded for 9 weeks between days 14 and 70. BCS was recorded every 3 to 4 weeks.
2Measurements were recorded post partum for 8 weeks.
abIndicate significant difference (P < 0.05).
*Difference between live weight and BCS on days 5 and 70.
Effect of winter-housing treatment on cow production parameters during Year 2

LW = live weight; BCS = body condition score; OWP = out-wintering pad; ns = non-significant.
1Measurements recorded pre partum. Live weight was recorded for 9 weeks between days 25 and 81. BCS was recorded every 3 to 4 weeks.
2Measurements were recorded post partum for 8 weeks.
3The self-feed OWP was also unsheltered.
abIndicate significant difference (P < 0.05).
*Difference between live weight and BCS on days 4 and 81.
In Year 1, cows on the unsheltered OWP had numerically the lowest overall BCS, BCS change and BCS after 70 days of treatment (Table 2). Overall, the BCS of cows in the unsheltered treatment tended to be lower than that of cows in the sheltered OWP (P = 0.06) or cubicle treatment (P = 0.1). Treatment had no effect on BCS pre partum in Year 2. However, there was an effect of treatment on BCS change during the pre-partum period (P < 0.05; Table 3). Similar to Year 1, the smallest BCS increase was observed in the unsheltered OWP with the concrete feed area. This increase tended to be lower than that in the sheltered OWP (P = 0.06). The increase in BCS in cows in the self-feed treatment also tended to be lower than that in the sheltered OWP (P = 0.07). Treatment also had an effect on BCS after 81 days of treatment (P < 0.05). Again, BCS on the unsheltered OWPs was lower than in the sheltered treatments (cubicles and sheltered OWP; Table 3). The BCS of cows in unsheltered OWP with the concrete feed area and the self-feed OWP was lower (P < 0.001), and tended to be lower (P = 0.09), than BCS of cows in the sheltered OWP, respectively.
HEP and HEL
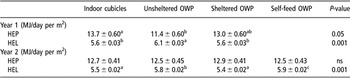
HEP and HEL results are shown in Table 4. In Year 1, the estimate for HEP in the unsheltered OWP was lower than in the cubicle house (P < 0.05) and tended to be lower than in the sheltered OWP (P = 0.1). In Year 2, there was no effect of treatment on HEP and no pairwise differences between treatments.
Heat energy production and heat energy loss estimates during Years 1 and 2

HEP = heat energy production; HEL = heat energy loss; OWP = out-wintering pad; ns = non-significant.
abcIndicate significant differences.
In Year 1, estimated HEL values in cubicles and the sheltered OWP were similar, and both were lower than estimated HEL in the unsheltered OWP (P < 0.001). There was an effect of treatment and week on estimates of HEL in Year 2 (P < 0.001). There was no difference between estimated HEL in cubicles and the sheltered OWP, but estimated HEL in the unsheltered OWP (P < 0.001) was higher than both. Estimated HEL in the self-feed OWP was also higher than in cubicles and the sheltered OWP (P < 0.001), and higher than estimated HEL in the unsheltered OWP (P < 0.01).
Feed intake evaluation
In Year 1, the mean (± s.d.) group DMI per cow in each treatment was cubicles = 10.8 ± 0.8, unsheltered OWP = 11.8 ± 0.5 and sheltered OWP = 10.8 ± 0.9 kg per cow per day. In Year 2, treatment had no effect on group DMI (cubicles = 9.3 ± 0.3; unsheltered OWP = 9.5 ± 0.3 and sheltered OWP = 9.9 ± 0.3 kg per cow per day).
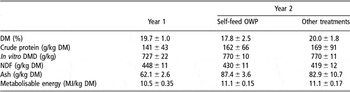
There was no effect of treatment on individual DMI (n-alkane technique). Least square mean estimates of individual intake in each treatment were cubicles = 10.7 ± 0.67, unsheltered OWP = 10.2 ± 0.69, sheltered OWP = 10.9 ± 0.67 and self-feed OWP = 10.0 ± 0.67 kg per cow per day. The DMI of nuliparous cows (8.2 ± 0.41 kg per DM per day) was lower than that of cows at the end of their first (10.2 ± 0.49; P < 0.01), second (11.9 ± 0.67; P < 0.001) and third or more (11.6 ± 0.43; P < 0.001) lactations. Pearson’s product moment correlation between mean daily DMI using the n-alkane technique and daily weighing back of feed was r = 0.79 (P = 0.06). Chemical analysis of the silage offered in both years is summarised in Table 5.
Chemical composition of silage (Loilum perenne) offered during the winter confinement period in both years (mean ± s.d.)

DM = dry matter; DMD = DM digestibility; OWP = out-wintering pad.
Discussion
Because of the study design (i.e. lack of replication of the treatment groups), Year 1 can be considered a case study, and thus statistical comparison between treatments must be interpreted with caution, and further investigation is warranted. Nevertheless, the results are in agreement with our hypothesis that unsheltered cows would have lower live weight and BCS gain pre partum, greater HEL and lower HEP than sheltered cows. Moreover, the direction of differences between treatments in Year 1 was similar to the direction of differences between similar treatments in Year 2, when groups were replicated. Thus, the results from Year 1 provide a useful comparison to results from Year 2.
Although cattle are highly resistant to cold weather, and can be kept outside in temperatures that range from −10°C to −20°C without negative effects (Young, Reference Young1981), wind and rainfall both lower the insulating effect of the animals’ coat (Higgins and Dodd, Reference Higgins and Dodd1989). Animal production efficiency is affected by both feed intake and maintenance energy requirement, which are in turn increased in adverse environmental conditions (NRC, 1981). Because estimates of energy loss are higher when rainfall and wind-speed increase, it could be expected that cows in unsheltered treatments in Year 1 would perform less well than sheltered cows.
However, contrary to expectations, there was no difference in feed intake between any of the treatments, using either group or individual intake estimation techniques. The n-alkane technique can overestimate DMI in comparison to other estimation methods (Hameleers and Mayes, Reference Hameleers and Mayes1998; Smit et al., Reference Smit, Taweel, Tas, Tamminga and Elgersma2005), and indeed DMI estimates calculated using group feed intake estimation were lower than when using the n-alkane technique. However, the correlation coefficient between both methods was higher than those calculated by Smit et al. (Reference Smit, Taweel, Tas, Tamminga and Elgersma2005), when comparing the n-alkane technique with sward cutting and net energy DMI estimates.
The similarity in feed intake across all treatments could be because ambient temperatures in each treatment were relatively similar. Thus, there was probably not enough of a difference between treatments to stimulate differences in voluntary feed intake, in agreement with intake estimates by the NRC (1981, p. 29). However, in both years, cows in the unsheltered treatments gained less body condition while on treatment than sheltered cows. They also had lower BCS after 2 months on treatment. BCS is dependent on the amount of energy portioned towards self maintenance (Yan et al., Reference Yan, Maybe, Keady and Agnew2006). Thus, a lower BCS could be because there was less available energy for conversion to fat for cows in the unsheltered treatments. Indeed, Webster et al. (Reference Webster, Stewart, Rogers and Verkerk2008) found that cows exposed to wet and windy conditions had increased secretion of non-esterified fatty acids compared with cows indoors, which is an indication of mobilisation of body reserves. Another hypothesis is that increased standing behaviour, which occurs during periods of wet and windy weather (Webster et al., Reference Webster, Stewart, Rogers and Verkerk2008; Tucker et al., Reference Tucker, Rogers, Verkerk, Kendall, Webster and Matthews2007; Kiernan, Reference Kiernan2004), could have resulted in less BCS gain in unsheltered cows. Excessive standing increases energy expenditure and can result in secretion of stress hormones that can also reduce body condition (Fisher et al., Reference Fisher, Verkerk, Morrow and Matthews2002). However, further work is necessary to elucidate specific effects of standing behaviour or adverse weather.
Although in Year 1, cows in cubicles had the highest BCS gains, this treatment had the lowest live weight gain and live weight after 2 months. Cows on the other sheltered treatment, i.e. the sheltered OWP, had the highest live weight gain and live weight after 2 months. However, live weight alone is not a good indicator of body reserves, as percentage protein, fat and water in the body, and consequently energy value of body tissue gain and loss, are highly variable (Reid and Robb, Reference Reid and Robb1971). Live weight also includes the effect of gut-fill and frame size of the animal. Most importantly, live weight during the last trimester of pregnancy is biased due to the changing mass of the uterus and foetal–placental unit (Schröder and Staufenbiel, Reference Schröder and Staufenbiel2006). What is important is that in both years of the study, cows in all treatments gained live weight and maintained or increased body condition. Furthermore, the mean BCS in all treatments was a suitable score for calving (Roche, Reference Roche2006). Thus, even under the more rainy and windy weather conditions in Year 1, cows did not have to mobilise body reserves towards self-maintenance. Boyle et al. (Reference Boyle, Boyle and French2008) and Kiernan (Reference Kiernan2004) also found that dairy weanlings and heifers kept on OWP during the winter continued to gain weight during the out-wintering period. Thus, with regard to live weight and body condition, management of dairy cows outdoors under the conditions recorded during this study did not appear to have a detrimental effect.
Our estimates of HEL and HEP fell within the range of values reported by Hickey et al. (Reference Hickey, French and Grant2002) and Boyle et al. (Reference Boyle, Boyle and French2008). In Year 1, the lowest HEP calculation was in the unsheltered OWP. This was because cow live weight was lower in this treatment than in the others during January 2005. Rainfall and wind speed were at their highest during January 2005, which is when HEP was calculated. Even short periods of standing induced by adverse weather conditions can result in reduced live weight (Fisher et al., Reference Fisher, Verkerk, Morrow and Matthews2002). However, a temporary drop in live weight gain can be regained when conditions return to favourable (Kiernan, Reference Kiernan2004). There was a reduction in rainfall and wind speed after January, which could explain why there was no effect of treatment on live weight during the entire pre-partum period.
In both years, estimates of HEL were similar in the sheltered OWP and the cubicles. Thus, the structure used to shelter the OWP was as effective at sheltering the cows as the concrete house. However, HEL was higher in both of the unsheltered treatments than in the sheltered treatments. The thermal balance of a cow is dependent not only upon the rate of heat production and loss, but also upon the net radiation heat (as opposed to sensible heat and latent heat) gained or lost to the environment, and the heat retained as a temperature change per unit surface area (Higgins and Dodd, Reference Higgins and Dodd1989). We applied the model using the assumption that the body temperature for each animal was constant, and thus that no temperature change occurred. Therefore, in this study, the difference between HEP and HEL consists of net radiation lost to the environment. In Year 1, unsheltered cows had a lower HEP and higher HEL estimate, than cows in both sheltered treatments. Thus, when weather conditions are wet and windy, proportionately more heat loss consists of sensible and latent heat, than in sheltered or dry and calm conditions. On the other hand, radiative heat is lost to the environment due to the temperature gradient, so in cold conditions, more is lost. Thus, wet and windy weather, in combination with cold weather, could place the cow in a position of cold stress. It is possible that the unsheltered cows diverted proportionately more energy towards homeostasis than sheltered cows due to a higher climatic energy demand. This could explain the lower BCS gain in these cows than cows in the sheltered treatments. However, the large differences between estimated HEL and HEP values in both years indicate that it is not likely that the cows were ever in a situation where more heat energy was being lost than was produced.
In Year 2, milk yield was highest from cows on the self-feed OWP, and lowest in the sheltered OWP. This was in contrast to our expectation that cows on the unsheltered treatments would perform less well than sheltered cows, and the reason for this result is not clear. However, none of the OWP treatments had a lower milk production than the cubicle house treatment. Thus, OWPs do not appear to pose a threat to cow performance post partum, compared to cubicle systems. The self-feed treatment differed from the other treatments with regard to the feed delivery system. It is possible that reduced competition at the feed face (O’Driscoll et al., Reference O’Driscoll, Hanlon and Boyle2008c) could have improved access to feed for all cows in this treatment (DeVries et al., Reference DeVries, von Keyserlingk and Beauchemin2005), and thus helped to maximise performance post partum. However, further work is necessary to investigate whether this feeding strategy could provide benefits for cow production performance in general.
Conclusion
Cows on unsheltered out-wintering pads lost more heat energy and tended to gain less body condition and produce less heat energy compared with cows in sheltered housing. However, these cows did not have higher DMI than sheltered cows, and production performance immediately post partum was not negatively affected. Thus, OWPs could be a viable alternative to cubicle housing for dairy cows, in Irish winter conditions. However, further work is necessary to investigate whether provision of shelter is important to reduce heat loss and maintain a suitable BCS for calving in conditions of high rainfall and wind, and to determine longer-term effects on cow performance.
Acknowledgements
We thank Noel Byrne for his technical assistance and the Ballydague farm staff for their care of the experimental animals during the study. We especially thank Samuel Dann for his help in data collection.