Introduction
China produces approximately 240 million tons of vegetable residues and over 1 billion tons of crop straw annually. Vegetable residues are characterised by high moisture content and rapid perishability, whereas straw is lignocellulose-rich and recalcitrant to degradation (Li et al., Reference Li, Cao, Wang, Ge, Li and Jin2017; Ren et al., Reference Ren, Yu and Xu2019; Wei et al., Reference Wei, Liang, Alex, Zhang and Ma2020). Traditional separate disposal of either waste is inefficient and causes serious environmental concerns (Bian et al., Reference Bian, Yang, Tu and Chen2022; Tang et al., Reference Tang, Huang, Ling, Lai and Yong2022). Vegetable residues are rich in organic compounds such as crude protein, crude fat, and soluble carbohydrates (Tomuta et al., Reference Tomuta, Moldovan, Matis, Maris, Ghitea and Banica2025; Zheng et al., Reference Zheng, Huang, Dong, Li, Hu, Chen and Ma2025), while crop straw, though more fibrous, contains appreciable amounts of sugars, starch, and protein. The rational and efficient utilisation of these agricultural by-products is therefore critical, not only for reducing environmental burdens but also for enhancing rural ecological conditions. Aerobic composting represents one established approach for recycling such wastes. However, it requires extended processing times and considerable land area. There is thus an urgent need to develop alternative, more efficient methods to convert these underutilised resources into value-added products.
The black soldier fly (Hermetia illucens L.) larva (BSFL) is a promising insect for organic waste bioconversion due to its rapid reproduction, short life cycle, and strong environmental adaptability (Fuso et al., Reference Fuso, Barbi, Macavei, Luparelli, Maistrello, Montorsi, Sforza and Caligiani2021; Bian et al., Reference Bian, Qiao, Li, Wang, Zhao, Li, Cheng and Ding2024; Da Silva et al., Reference Da Silva, Silva, Silva, Martorano, Belo, Sousa, Camargo-junior, Andrade, Santos, Carvalho, Lobato, Rodrigues, Araujo, Lima, Neves, Silva and Lourenco-junior2024). BSFL contain approximately 40%–50% crude protein and 35% crude fat, making them a high-quality insect-based protein source suitable for animal feed and aquaculture (Zhineng et al., Reference Zhineng, Ying, Bingjie, Rouxian and Qiang2021; Mshayisa et al., Reference Mshayisa, Van Wyk and Zozo2022). Previous studies have explored the use of various crop straws, such as corn and rice straw, as substrates for BSFL. For instance, Wang et al. reported that 37.4% of corn straw was digested after BSFL were reared for 14 days, but larval growth was significantly inferior to that on a standard diet (SD) (Wang et al., Reference Wang, Tian, Liu, Liu, Shang, Li, Qu and Chen2024). Liu et al. attempted to enhance the digestibility of rice straw via alkaline hydrogen peroxide pretreatment, yet observed no substantial improvement in conversion efficiency (Liu et al., Reference Liu, Wang, Yao and Chapman2021). To date, it remains to explore the feasibility of using wheat straw (WS) as one of BSFL substrates.
Compared with lignocellulose-rich straws, vegetable residues appear more suitable for BSFL rearing. Borel et al. have demonstrated that BSFL can effectively convert vitamin A-rich vegetables like carrots and pumpkins into nutrient-dense larval biomass, offering a sustainable strategy for nutrient recycling (Borel et al., Reference Borel, Hammaz, Morand-laffargue, Creton, Halimi, Sabatier and Desmarchelier2021). Several researchers have investigated mixed substrates incorporating vegetable residues with other organic wastes (e.g. butchery waste, fruit, or bread) (Jucker et al., Reference Jucker, Erba, Leonardi, Lupi and Savoldelli2017; Nielsen et al., Reference Nielsen, Hansen, Muurmann, Bahrndorff and Eriksen2025; Ojumoola et al., Reference Ojumoola, Haddi, Sanusi, Salaudeen, Onabanjo, Barbarán and Omoloye2025; Rampure et al., Reference Rampure, Velayudhannair and Radhakrishnan2025). The effect of commonly available Chinese vegetable residues on BSFL growth and quality has not been systematically evaluated.
The gut microbiota of BSFL includes bacteria, archaea, fungi, and protists, with bacteria being the dominant component (Pei et al., Reference Pei, Sun, Zhang, Lei, Chen, Kang, Ni and Yang2023; Querejeta et al., Reference Querejeta, Herve, Perdereau, Marchal, Herniou, Boyer and Giron2023). These microbes play essential roles in BSFL growth, pathogen resistance, nutrient absorption, and overall physiology (Zhang et al., Reference Zhang, Xiao, Elhag, Cai, Zheng, Huang, Jordan, Tomberlin, Sze, Yu and Zhang2022; Querejeta et al., Reference Querejeta, Herve, Perdereau, Marchal, Herniou, Boyer and Giron2023; Memon et al., Reference Memon, Zhu, Cui, Feng, Ahmad, Zeng, Nabi, Hao, Huang, Tettamanti and Tian2025). The core gut microorganisms throughout the BSFL life cycle include Providencia, Alcaligenes, Escherichia, Latilactobacillus, Corynebacterium, and Ochrobactrum (Li et al., Reference Li, Mei, Luo, Wulamu, Zhan, Huang and Yang2023). Providencia and Dysgonomonas contribute to the degradation of organic materials, and Alcaligenes protects the larvae from entomopathogenic fungi. The gut microbial community in BSFL is dynamic and can be influenced by the type of feedstock and environmental conditions (Querejeta et al., Reference Querejeta, Herve, Perdereau, Marchal, Herniou, Boyer and Giron2023; Ruan et al., Reference Ruan, Ye, Wang, Xiong, Qiao, Zhang, Huang, Cai and Yu2024; Xiang et al., Reference Xiang, Zhang, Xu and Zhang2024). When BSFL are exposed to heavy metal stress, the abundances of Brucellaceae, Enterobacteriaceae, Alcaligenaceae, Campylobacteraceae, and Enterococcaceae increase, helping the larvae resist environmental stress. Although researchers have experimented with feeding BSFL vegetable residues, the specific functions of the BSFL gut microbial community under these conditions still need to be elucidated (Purschke et al., Reference Purschke, Scheibelberger, Axmann, Adler and Jäger2017; Wu et al., Reference Wu, Wang, Xu, Cai and Xie2020).
Combining vegetable residues with WS modulates the moisture content and bulk density. The straw absorbs excess liquid from the vegetable residues, while simultaneously increasing the porosity and oxygen diffusion within the mixture. In addition, larval growth performance and body nutrient composition are not independent parameters, which are influenced by gut microbial metabolism (Wang et al., Reference Wang, Tian, Liu, Liu, Shang, Li, Qu and Chen2024). Variations in substrate composition, particularly soluble sugars, moisture, and lignocellulose content, directly affect the gut microbial community structure and functional gene expression. The subsequent carbon and nitrogen fluxes mediated by these microbes further influence larval assimilation efficiency and the accumulation of protein and lipids of larval body. Therefore, this study aims to evaluate the feasibility of using three common vegetable residues – cabbage (CA), celery (CE), and white radish (WR) – both individually and in combination with WS, as substrates for BSFL rearing. The larval growth performance, survival rates, substrate utilisation efficiency, and changes in the gut bacterial community structure were analysed. Furthermore, the nutritional composition of BSFL reared on different substrates was measured. The findings are expected to provide practical insights into the recycling of vegetable residues and WSvia BSFL bio-conversion, supporting the development of sustainable agricultural waste management strategies.
Materials and methods
Test materials and BSFL sources
Three different vegetable residues – CA, CE, and WR – were obtained from a local supermarket. WS was collected from the suburbs of Zhengzhou, Henan Province, China (34°44′ N, 113°39′ E). The vegetable residues were chopped into small pieces using a knife mill, and the WS was ground into particles (5–10 mesh). Different amounts of vegetable residues were mixed with WS to prepare the substrates. The proportions (w/w) of vegetable residues added were set at 50%, 75%, and 100%. In total, 11 substrates were used in this study, including SD (composed of 75% wheat bran and 25% corn flour), WS, CA, CE, and WR, with each vegetable residue tested at two ratios. The addition of 25% WS to vegetable residues was labeled as 75%CA, 75%CE, and 75%WR, respectively. The addition of 50% WS was labeled as 50%CA, 50%CE, and 50%WR, respectively. Each substrate was tested in triplicate. For each replicate, 10 g of premixed substrate was placed in a plastic box (15 × 11 × 11 cm) to rear BSFL (Wang et al., Reference Wang, Tian, Sun, Zhao, Xu, Li, Li, Chen and Qu2025a).
Black soldier fly eggs were obtained from Henan University of Technology and incubated under conditions of 70% humidity and a temperature of 28°C (Wang et al., Reference Wang, Tian, Liu, Liu, Shang, Li, Qu and Chen2024). BSFL were reared on an SD for 4 days. Then, 100 larvae were transferred into plastic boxes containing the prepared substrates, with the transfer day designated as day 0. Ten larvae per container were randomly sampled and weighed individually every 2 days. These 10 larvae were returned to the same container after weighing. The number of live larvae was recorded every 2 days, and deceased larvae were removed daily. Each substrate contained 100 larvae per container, and each substrate was replicated with three independent biological replicates.
Composition of substrate
All measurements followed established standard protocols. Moisture content was tested by oven-drying at 105 °C. Crude protein was measured by the Kjeldahl method (K9-Kjeltec9, FOSS, Denmark) and crude fat was determined by Soxhlet extraction (FT60, Gdana, China) (Wang et al., Reference Wang, Zhao, Tian and Chen2025b). Cellulose, hemicellulose, and lignin by the Van Soest detergent fiber method (Liu et al., Reference Liu, Wang, Yao and Chapman2021). Total organic carbon was determined by the potassium dichromate oxidation method, and total nitrogen by the Kjeldahl method. The carbon/nitrogen (C/N) ratio was then calculated as the ratio of organic carbon to total nitrogen. All analyses were performed in triplicate.
Analysis of WS
After rearing the BSFL, the substrate was washed with water three times to remove as much of the residual vegetable matter as possible. The residues from WS, 75%CA, 75%CE, and 75%WR were labeled as WSL, 75%CAL, 75%CEL, and 75%WRL, respectively. The WS was freeze-dried (Liu et al., Reference Liu, Wang, Yao and Chapman2021). Its weight was measured to determine the conversion rate. Because it was difficult to separate the WS from the vegetable residues after 16 days of BSFL consumption, the overall conversion rate of the substrate was calculated using the following equation: conversion rate (%) = (weight of initial substrate − weight of residual substrate)/weight of initial substrate × 100 (Liu et al., Reference Liu, Wang, Yao and Chapman2021). X-ray diffraction (XRD; D8 ADVANCE, Bruker, Karlsruhe, Germany) was used to evaluate the crystallinity of the WS. The crystallinity index (CIXRD) of the straw was calculated using the following equation: CIXRD (%) = (I002 − Iam)/I002 × 100, where I002 is the height of the crystalline peak at 22°, and Iam is the intensity of the peak at 18° (Nsude et al., Reference Nsude, Orie and Osi2024). Scanning electron microscopy (SEM; QUANTA FEG 250, FEI, Hillsboro, USA) was used to observe changes in surface morphology (Liu et al., Reference Liu, Wang, Yao and Chapman2021; Wang et al., Reference Wang, Tian, Liu, Liu, Shang, Li, Qu and Chen2024).
Composition of BSFL
The dry matter content, crude protein, ether extract, and crude ash of the harvested larvae from each substrate were evaluated as previously described. Briefly, fresh larvae were weighed and then dried in an oven at 85°C for 72 h. The residual weight was recorded as the dry matter content. Crude protein was measured using a Kjeldahl system (K9-Kjeltec9, FOSS, Denmark), and ether extract was determined using Soxhlet extraction (FT60, Gdana, China). Total ash content was measured after mineralisation at 550°C for 5 h in a muffle furnace (SX2-10-12TBZ, Boxun, China) (Wang et al., Reference Wang, Tian, Sun, Zhao, Xu, Li, Li, Chen and Qu2025a).
Extraction and analysis of gut microbiome
Ten larvae were randomly selected from each plastic box for gut DNA extraction. Briefly, the larvae were disinfected in 75% alcohol for 3 min, washed three times with sterile water, and dissected using a scalpel on a dissecting pan. The dissected guts were immediately stored in an ultra-low temperature freezer at −80°C for DNA extraction. Total community genomic DNA was extracted using the E.Z.N.A.™ Mag-Bind Soil DNA Kit (Omega, M5635-02, OMEGA Bio-Tek, Norcross, GA, USA), following the manufacturer’s instructions. The V3–V4 region of the 16S rRNA gene was amplified using the primers F (5′-CCTACGGGNGGCWGCAG-3′) and R (5′-GACTACHVGGGTATCTAATCC-3′). The polymease chain reaction (PCR) mixture (total volume: 50 μL) was prepared as follows: microbial DNA (10 ng/μL), 2 μL; forward primer (10 μM), 2 μL; reverse primer (10 μM), 2 μL; 5 × TransStart FastPfu buffer (AP221, TransGen Biotech, Beijing, China), 10 μL; dNTPs, 4 μL; FastPfu DNA Polymerase, 1 μL; nuclease-free water, 29 μL. PCR amplification was performed under the following conditions: initial denaturation at 95°C for 3 min; followed by 27 cycles of denaturation at 95°C for 20 s, annealing at 55°C for 20 s, and extension at 72°C for 45 s; with a final extension at 72°C for 5 min (Ali et al., Reference Ali, Muhammad, Sanda, Huang and Hou2019). The gut DNA samples were sequenced by Majorbio Bio-Pharm Technology Co., Ltd., Shanghai, China.
Operational taxonomic units (OTUs) were clustered at a 97% similarity cutoff using UPARSE (version 7.1), and chimeric sequences were identified and removed. The relative abundances of bacteria in BSFL gut samples from different substrates were calculated based on the average OTU ratios from three replicate experiments. Functional prediction analysis of bacterial communities was performed using PICRUSt (version 1.1.4), by comparing the 16S rRNA gene sequencing data with a microbial reference genome database of known metabolic functions to infer the potential metabolic capabilities of the gut microbiota. The raw sequence data reported in this paper have been deposited in the Genome Sequence Archive in the National Genomics Data Center (Project: PRJCA049128).
Characterisation of leachate
The seeds were sterilised with 0.5% potassium permanganate solution, then washed three times with water. The leachate of the residue after rearing BSFL was added to 90% (w/w) water and mixed. In each Petri dish, one piece of filter paper was placed and 10 wheat seeds were placed. Then, 10 mL of diluted leachate from different substrate was added to each dish. Later, the petri dish was incubated in an incubator at 25°C for 48 h. Seeds incubated with the addition of distilled water were used as the control. Each leachate had three replicates. After 3 days, the root length of the seedlings was measured. Germination rate was determined concurrently with the root length assay. The number of seeds germinated in the compost extract was counted after the incubation period and compared to a control (demonised water). The result was calculated using the formula: GR (%) = (Number of seeds germinated in extract/Total number of seeds) × 100.
Statistical analysis
Larval weight data collected repeatedly over time were analysed using repeated-measures ANOVA. The other data were analysed using one-way ANOVA. For both analyses, Tukey’s post hoc test was used to analyse differences among groups. All data are presented as mean ± standard deviation (SD). GraphPad Prism 9.0 (GraphPad Software, San Diego, CA, USA) and Microsoft Excel were used for data visualisation.
Results
Substrate characterisation
The initial properties of all substrates are shown in table 1. Among vegetables, CA had the highest crude protein (19.2%) and lowest lignin (2.3%). WR had the highest lignin (4.1%) and lowest fat (1.7%). WS contained high lignocellulose (cellulose 41.4%, hemicellulose 31.8%, lignin 8.2%) and a C/N ratio of 103.7. Straw addition (3:1 and 1:1) progressively raised C/N ratios and cellulose and lignocellulose contents while lowering moisture and protein. These compositional differences between substrates accounted for the subsequent variations in larval growth and gut microbial responses.
Composition of different substrates

Table 1 Long description
Rows list substrates CA, 75%CA, 50%CA, CE, 75%CE, 50%CE, WR, 75%WR, 50%WR, and WS, with columns for moisture percent, C/N ratio, crude protein percent, crude fat percent, cellulose percent, hemicellulose percent, and lignin percent, each reported as mean plus or minus standard deviation with letter markers. CA: moisture 79.1 plus or minus 1.2a; C/N ratio 11.3 plus or minus 0.4d; crude protein 19.2 plus or minus 0.5a; crude fat 3.5 plus or minus 0.2a; cellulose 16.7 plus or minus 0.8d; hemicellulose 16.9 plus or minus 0.7c; lignin 2.3 plus or minus 0.3d. 75%CA: 61.1 plus or minus 0.9c; 34.4 plus or minus 0.5c; 14.8 plus or minus 0.4b; 2.7 plus or minus 0.2a; 22.9 plus or minus 0.7c; 20.6 plus or minus 0.6c; 3.8 plus or minus 0.3c; 50%CA: 43.1 plus or minus 0.8e; 57.5 plus or minus 0.8b; 10.5 plus or minus 0.3c; 1.9 plus or minus 0.1b; 29.1 plus or minus 0.7b; 24.4 plus or minus 0.6b; 5.3 plus or minus 0.3b. CE: 70.9 plus or minus 1.5b; 12.5 plus or minus 0.5d; 6.8 plus or minus 0.3c; 2.8 plus or minus 0.2a; 15.9 plus or minus 0.9d; 13.4 plus or minus 0.8d; 3.5 plus or minus 0.4c; 75%CE: 54.9 plus or minus 1.2d; 35.3 plus or minus 0.6c; 5.5 plus or minus 0.3d; 2.2 plus or minus 0.1ab; 22.3 plus or minus 0.8c; 18.0 plus or minus 0.7c; 4.7 plus or minus 0.4c; 50%CE: 38.9 plus or minus 1.0e; 58.1 plus or minus 0.9b; 4.3 plus or minus 0.2d; 1.6 plus or minus 0.1b; 28.7 plus or minus 0.8b; 22.6 plus or minus 0.7b; 5.9 plus or minus 0.4b. WR: 76.8 plus or minus 1.3a; 13.1 plus or minus 0.4d; 7.5 plus or minus 0.3c; 1.7 plus or minus 0.1b; 15.6 plus or minus 0.8d; 12.3 plus or minus 0.7d; 4.1 plus or minus 0.4c; 75%WR: 59.4 plus or minus 1.1c; 35.8 plus or minus 0.6c; 6.0 plus or minus 0.3d; 1.4 plus or minus 0.1b; 22.1 plus or minus 0.7c; 17.2 plus or minus 0.6c; 5.1 plus or minus 0.4b; 50%WR: 41.9 plus or minus 0.9e; 58.4 plus or minus 0.9b; 4.6 plus or minus 0.2d; 1.0 plus or minus 0.1bc; 28.5 plus or minus 0.7b; 22.1 plus or minus 0.6b; 6.2 plus or minus 0.4b. WS: moisture 7.0 plus or minus 0.5 f; C/N ratio 103.7 plus or minus 2.1a; crude protein 1.7 plus or minus 0.1e; crude fat 0.3 plus or minus 0.1c; cellulose 41.4 plus or minus 1.2a; hemicellulose 31.8 plus or minus 1.1a; lignin 8.2 plus or minus 0.6a.
Note: The residual weights of substrates were the averages of three triplicates ± standard deviation. The data are expressed as the mean ± standard deviation. Values with different letters mean significant differences at P < 0.05.
Weight and survival rate of the BSFL in different substrates. (A) The mixture of cabbage (CA) and wheat straw (WS), (B) The mixture of celery (CE) and wheat, (C) The mixture of white radish (WR) and wheat straw, and (D) The survival rate of BSFL in different substrates. Values are the average (±standard deviation) of three samples (n = 3). SD (standard diet, composed of 75% wheat bran and 25% corn flour), WS, CA, CE, and WR. Repeated-measures ANOVA followed by Tukey’s post hoc test was applied, with different letters indicating significant differences between groups (P < 0.05).

Figure 1 Long description
A showing a grouped vertical bar graph. The y axis label is Ten larval weight left parenthesis g right parenthesis, ranging from 0.0 to 1.0. The x axis categories are C A, 75 percent C A, 50 percent C A, W S and S D. The legend lists day 0, day 4, day 8, day 12 and day 16. Bars within each x axis category are grouped by day. The tallest bars appear in S D at day 12 and day 16, reaching slightly above 1.0. The smallest bars appear at day 0 across categories, near 0.0 to about 0.2. B showing a grouped vertical bar graph. The y axis label is Ten larval weight left parenthesis g right parenthesis, ranging from 0.0 to 1.0. The x axis categories are C E, 75 percent C E, 50 percent C E, W S and S D. The legend lists day 0, day 4, day 8, day 12 and day 16. Bars within each x axis category are grouped by day. The tallest bars appear in S D at day 12 and day 16, reaching slightly above 1.0. The smallest bars appear at day 0 across categories, near 0.0 to about 0.2. C showing a grouped vertical bar graph. The y axis label is Ten larval weight left parenthesis g right parenthesis, ranging from 0.0 to 1.0. The x axis categories are W R, 75 percent W R, 50 percent W R, W S and S D. The legend lists day 0, day 4, day 8, day 12 and day 16. Bars within each x axis category are grouped by day. The tallest bars appear in S D at day 12 and day 16, reaching slightly above 1.0. The smallest bars appear at day 0 across categories, near 0.0 to about 0.2. D showing a vertical bar graph. The y axis label is Survival rate left parenthesis percent right parenthesis, ranging from 60 to 100. The x axis categories are C A, 75 percent C A, 50 percent C A, C E, 75 percent C E, 50 percent C E, W R, 75 percent W R, 50 percent W R, W S and S D. Bar heights range from about 80 to the low 90s. The tallest bar appears at S D, near the low 90s. The shortest bar appears at W S, near about 80.
Growth of BSFL in different substrates
Three common vegetable residues were tested at different ratios mixed with WS. As shown in fig. 1, BSFL reached a maximum weight of 106 mg per larva on day 12 when reared on the standard substrate. When different vegetable residues were used as substrates, the maximum larval weights on day 14 were 76 mg for CA, 62 mg for WR, and 54 mg for CE, indicating that CA was the most suitable vegetable residue for BSFL growth (fig. 1A–C). When mixed with WS, the maximum larval weights were 39 mg for 75%CA, 36 mg for 75%WR, and 40 mg for 75%CE, suggesting that the addition of WS influenced the growth of BSFL. It is worth noting that BSFL in 75%CA, 75%CE, and 75%WR showed almost the same weight with 50%CA, 50%CE, and 50%WR, suggesting that the addition of WS has no effect on the growth of BSFL in some ratio. As shown in fig. 1D, the lowest survival rate (81%) was observed in the WS group, whereas the highest (92%) was observed in the standard substrate group. In the mixture of vegetable residues and WS, survival rates showed decreased along with the increased addition of WS. In summary, CA was the most effective vegetable residue for promoting BSFL growth. Furthermore, BSFL weight was negatively correlated with the proportion of WS in the substrate.
Substrate utilisation and bioconversion performance
As shown in table 2, SD showed the highest utilisation rate (96.9%), waste reduction index (6.06 %/day), larval biomass yield per unit substrate (88.0%), and the lowest feed conversion ratio (0.93). Among sole vegetables, CA performed best (utilisation rate 77.7%, larval biomass yield per unit substrate 57.9%), followed by WR and CE. WS alone had the poorest performance across all indicators. Mixing vegetables with straw significantly reduced utilisation and waste reduction index compared with pure vegetables (P < 0.05), with mixed substrates showing utilisation rates of 37.1–42.0% and waste reduction index of 2.32–2.63%/day. Feed conversion ratio values for mixtures (1.05–1.20) remained comparable to pure vegetables (0.99–1.13), whereas larval biomass yield per unit substrate dropped substantially from 36.0–57.9% to 18.0–22.5%. Increasing straw from 25% to 50% caused no further significant changes in any parameter (P > 0.05), indicating that the inhibitory effect of straw was already saturated at the 25% addition level.
The surface morphology of WS in different groups was analysed using SEM. As shown in fig. 2, the surface of WS without BSFL digestion appeared smooth and flat, whereas after BSFL treatment, it became furrowed and loose. XRD analysis showed that the crystallinity of untreated WS was 43.7% (fig. 3). After 16 days of BSFL digestion, the crystallinity slightly increased to 44.8%. When 75% CA, CE, and WR were added to WS, the crystallinity values were 46.3%, 45.6%, and 44.9%, respectively (fig. 4). Overall, the crystallinity of WS did not change substantially across the different groups, suggesting that BSFL consumed both the crystalline and non-crystalline regions of WS simultaneously.
Utilisation rate of different substrates by BSFL

Table 2 Long description
Measurements compare 11 samples for weight of initial substrates in grams, residual weight of substrates in grams, utilization rate in percent, waste reduction index in percent per day, feed conversion ratio, and larval biomass yield per unit substrate in percent. Initial substrate weight is 10 g for every sample. Residual substrate weight ranges from 0.31 plus or minus 0.01 with letter a for SD to 6.65 plus or minus 0.12 with letter f for WS; other residual weights are CA 2.23 plus or minus 0.10 b, 75 percent CA 5.80 plus or minus 0.15 d, 50 percent CA 6.08 plus or minus 0.09 e, CE 3.76 plus or minus 0.13 c, 75 percent CE 5.90 plus or minus 0.18 d, 50 percent CE 6.2 plus or minus 0.11 e, WR 3.57 plus or minus 0.12 c, 75 percent WR 5.93 plus or minus 0.10 d, and 50 percent WR 6.29 plus or minus 0.08 e. Utilization rate values are SD 96.9 plus or minus 0.10 a, WS 33.5 plus or minus 1.20 f, CA 77.7 plus or minus 1.00 b, 75 percent CA 42.0 plus or minus 1.50 d, 50 percent CA 39.2 plus or minus 0.90 e, CE 62.4 plus or minus 1.30 c, 75 percent CE 41.0 plus or minus 1.80 d, 50 percent CE 38.0 plus or minus 1.10 e, WR 64.3 plus or minus 1.20 c, 75 percent WR 40.7 plus or minus 1.00 d, and 50 percent WR 37.1 plus or minus 0.80 e. Waste reduction index values are SD 6.06 plus or minus 0.01 a, WS 2.09 plus or minus 0.08 d, CA 4.86 plus or minus 0.06 b, 75 percent CA 2.63 plus or minus 0.09 d, 50 percent CA 2.45 plus or minus 0.06 d, CE 3.90 plus or minus 0.08 c, 75 percent CE 2.56 plus or minus 0.11 d, 50 percent CE 2.38 plus or minus 0.07 d, WR 4.02 plus or minus 0.08 b, 75 percent WR 2.54 plus or minus 0.06 d, and 50 percent WR 2.32 plus or minus 0.05 d. Feed conversion ratio is 0.93 c for SD, 2.41 a for WS, 1.05 b for CA, 1.20 b for 75 percent CA, 1.07 b for 50 percent CA, 1.13 b for CE, 1.05 b for 75 percent CE, 1.07 b for 50 percent CE, 0.99 b for WR, 1.19 b for 75 percent WR, and 1.08 b for 50 percent WR. Larval biomass yield per unit substrate is SD 88.0 plus or minus 1.8 a, WS 13.9 plus or minus 0.5 e, CA 57.9 plus or minus 0.3 b, 75 percent CA 21.3 plus or minus 0.3 d, 50 percent CA 18.1 plus or minus 0.2 d, CE 36.0 plus or minus 0.7 c, 75 percent CE 22.5 plus or minus 0.8 d, 50 percent CE 19.8 plus or minus 0.6 d, WR 44.1 plus or minus 1.5 c, 75 percent WR 18.0 plus or minus 0.7 d, and 50 percent WR 18.0 plus or minus 0.6 d. Several values include letter markers a through f alongside the numbers.
Note: The residual weights of substrates were the averages of three triplicates ± standard deviation. The data are expressed as the mean ± standard deviation. Values with different letters mean significant differences at P < 0.05.
Surface morphology of wheat straw (WS) in different groups – (A) WS, (B) WSL, (C) 75%CAL, (D) 75%CEL, and (E) 75%WRL – observed by SEM.

Determination of the crystallinity of wheat straw (WS) by XRD. (A) Curves of XRD and (B) Crystallinity of WS.

Figure 3 Long description
A line graph with the vertical axis label, Intensity, a u and the horizontal axis label, 2 theta angle. The horizontal axis range is 10 to 40. The vertical axis shows tick labels at 10000, 20000 and 30000. Five lines are labeled in the legend as WS, WRL, 75 percent NaCl, 75 percent CEL and 75 percent WRL. The lines each form a main peak near 22 on the horizontal axis, with additional smaller peaks between about 15 and 35. The image B showing a bar graph with the vertical axis label, Crystallinity of wheat straw percent. The vertical axis range is 0 to 50. Five bars are labeled on the horizontal axis as WR, WRL, 75 percent NaCl, 75 percent CEL and 75 percent WRL. Values printed above the bars are 43.7 percent, 44.8 percent, 46.3 percent, 45.6 percent and 44.9 percent.
Chemical composition of BSFL reared on different substrates. (A) Dry matter, (B) crude protein, (C) crude fat, and (D) crude ash. Values are the average (±standard deviation) of three samples (n = 3). One-way ANOVA followed by Tukey’s post hoc test was applied, with different letters indicating significant differences between groups (P < 0.05).

Figure 4 Long description
A box plot of dry matter percent across seven substrate groups: SD, 75 percent CA, 75 percent CE, 75 percent WR, WR, WS and CA. The vertical axis ranges from 33 to 38 percent. The median is highest for SD and lowest for WS, with WS showing a significant difference marked by letter b. No outliers are present. Panel B displays crude protein percent, ranging from 32 to 38 percent. The median is consistent across most groups, except WS, which is lower and marked by letter b. No outliers are present. Panel C illustrates crude fat percent, ranging from 16 to 24 percent. SD has the highest median, while other groups are lower, marked by letter b. No outliers are present. Panel D presents crude ash percent, ranging from 4 to 8 percent. Medians are similar across all groups, marked by letter a, with no outliers. The plots reveal distribution differences in composition metrics across substrate groups, with statistical significance indicated by letter annotations.
Chemical composition of BSFL in different substrates
The chemical compositions of BSFL reared on different substrates were shown in fig. 4. In the standard substrate, the dry matter, crude protein, and crude fat contents were 37.3%, 36.6%, and 21.8%, respectively. For BSFL reared on WS, the corresponding values were 33.6% (dry matter), 32.7% (crude protein), and 17.9% (crude fat), suggesting that WS is not suitable for BSFL growth compared to the standard substrate. The dry matter, crude protein, and crude ash contents of BSFL reared on vegetable residues and vegetable–straw mixtures were similar to those of the standard substrate. However, BSFL reared on vegetable–straw mixtures had lower crude fat contents than those reared on standard substrate.
General profile of the gut bacterial community in different substrates
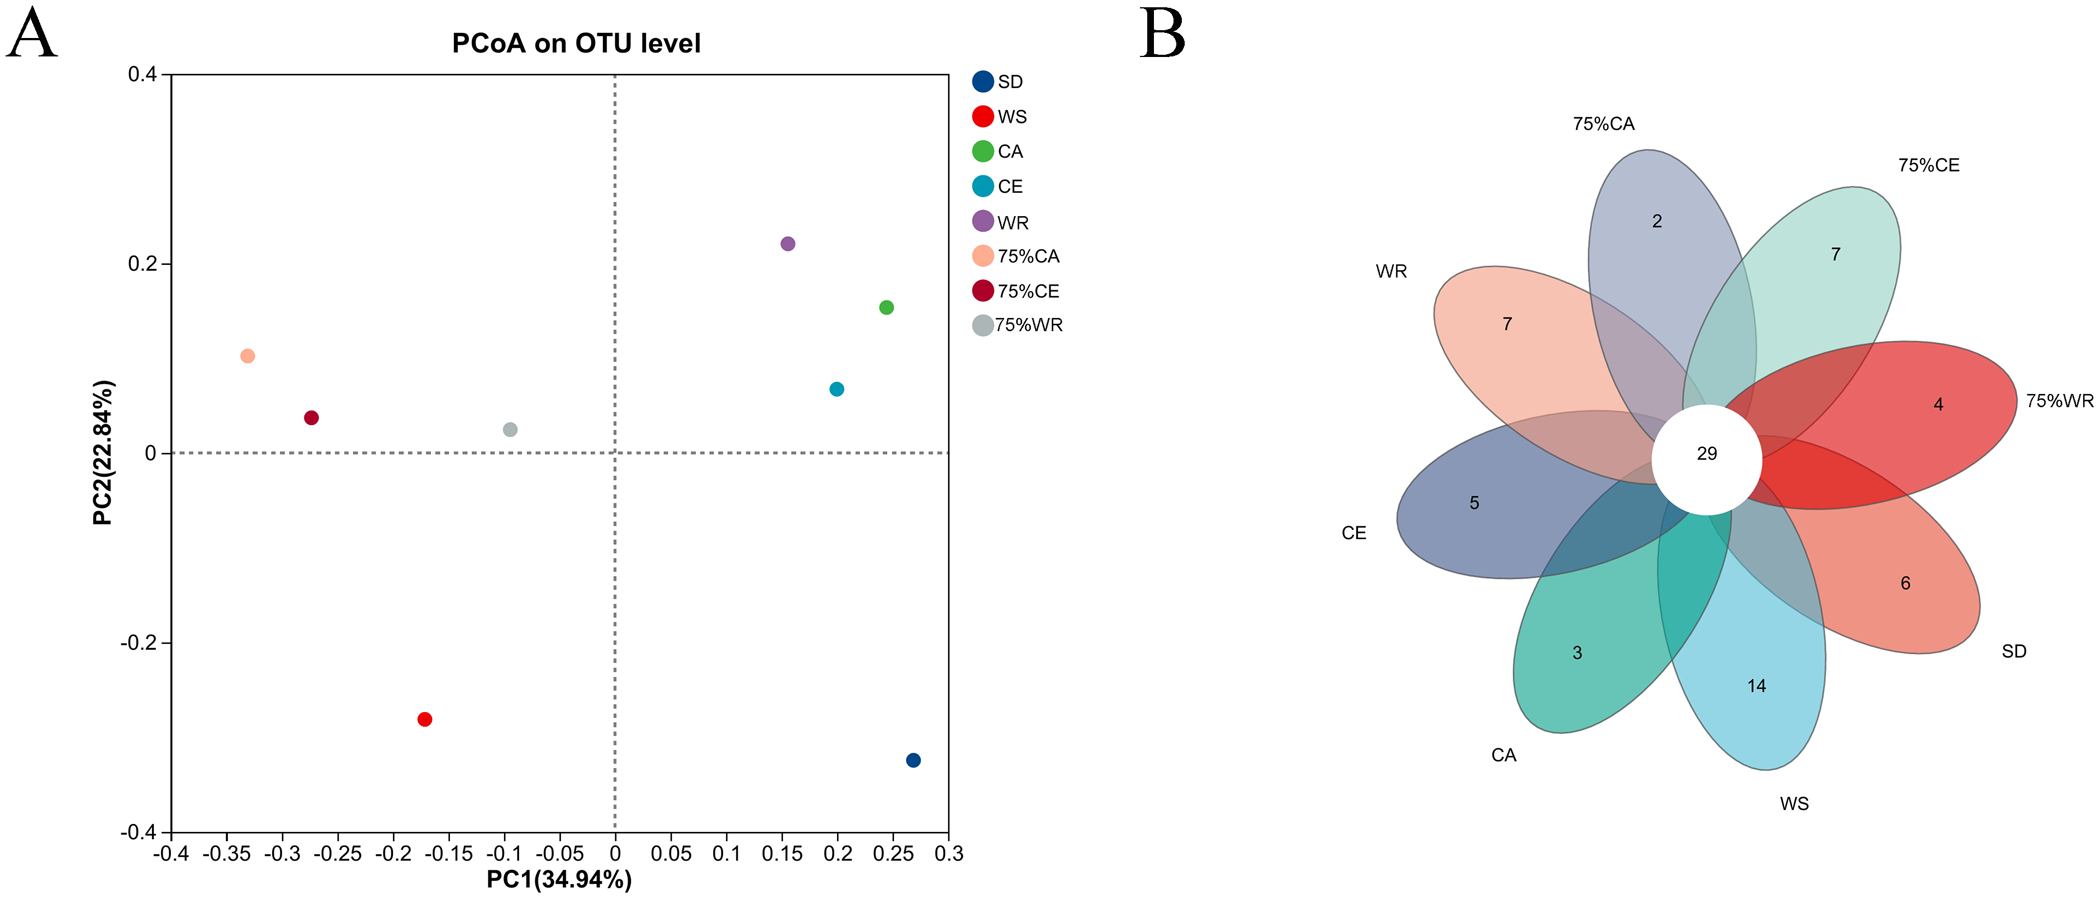
After quality filtering, 115597, 60413, 78342, 82372, 77227, 94269, 75400, and 80498 sequences were obtained from the BSFL gut samples reared on WS, SD, CA, CE, WR, 75%CA, 75%CE, and 75%WR, respectively. The numbers of bacterial OTUs for these groups were 521, 94, 193, 215, 250, 379, 222, and 317, respectively. Alpha-diversity indices were used to evaluate the richness and diversity of the intestinal microbial communities of BSFL reared on different substrates (table 3). The Sobs, Chao, and ace indices were lowest in BSFL reared on the standard substrate, and highest in those reared on WS. The Shannon indices for the vegetable residue groups were lower than those of the mixed vegetable residue and WS groups, whereas the Simpson indices were higher, indicating that the addition of WS enhanced the diversity of the intestinal microbial communities.
Alpha-diversity of the intestinal microbial community of BSFL in different substrates

Table 3 Long description
Samples SD, WS, CA, 75%CA, CE, 75%CE, WR, and 75%WR are listed with five alpha diversity metrics: ace, chao, sobs, shannon, and simpson. SD reports ace 98, chao 101, sobs 94, shannon 3.03, and simpson 0.098. CA reports 208, 213, 187, 2.90, and 0.103, and 75%CA reports 422, 404, 373, 3.37, and 0.069. CE reports 242, 233, 215, 2.47, and 0.185, and 75%CE reports 255, 252, 224, 3.16, and 0.089. WR reports 276, 272, 251, 3.22, and 0.066, and 75%WR reports 352, 342, 316, 3.49, and 0.061. WS reports ace 568, chao 543, sobs 523, shannon 3.75, and simpson 0.049. Across samples, shannon ranges from 2.47 in CE to 3.75 in WS, and simpson ranges from 0.049 in WS to 0.185 in CE.
As shown in fig. 5A, the first two axes explained a total of 57.78% of the variance in species composition. The results showed that CA, CE, and WR clustered closely together, as did 75%CA, 75%CE, and 75%WR, suggesting similarities in both microbial composition and functional gene profiles. A Venn diagram revealed 29 bacterial species shared among all groups, with each group also containing unique bacterial species (fig. 5B).
(A) Comparison of PCoA among different gut microbial communities of BSFL reared in different substrates, (B) Venn plots of common and unique bacterial species in the BSFL intestines of different substrates.

Figure 5 Long description
The PCoA scatter plot shows microbial communities of BSFL reared in different substrates. The horizontal axis is labeled PC1 left parenthesis 34.94 percent right parenthesis and the vertical axis is labeled PC2 left parenthesis 22.84 percent right parenthesis. The plot includes points representing different groups: BS, WS, CA, CE, WR, 75 percent CA, 75 percent CE and 75 percent WR. The legend indicates these groups. Points are spread across both axes, with some clustering observed among CA, CE and WR and their corresponding 75 percent groups. The Venn diagram illustrates the overlap of bacterial species among the same groups. The central region shows 29 shared species. Unique species counts are displayed in noncentral regions: CA has 14, CE has 6, WR has 7 and 75 percent CA has 7. The diagram highlights shared and unique bacterial species among the groups. Both graphs relate by showing microbial composition and shared species among BSFL reared in different substrates.
Larval gut microorganisms and prediction of microbial function
The gut microbial composition of BSFL reared on different substrates was analysed. As shown in fig. 6A, in the standard substrate, the dominant gut microbial phyla were Firmicutes (46%), Actinobacteriota (28%), Proteobacteria (16%), and Desulfobacteria (8%). In the WS group, the predominant phyla were Firmicutes (72%), Actinobacteriota (18%), and Proteobacteria (7%). When BSFL were reared on vegetable–straw mixture, or on vegetable residues alone, the gut microbial composition also varied depending on the type of vegetable used. Notably, Bacteroidota was abundant in these groups but was absent in the WS and standard substrate groups, suggesting that the presence of Bacteroidota is associated with vegetable residues. Among the three vegetables, CE induced the strongest increase in Bacteroidota, reaching 29% in the 100% CE residue group and 20% in the 75% CE + 25% WS group.
Bacterial community compositions of BSFL at the phylum (A) and genus levels (B); (C) the abundance of top 30 KO gene groups.

Figure 6 Long description
Three graphs labeled A, B and C. Image A shows a stacked bar chart titled, Community taxonomic analysis, displaying bacterial community compositions at the phylum level across different substrates: SD, WS, CA, CE, WR, 75 percent CA, 75 percent NCE and 75 percent WR. The vertical axis represents relative abundance. Firmicutes dominate most substrates, especially WS, while Actinobacteriota and Proteobacteria are also significant. Image B shows a stacked bar chart of genus-level compositions for the same substrates. The vertical axis represents relative abundance. The genus Lactobacillus is prominent in several substrates, with variations in other genera. Image C presents a heatmap titled, Heatmap of KO, showing the abundance of the top 30 KO gene groups across the same substrates. The horizontal axis lists the substrates and the vertical axis lists KO identifiers. The heatmap indicates higher KO abundance in certain substrates, with notable high regions in SD and WR. Together, these graphs illustrate how bacterial community structure and functional profiles vary across substrates, highlighting the dominance of specific phyla and genera and the functional diversity represented by KO gene groups.
In the standard substrate, the major genera included Actinomyces (28%), unclassified_f__Lachnospiraceae (10%), norank_f__Ruminococcaceae (9%), and Desulfovibrionaceae (8%). In WS, the dominant genera were unclassified_f__Lachnospiraceae (14%), Sporomusa (16%), Salana (9%), and Actinomyces (8%). When comparing the vegetable residue groups with the mixtures containing 75% vegetable residues and 25% WS, the results revealed that even a small addition of WS significantly influenced the gut microbiota. For example, the relative abundance of unclassified_f__Lachnospiraceae in the CA group was 8%, but it increased to 39% after the addition of 25% WS. Dysgonomonas accounted for 26% in the CA group but was not detected in the 75% CA + 25% WS group.
Based on the KEGG pathway analysis, the top 30 KEGG Orthology (KO) gene groups are shown in fig. 3C. The top five KO genes were K01990 (ABC-2 type transport system ATP-binding protein), K01992 (ABC-2 type transport system permease protein), K06147 (ATP-binding cassette, subfamily B, bacterial), K03088 (RNA polymerase sigma-70 factor, ECF subfamily), and K02004 (putative ABC transport system permease protein). The abundance values of K03406 (methyl-accepting chemotaxis protein) in the SD, CA, CE, and WR groups were 170879, 117059, 86526, and 123714, respectively, whereas those of K03406 in WS, 75%CA, 75%CE, and 75%WR were 297219, 306345, 204471, and 212255, respectively. These results suggested straw supplementation might be associated with an increased predicted abundance of KO3406.
Effects of different substrates on seed
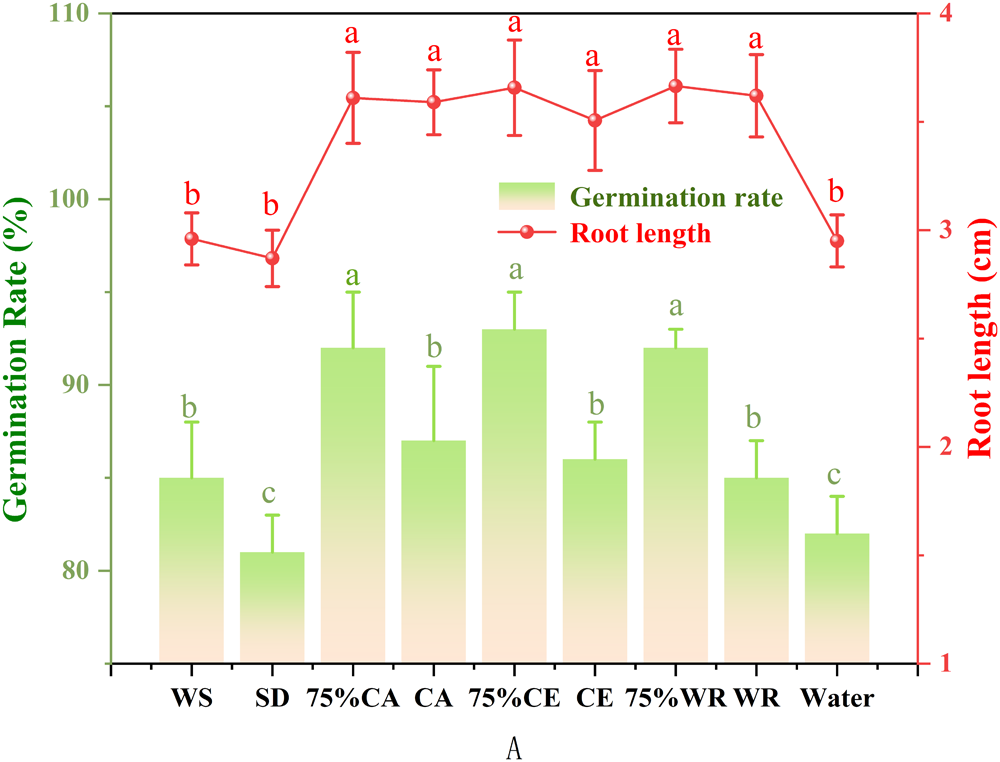
The effects of different substrate leachates on wheat seed germination rate and root length were presented in fig. 7. The lowest rate was recorded in the SD treatment (81%) and water control (82%). The highest germination rate was observed in the 75%CE treatment (93%), followed by 75%CA and 75%WR (both 92%), which were higher than CE, CA, and WR, suggesting that addition of WS to the substrate was beneficial as an organic fertiliser. Regarding root length, the water control and WS treatment yielded comparable root lengths, indicating that WS leachate showed neither stimulatory nor inhibitory effects on root growth. All vegetable residue-containing treatments significantly promoted root elongation, with root lengths ranging from 3.506 to 3.665 cm. Among these, the 75%WR, 75%CE, and 75%CA yielded the longest roots. Interestingly, the 75% mixed treatments consistently exhibited slightly longer roots than their corresponding 100% vegetable residue treatments, implying a mild synergistic effect when WS was incorporated at a 25% ratio. These findings demonstrated that vegetable residue-based substrates, particularly when combined with a moderate proportion of WS, generated leachates that actively promoted seed germination and root development.
Root length and germination rate of leachate. One-way ANOVA followed by Tukey’s post hoc test was applied, with different letters indicating significant differences between groups (P < 0.05).

Figure 7 Long description
Germination rate percent on the horizontal axis with categories, WS, SD, 75 percent CA, CA, 75 percent CE, CE, 75 percent WR, WR, Water. Germination rate percent on the vertical axis ranges from 80 to 110. Root length centimeter on the right vertical axis ranges from 0 to 4. A legend lists Germination rate and Root length. Bar values: WS about 85, SD about 82, 75 percent CA about 90, CA about 88, 75 percent CE about 92, CE about 86, 75 percent WR about 93, WR about 87, Water about 83. Line values: WS about 3.0, SD about 2.8, 75 percent CA about 3.6, CA about 3.6, 75 percent CE about 3.7, CE about 3.6, 75 percent WR about 3.7, WR about 3.6, Water about 3.0. Small letters appear above each bar and above each line marker.
Discussion
This study systematically evaluated the growth performance, gut microbiota dynamics, and nutritional quality of BSFL reared on three types of vegetable residues and their mixtures with WS. The results demonstrated that BSFL achieved the most favorable growth on CA residues, reaching a maximum individual weight of 76 mg, which was 72% of that attained on the SD. This superior performance on CA may be attributed to its richer nutritional profile compared to CE and WR. CA is notably rich in vitamin A (provitamin A carotenoids), with approximately 4468 IU per 100 g (Malhotra, Reference Malhotra2006; Moreb et al., Reference Moreb, Murphy, Jaiswal and Jaiswal2020). Retinoic acid, the oxidised form of vitamin A, is a crucial signaling molecule in insects, involved in regulating immune function, cell differentiation, and overall growth and development (Dewett et al., Reference Dewett, Labaf, Lam-Kamath, Zarringhalam and Rister2021; Kumar et al., Reference Kumar, Has, Lam-Kamath, Ayciriex, Dewett, Bashir, Poupault, Schuhmann, Knittelfelder, Raghuraman, Ahrends, Rister and Shevchenko2022). Furthermore, CA contains higher levels of vitamin C (45 mg/100 g) compared to CE (10 mg/100 g) and WR (20 mg/100 g) (Malhotra, Reference Malhotra2006; Moreb et al., Reference Moreb, Murphy, Jaiswal and Jaiswal2020). Vitamin C has been reported to enhance feed intake and growth rates in BSFL (Borel et al., Reference Borel, Hammaz, Morand-laffargue, Creton, Halimi, Sabatier and Desmarchelier2021). The presence of β-carotene in CA, a precursor to retinoic acid, further supports various physiological processes, including gene expression and cell proliferation (Moreb et al., Reference Moreb, Murphy, Jaiswal and Jaiswal2020; Maoka et al., Reference Maoka, Kawase, Hironaka and Nishida2021). These findings suggest that the vitamin and carotenoid content in substrates plays a significant role in BSFL growth, indicating that vitamin supplementation could be beneficial, particularly in large-scale rearing systems utilising vegetable residues.
The utilisation of crop straw as a sole substrate for BSFL remains challenging due to its high lignocellulose content and low nutritional value. Our findings align with previous research; Wang et al. reported that BSFL reared on corn straw reached a final weight of only 39 mg with a 37.4% substrate consumption rate (Wang et al., Reference Wang, Tian, Liu, Liu, Shang, Li, Qu and Chen2024). Similarly, in this study, BSFL reared solely on WS achieved a maximum weight of 32 mg with a utilisation rate of only 33.5% (Liu et al., Reference Liu, Wang, Yao and Chapman2021). Interestingly, when 25% WS was added to vegetable residues, larval growth was significantly reduced compared to pure vegetable residues, highlighting the negative impact of straw inclusion on growth performance. However, the addition of vegetable residues to WS substantially improved its utilisation efficiency, with the highest utilisation rate (42%) observed in the 75% CA mixture. This synergistic effect suggests that vegetable residues may provide essential nutrients or moisture that facilitate the activity of lignocellulolytic microbes in the BSFL gut, thereby enhancing straw degradation. This finding has practical implications for the formulation of mixed substrates, suggesting that the proportion of straw should be carefully controlled to avoid compromising larval growth while still achieving waste reduction objectives (Gao et al., Reference Gao, Wang, Lu, Zhu, Liu, Wang and Lei2019).
The structural changes observed in WS after BSFL digestion provide further evidence of larval capability in processing lignocellulosic materials. SEM analysis revealed that the originally smooth and compact surface of WS became furrowed and loose after BSFL treatment, indicating substantial physical and potentially enzymatic degradation. However, XRD analysis showed no dramatic changes in crystallinity across different treatment groups, suggesting that BSFL and their associated microbes consumed both crystalline and amorphous regions of cellulose simultaneously. This contrasts with some microbial degradation processes that preferentially target amorphous regions, and warrants further investigation into the specific enzymatic mechanisms involved in BSFL-mediated straw degradation.
The gut microbial community of BSFL exhibited remarkable plasticity in response to different dietary substrates. Consistent with previous studies, Actinobacteria, Firmicutes, and Proteobacteria were identified as the dominant phyla in the larval gut (Gorrens et al., Reference Gorrens, De Smet, Vandeweyer, Bossaert, Crauwels, Lievens and Van Campenhout2022; Querejeta et al., Reference Querejeta, Herve, Perdereau, Marchal, Herniou, Boyer and Giron2023). The observed increase in Firmicutes abundance in response to straw addition was consistent with the association between this phylum and lignocellulose-rich environments. Members of the Firmicutes, including genera such as Bacillus and Clostridium, have been reported to produce extracellular enzymes involved in the breakdown of complex polysaccharides (Hashmi et al., Reference Hashmi, Bindschedler and Junier2020; Hossain et al., Reference Hossain, Chowdhury, Mozumder, Chowdhury, Ali, Rahman and Dey2020). It is therefore plausible that the higher cellulose and lignocellulose content in straw-containing substrates favored the proliferation of these fibrolytic taxa, reflecting the adaptive capacity of the BSFL gut microbiome to dietary composition. However, it should be noted that the results were based on 16S rRNA sequencing, which revealed taxonomic composition rather than direct functional activity. The inferred link between Firmicutes enrichment and enhanced lignocellulose degradation remains correlative rather than causal. Direct measurements of cellulase or xylanase activities, or metatranscriptomic profiling of CAZyme gene expression, would be required to confirm whether the observed taxonomic shifts translate into increased degradation activity (Habib and Xiao, Reference Habib and Xiao2025; Yang et al., Reference Yang, Yang, Gan, Chen, Xu, Ali and Zhuo2025; Zhu et al., Reference Zhu, Xu, Tao, Ali and Zhuo2026).
Functional prediction of the gut microbial communities based on KEGG pathways revealed that the top enriched gene categories were primarily involved in metabolic and genetic information processing. Notably, the abundance of methyl-accepting chemotaxis protein (KO3406) was significantly higher in substrates containing WS compared to SD or pure vegetable residues. Chemotaxis proteins play crucial roles in bacterial movement toward nutrient sources and away from harmful substances, facilitating efficient substrate colonisation and degradation. The upregulation of this function in straw-containing groups suggested that gut bacteria might employ chemotaxis to navigate and exploit the complex lignocellulosic matrix, thereby enhancing its decomposition and supporting larval nutrition in suboptimal feeding environments (Zhu et al., Reference Zhu, Ruan, Hu, Miao and Ye2023).
The nutritional composition of BSFL reared on different substrates revealed important trends. While the dry matter and crude protein contents of BSFL reared on vegetable residues or their mixtures with WS were comparable to those fed the SD, the fat content was approximately 2% lower across most test substrates. This reduction in lipid content may reflect differences in the fatty acid profiles of the substrates or energy allocation strategies under different dietary regimes. Nevertheless, the consistent protein content across most treatments suggests that BSFL can maintain their protein quality even when reared on agricultural residues, supporting their potential as a sustainable protein source. The ash content remained relatively constant across all substrates, indicating that mineral composition was not significantly influenced by dietary treatments. A more comprehensive nutritional characterisation, including amino acid composition, fatty acid profile, mineral contents, and chitin levels, would be required to fully assess the potential of BSFL biomass as an animal feed ingredient. Future studies aimed at feed formulation should incorporate these analyses to better evaluate the nutritional value of BSFL reared on vegetable–straw mixtures.
The germination index test of the residual leachates (fig. 7) provided preliminary evidence that the post-BSFL residues may be safe for agronomic use, as no phytotoxic effects were observed. This suggests that BSFL-based bioconversion could contribute to a circular economy model where agricultural wastes are transformed into insect biomass and residual materials with possible agronomic value (Anyega et al., Reference Anyega, Korir, Beesigamukama, Changeh, Nkoba, Subramanian, van Joop, Dicke and Tanga2021). However, germination tests alone are insufficient to confirm fertiliser quality. A comprehensive evaluation, including NPK content, organic carbon, C/N ratio, microbial safety, and phytotoxicity index, would be required before the residues could be certified as organic fertilisers or recommended for field application.
In conclusion, this study demonstrates that vegetable residues, particularly CA, can serve as effective substrates for BSFL rearing, while the addition of WS, though reducing growth performance, enhances straw utilisation and modulates the gut microbiota towards a more fibrolytic community. These findings provide valuable insights for developing sustainable strategies for agricultural waste management using BSFL, contributing to the advancement of circular bioeconomy approaches in agriculture.
Author contributions
X.W.: Writing – review & editing manuscript, Investigation, Formal analysis, Supervision, Resources, Conceptualisation, Funding support. Y.Y. and Z.L.: Methodology, Formal analysis, Data curation. R.M. and R.J.: Methodology, Investigation, Formal analysis. H.L.: Funding support, Review manuscript. P.C.: Supervision, Project administration. J.Q.:Funding support, Supervision, Project administration.
Data availability statement
The raw sequence data reported in this paper have been deposited in the Genome Sequence Archive (Genomics, Proteomics & Bioinformatics 2021) at the National Genomics Data Center (Nucleic Acids Res 2024), China National Center for Bioinformation/Beijing Institute of Genomics, Chinese Academy of Sciences (Project: PRJCA049128).
Financial support
This study was funded by China Postdoctoral Science Foundation project (2024M760792), the Cultivation Funds Plan of Henan University of Technology (No. 2024PYJH045), Zhengzhou Outstanding Young Scientific and Technological Program, and Key Research and Development Special Project of Henan Province (No. 261111114600).
Competing interests
The authors declare no conflicts of interest.