

Development—defined here as a change in land use from a natural or agricultural state to residential, commercial, industrial, transportation, or recreational use—is a main driver of archaeological site destruction in many parts of the world (e.g., see Darvill and Fulton Reference Darvill and Fulton1998; Egloff Reference Egloff2019; Kankpeyeng and DeCorse Reference Kankpeyeng and DeCorse2004; Payntar Reference Payntar2023; Vitelli and Pyburn Reference Vitelli and Pyburn1997). Development often involves extensive modification of natural land surfaces through clearing, earthmoving, compacting, and placement of buildings or materials such as concrete and asphalt.
Development is driven primarily by population growth as well as factors such as changes in zoning policies or land prices (e.g., Mustafa et al. Reference Mustafa, Saadi, Cools and Teller2017). Around the world, the expansion of inhabited areas damages or destroys nearby archaeological sites. Rapid, uncontrolled urban growth can have a devastating impact on heritage resources of all types, both through primary impacts such as earthmoving and secondary impacts such as increased erosion or changes in local water tables (e.g., Egloff Reference Egloff2019; Lane Reference Lane2011; Payntar Reference Payntar2023). Associated factors such as increased air pollution can also impact archaeological sites via increased erosion induced by changes in vegetation cover or physical degradation of archaeological resources such as rock art or historic buildings (Dornieden et al. Reference Dornieden, Gorbushina and Krumbein2000; Koestler and Vedral Reference Koestler and Vedral1991).
Even in nations with regulations intended to preserve heritage resources or mitigate damage to sites and structures, uncontrolled growth will have a negative impact. In the United States, for example, Section 106 of the National Historic Preservation Act only protects archaeological resources that will be impacted by projects that involve federal funds or permits. Although state and local laws may provide some additional protection (e.g., Illinois Section 707; https://www.ilga.gov/Legislation/ILCS/Articles?ActID=372&ChapterID=5), these regulations are an uneven patchwork that will apply in some locations and circumstances but not others. Given recent efforts at the federal and state levels to exempt entire classes of undertakings (e.g., oil and gas development, expansion of military facilities) from environmental and cultural resources review, increasing numbers of heritage resources may become unprotected in the future.
Climate change is likely to accelerate development as populations relocate in response to changing environments. Human decisions about how, when, why, and where to migrate are complex, and not all cities and regions will be equally attractive to migrating populations, families, and individuals (Clement et al. Reference Clement, Rigaud, de Sherbinin, Jones, Adamo, Schewe, Sadiq and Shabahat2021). Internal, climate-induced migration in the United States will be driven by a variety of slow-onset (heat, drought, and sea-level rise) and sudden-onset (storms, floods, and fires) phenomena (see Piguet et al. Reference Piguet, Pécoud and de Guchteneire2011; Robinson et al. Reference Robinson, Dilkina and Moreno-Cruz2020; Shu et al. Reference Shu, Porter, Hauer, Olascoaga, Gourevitch, Wilson, Pope, Melecio-Vazquez and Kearns2023). Although the Midwest will not escape negative impacts from climate change (see Reidmiller et al. Reference Reidmiller, Avery, Easterling, Kunkel, Lewis, Maycock and Stewart2018), parts of the region are likely to maintain more of their suitability for human habitation than states to the south and west (see Xu et al. Reference Xu, Kohler, Lenton, Svenning and Scheffer2020). Plentiful fresh water, affordable housing, a relatively mild climate, and low vulnerability to destructive phenomena such as hurricanes and wildfires suggest Illinois is likely to attract new population from other, more vulnerable regions (e.g., see Learner Reference Learner2022; Lustgarten Reference Lustgarten2024; Van Berkel et al. Reference Berkel, Derek, Gibbons, Naud and Lemos2022).
In this article, we use projections based on demographic, spatial, and archaeological data from the Illinois Inventory of Archaeological Sites (IIAS) and the Illinois Archaeological Predictive Model (IAPM) to estimate the impact that development may have on precontact archaeological sites in Illinois, the most populous state in the Midwest. The location of Illinois in the Midwest, the presence of both urban and rural areas, and the availability of high-resolution estimates of archaeological site probability paired with a robust sample of previously documented sites make the state a suitable test case for examining how development associated with climate-driven migration may impact archaeological sites.
We first discuss global trends in population growth and urbanization. We then develop an example of the aggregate impact that development will have on archaeological sites in Illinois, beginning with an estimate of the number of archaeological sites impacted by development over the last century. Looking forward, we use 2020 census data to examine the relationship between the population size and density of 1,466 populated areas in the state. We mathematically model the growth of both population size and developed area in these populated places in three different growth scenarios spanning the years 2020–2100. We then use geographic information systems (GIS) analysis to artificially expand the boundaries of existing populated places toward the target sizes identified by mathematical modeling, and we overlay the expanded boundaries onto the IAPM to estimate the number of archaeological sites that will be impacted by development by 2100. Finally, we discuss the potential impacts of development to archaeological sites around the world, highlighting the similarities and differences with our Illinois example.
Global Trends in Development and Urbanization
The world’s total population doubled from two to four billion between 1927 and 1974 and then doubled again to eight billion by 2022 (United Nations 2024). Over the last half century, this growth has been accompanied by a steady shift in where the population is distributed: over half of the world’s population currently lives in urban areas, compared to about 37% 50 years ago (United Nations 2019:23; United Nations World Urbanization Prospects 2024). The percentage of the population living in urban areas is higher in the United States (about 83% in 2022) than in the world as a whole, and it has also increased steadily over the last six decades.
World trends of population growth and urbanization are expected to persist well into the twenty-first century. The United Nations (UN) projects that the world’s population will peak at about 10.3 billion people in the 2080s (United Nations 2024) and that about 70% of the world’s population will live in cities by 2050 (United Nations 2019), which will undoubtedly spur continued development in and around growing urban areas.
Although urbanization of the world’s population began well before warnings from scientists about global climate change intensified in the 1980s (e.g., Houghton et al. Reference Houghton, Jenkins and Ephraums1990), climate-driven migration is likely to amplify the movement of people to cities in the coming decades (Clement et al. Reference Clement, Rigaud, de Sherbinin, Jones, Adamo, Schewe, Sadiq and Shabahat2021). Climate-driven migration is already commonplace (e.g., McLeman Reference McLeman2019; Pörtner et al. Reference Pörtner, Debra C., Melinda M. B., Elvira, Mintenbeck, Andrés and Marlies2022; United Nations Office of the High Commissioner for Human Rights and Platform on Disaster Displacement 2018; Xu et al. Reference Xu, Kohler, Lenton, Svenning and Scheffer2020), and some projections suggest that hundreds of millions of people worldwide will move within their own countries by 2050 because of slow-onset climate-change impacts such as higher temperatures and changing patterns of precipitation that affect the livability of entire regions (see Clement et al. Reference Clement, Rigaud, de Sherbinin, Jones, Adamo, Schewe, Sadiq and Shabahat2021; Xu et al. Reference Xu, Kohler, Lenton, Svenning and Scheffer2020). A disproportionate number of climate migrants are likely to settle in cities as they avoid or abandon rural areas affected by flooding, drought, sea-level rise, and declines in water availability and crop productivity (Clement et al. Reference Clement, Rigaud, de Sherbinin, Jones, Adamo, Schewe, Sadiq and Shabahat2021). In many cities in Asia and Africa, this is likely to fuel the growth of large, sprawling, impoverished, and unregulated developments on city margins (Clement et al. Reference Clement, Rigaud, de Sherbinin, Jones, Adamo, Schewe, Sadiq and Shabahat2021). Although the expansion of urban areas in the United States is likely to be more orderly (Angel Reference Angel2023), it will also include sprawling expansion that will convert existing natural and agricultural land into urban land.
Importantly, the growth of individual urban areas can far outpace total population growth, given that preferential migration can concentrate population into relatively small areas even if the overall population size of a region or nation remains stable. Global population grew by about 28% between 2000 and 2020 (an average annual growth rate of about 1.2%; United Nations 2024), for example, whereas the populations of some of the largest cities in the world (e.g., Delhi, Shanghai, Dhaka, Beijing) grew by over 80% in the same period. In the United States, rapidly growing urban areas include Lee County, Florida (Ft. Myers); Maricopa County, Arizona (Phoenix); and Fulton County, Georgia (Atlanta): the populations of these areas grew between 16% and 73% from 2000 to 2020 (US Census Bureau 2010a, 2023a). Population flows from urban to suburban or periurban areas can also cause developed areas to expand even when core metropolitan areas lose population (Sutradhar et al. Reference Sutradhar, Spearing and Derrible2024).
A Historical Perspective on Development Impacts on Archaeological Sites in Illinois
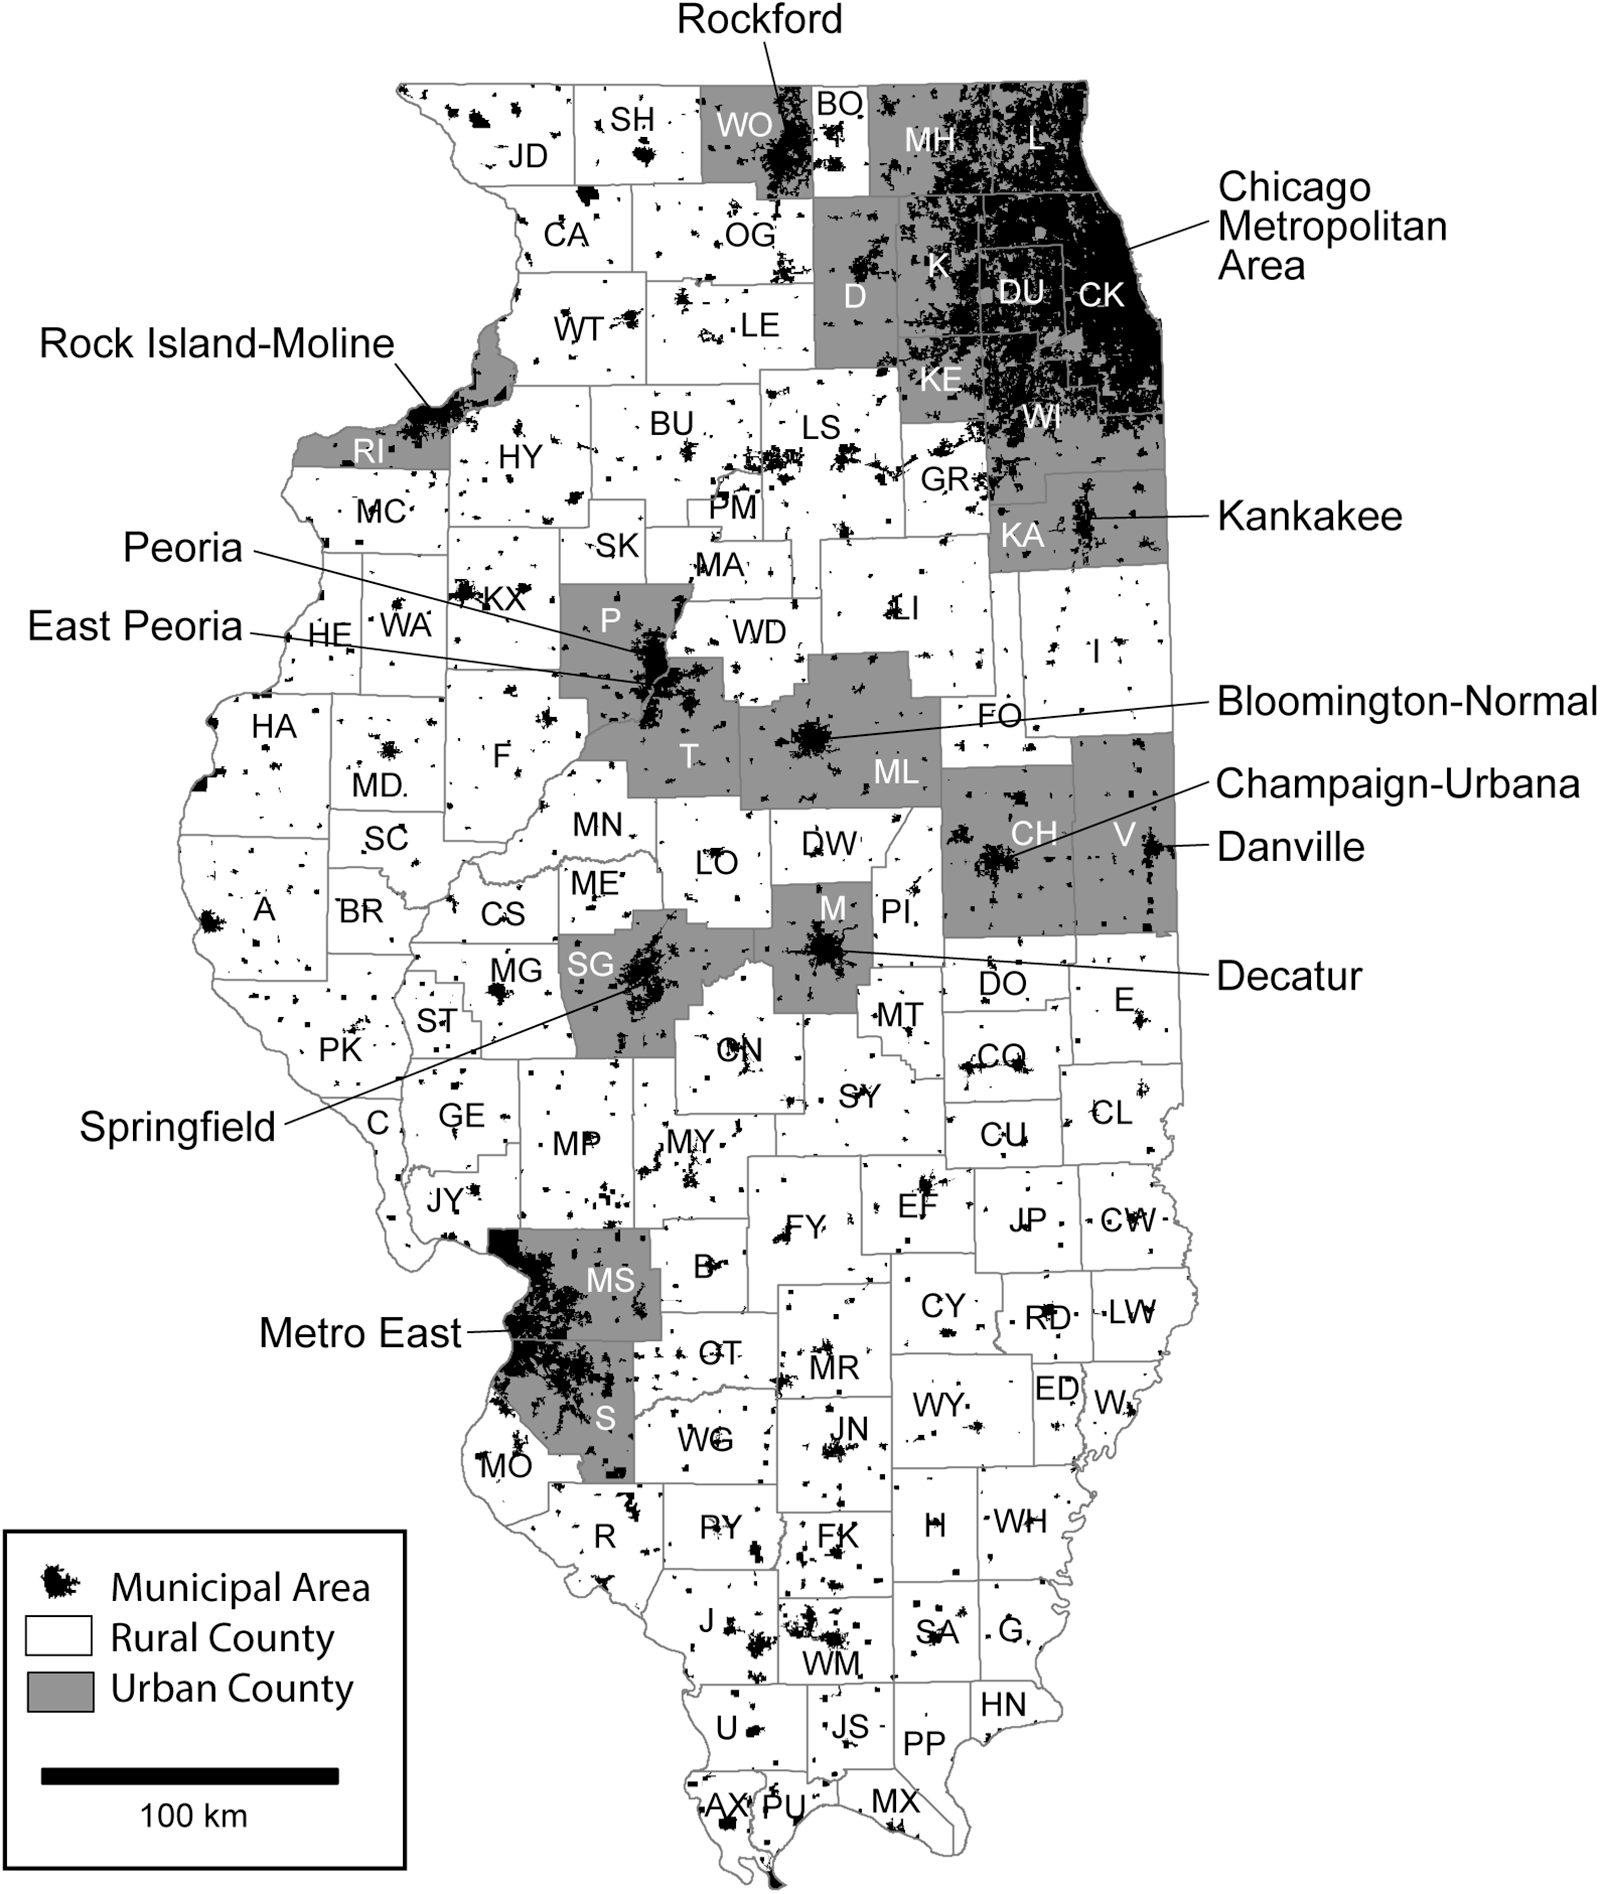
The state of Illinois encompasses about 150,000 km2 (15 million hectares, or 37.1 million acres), roughly 61%–71% of which is classified as agricultural land, cropland, or farmland (Islam et al. Reference Islam, Katchova and Zulauf2024; US Department of Agriculture 2024:3). The state government classifies 82 of 102 Illinois counties as rural, meaning that they are not part of a metropolitan statistical area defined by the United States Census Bureau or have a population less than 60,000 (see Illinois Primary Health Care Association 2020). Significant urban areas include the Chicago metropolitan area; the Metro East area across the Mississippi River from St. Louis, Missouri; and developed areas associated with several smaller cities in the central and northern parts of the state (Figure 1).
Rural and urban counties and municipal areas in Illinois.

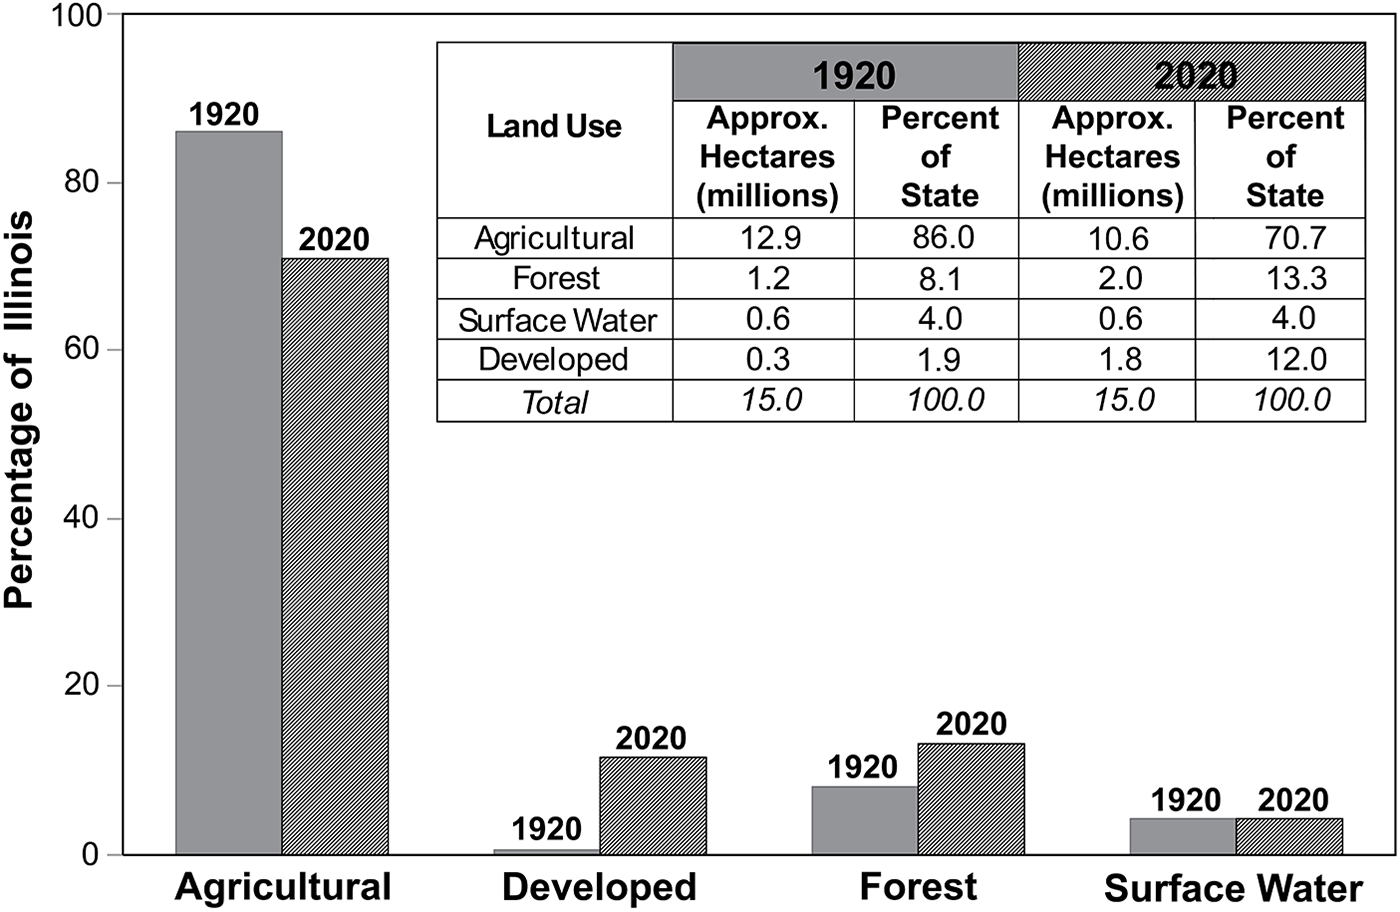
It is difficult to determine precisely how much of Illinois has already been developed. About 2.0 million ha of the state are forest land (USDA Forest Service 2022), and 0.6 million ha (including a portion of Lake Michigan) are surface water (United States Census Bureau 2010b; Figure 2). After accounting for the 10.6 million ha of agricultural land, this leaves about 1.8 million ha (12% of the state) that have certainly or probably been developed. About 1.25 million ha were within the boundaries of the 1,466 populated places listed in the 2020 census, which include about 88% of the state’s total population of 12.8 million (United States Census Bureau 2023b). This suggests that a significant amount of development—on the order of 0.53 million ha, or about 30%—has occurred outside of the 1,466 populated places. GIS data from 2020 compiled by the US Department of Agriculture (National Agriculture Statistics Service 2020) show about 1.5 million ha of developed land in the state, including land occupied by towns and cities as well as transportation infrastructure and energy, sanitation, and industrial facilities. This suggests that about 18% of developed land is outside of the 1,466 populated places. Although these two estimates do not align precisely, they are consistent with the general idea that significant portions of developed area (18%–30%) are outside of the 1,466 populated places. This is important for the site impact projections discussed below.
Percentage of Illinois area accounted for by agriculture, development, forest, and surface water; approximate changes between 1920 and 2020.

Land use in Illinois has changed dramatically over the last century (see Figure 2). As the population nearly doubled (growing from about 6.7 million in 1920 to 12.8 million in 2020), the amount of agricultural land decreased by over 2 million ha (United States Census Bureau 1922:367; US Department of Agriculture 2024:3), and the amount of forested land increased by about 0.8 million ha from its low point in the early 1920s (see Telford Reference Telford1926). Estimating the area covered by surface water in 1920s Illinois is difficult because summary data are not readily available. Given that most of the large water drainage/engineering projects in the state had been largely completed by the 1920s (Imlay and Carter Reference Imlay and Carter2012; Winsor Reference Winsor1987) and the large majority of surface-water area is Illinois’s portion of Lake Michigan, it is reasonable to assume little change between 1920 and 2020. The five largest of Illinois’s artificial reservoirs, all constructed between the 1950s and 1970s, cover a total area of only about 27,500 ha (United States Geological Survey 2007).
The estimates for agricultural land, forest, and surface-water area in 1920 total 14.7 million ha, leaving just 0.3 million ha for development. Viewed in the context of the patterns of 2020, this figure seems much too low: if the ratio of population to developed area was similar in 1920 and 2020, we would expect that municipalities including 6.7 million people would have encompassed over twice that area and that total developed area would have been around 0.9 million ha. In fact, however, population density tended to be higher in urban areas prior to the widespread adoption of the automobile and the mobility that it offered. Pickard’s (Reference Pickard1967:Table S-2) data specifies that the population of the Chicago–Northwestern Indiana region existed at a density of 0.03 ha/person (3.1 million people in 961 km2, about 3,226 people per km2) in 1920. Densities of populations in other major urban areas (New York, Philadelphia, Boston, Detroit, and Pittsburgh) were comparably high (Pickard Reference Pickard1967:Table S-2). Currently, the city of Chicago has a population density of about 4,568 people per km2 (2.7 million people in 591 km2, about 0.02 ha/person), on par with the densities of large urban centers in the 1920s. The sprawling municipal areas in the ring of counties around Cook County have lower population densities: 0.06 ha/person (1,529 people per km2) in Aurora, for example, and 0.11 ha/person (899 people per km2) in Joliet. Although the entire population of Illinois in 1920 (6.7 million) was not as densely packed as the population of Chicago (2.7 million), available data suggest that a developed area of less than 0.4 million ha statewide in 1920 is not implausible.
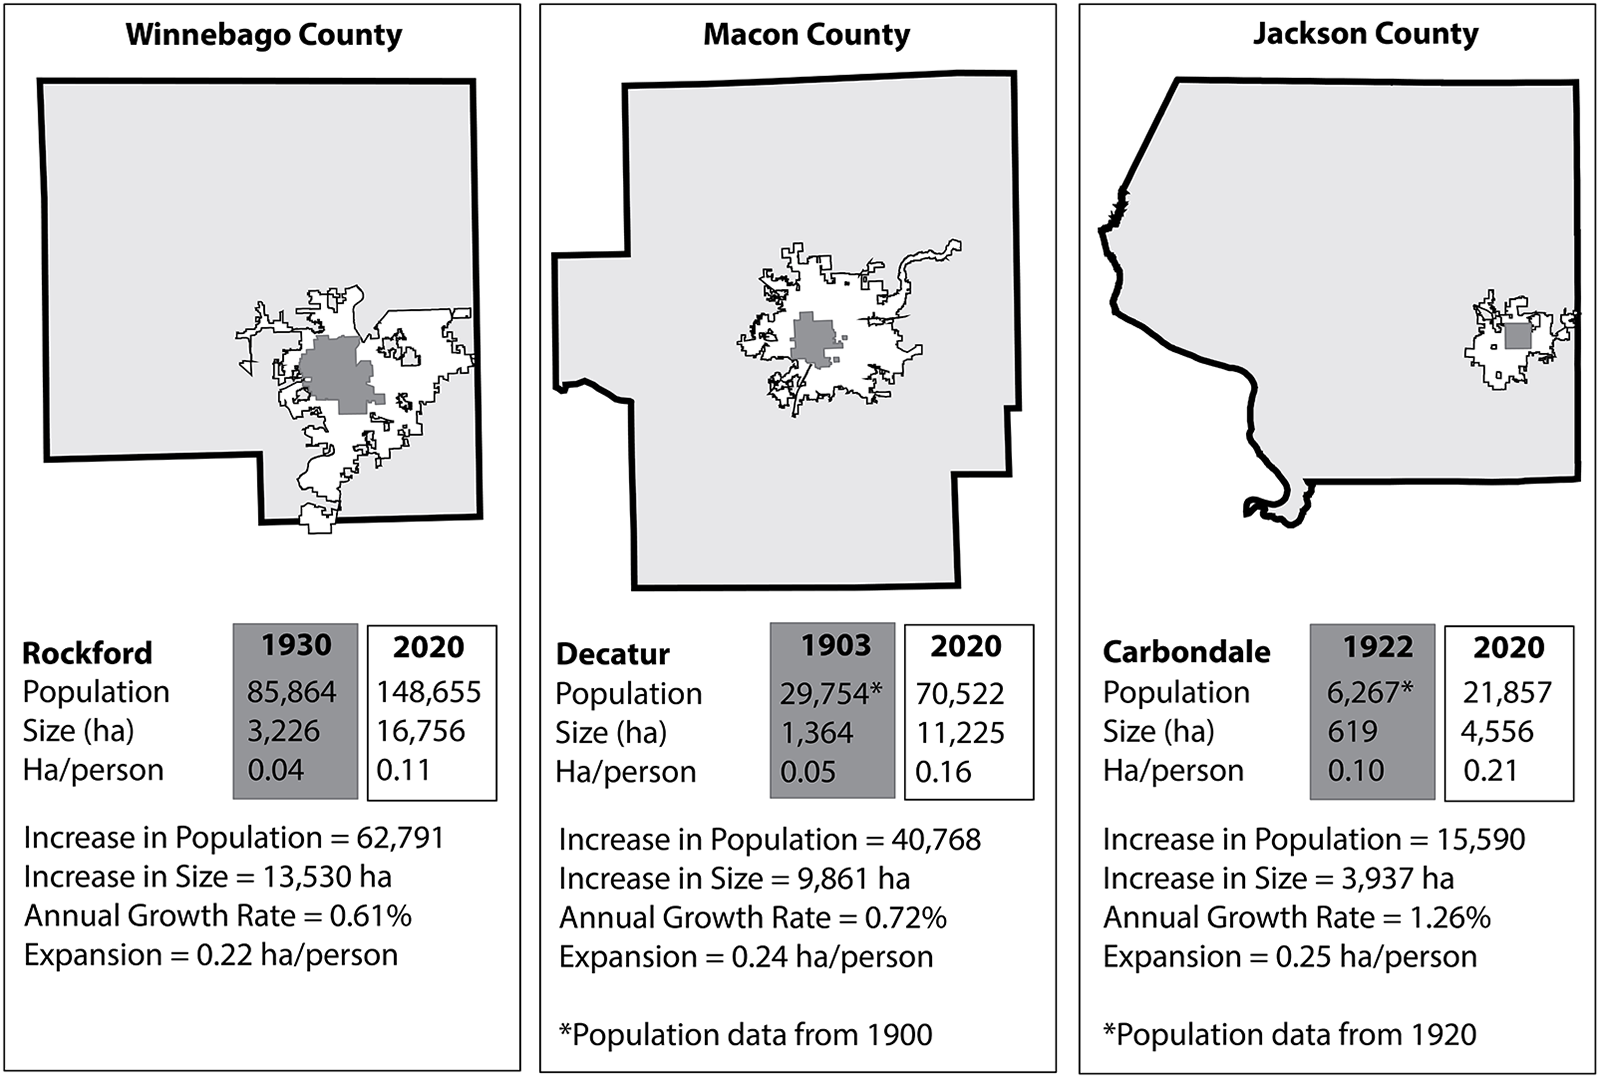
Consequently, it seems reasonable to estimate that about 1.5 million ha of land in Illinois—10% of the state—were developed between 1920 and 2020. Most of this development came at the expense of agricultural land. Large swaths of land were developed in the Chicago metropolitan area and across the river from St. Louis, as well as around smaller towns and cities all over the state. Comparisons of maps from the early twentieth century and from 2020 illustrate the dramatic expansion of urban areas around Rockford, Decatur, and Carbondale (Figure 3). In these smaller cities, population growth generally has entailed about 0.22–0.25 ha of additional urban area per person.
Expansion of the Rockford, Decatur, and Carbondale, Illinois, metropolitan areas between the early twentieth century and 2020.

In the simplest terms, we can expect that development of 10% of the land in the state between 1920 and 2020 impacted about 10% of the cultural sites in the state. We can use summary data from the IIAS database of known sites and data from the IAPM (discussed further below) to estimate the impact in terms of the numbers of sites. As of 2024, 57,838 precontact sites were recorded in Illinois, and about 809,000 ha of the state had been professionally surveyed. Dividing the total number of surveyed hectares (809,000) by the total number of recorded precontact sites (57,838) yields an average density of about one precontact cultural site per 14 ha. Importantly, however, a substantial number (nearly 40%) of the recorded sites do not fall within a documented survey area (i.e., they were not reported in the context of a formal, systematic survey with known spatial boundaries). Consideration of only sites falling within professionally surveyed areas yields a density of about one site per 23 ha. This is likely an underestimate of the actual density of sites in surveyed areas, because we are unlikely to discover every site in a given survey area for a variety of reasons (e.g., variation in survey intensity, methods, and conditions).
If we extrapolate these site densities to the 14.6 million ha of land in Illinois (excluding Illinois’s portion of Lake Michigan), we can project that the state probably contained between 635,000 and 1.04 million archaeological sites prior to contact. On the low side (assuming a density of one site per 23 ha), 1.5 million ha of development between 1920 and 2020 would have affected about 65,000 cultural sites. On the high side (assuming a density of one site per 14 ha), more than 107,000 sites would have been affected. The greatest impacts over the last century were surely in the urban counties shown in Figure 1. In most cases, the “impact” to a cultural site by development is its destruction. Very few of the impacted sites were examined by professional archaeologists prior to destruction.
Estimating Future Impacts of Development on Heritage Resources
Development is closely linked to population growth. Estimating impacts from future development in Illinois requires estimating where populations will grow and how that growth will impact heritage resources. Unfortunately, it is impossible to predict precisely and accurately how the population of Illinois (or any other state) will change in size and spatial distribution decades from now; population predictions, like weather predictions, become more uncertain the farther into the future they extend. Projections for 2020 calculated in the early 1990s (Campbell Reference Campbell1994) for the 10 most populous states, for example, erred by as much as 17.5% and did not anticipate the booming populations of southern states such as Texas, Florida, and Georgia. A projection from 50 years ago (Illinois Bureau of the Budget 1975) overshot the 2020 population of Illinois by 2.6 million people (over 20%). More recent projections for the state (e.g., Shahidullah and Sakach Reference Shahidullah and Anna M.2024) assume a continuation of a decade-long trend of declining population and do not consider emergent factors such as climate change. Illinois unexpectedly gained population in 2023 and 2024 due, in part, to international migration (United States Census Bureau 2024).
These uncertainties make it difficult to justify reliance on any specific population projection to model possible long-term development scenarios. Instead, we generate a range of estimates of the cumulative impact of future development based on several different hypothetical population growth rates. We first use 2020 census data to examine the relationship between the population size and density (ha per person) of 1,466 populated places in the state, demonstrating a predictable relationship between these two variables. Then, we mathematically model the growth of both populations and developed areas in these places in three different growth scenarios over an 80-year period ending in the year 2100. We use GIS analysis to “grow” the spatial boundaries of populated places toward the target population sizes generated by mathematical modeling, and we overlay the expanded boundaries onto the IAPM to estimate the number of archaeological sites that will be impacted by that growth. Finally, we roughly estimate the impact on archaeological sites of development that will occur outside of urban areas to support transportation, commerce, sanitation, and energy production infrastructure.
Population Size and Density
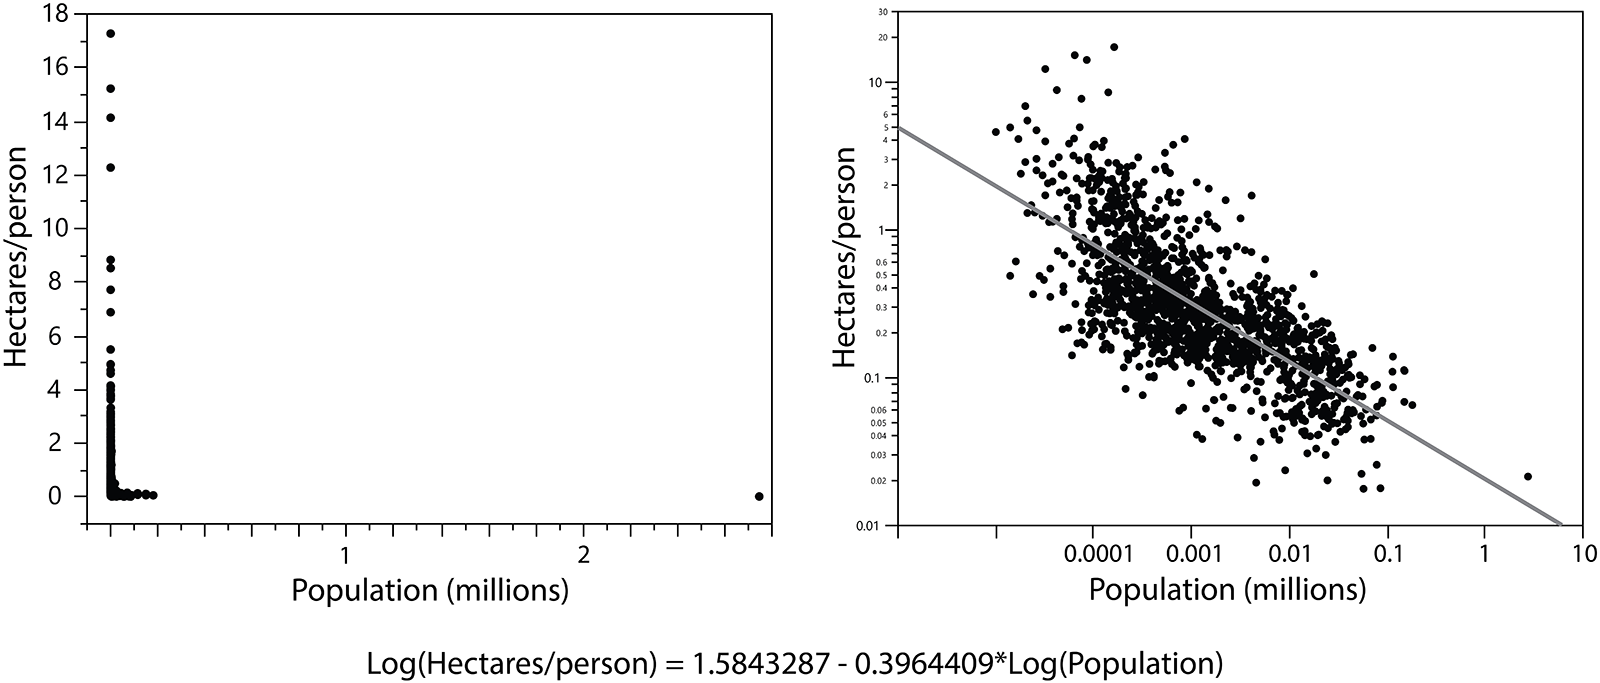
Population and spatial data from the 2020 census (United States Census Bureau 2021) show the relationship between population size and density in 1,466 “populated places” (Figure 4, left). As population size increases, the number of hectares per person decreases because larger cities incorporate more multistory/multifamily dwellings to make more efficient use of space.
Scatter plots of the relationship between population size and density on a linear scale (left) and log-log scale (right). Line corresponds to the regression formula.

The relationship between population size and density is clearly nonlinear (Figure 4). The city of Chicago, a distant outlier on the regular plot, falls in line with the other municipalities on the log-log plot (Figure 4, right). The nonlinear relationship between population size and density suggests a power law relating the two variables, which is unsurprising given that the presence of such relationships are among many aspects of urban growth, infrastructure, and social life (e.g., Bettencourt et al. Reference Bettencourt, Lobo, Helbing, Kühnert and West2007; Salat Reference Salat2017).
Fitting a line to the log-log plot of the data allows us to derive a regression formula relating population size to density. This formula, represented by the line in the log-log plot and shown at the bottom of Figure 4, is used to model changes in the size of the populated places as they grow.
Mathematical Modeling
Three annual percentage growth rate (APGR) scenarios were modeled: 0.5%, 1.0%, and 1.5%. First, the population of each place was increased incrementally year by year using the modeled growth rate. The year 2020 was taken as Year 0 (Y0), and 2100 was taken as Year 80 (Y80). In the 0.5% APGR scenario, for example, the population in Y1 was calculated by multiplying the population in Y0 by 1.005; the population in Y2 was calculated by multiplying the population in Y1 by 1.005, et cetera. Then, annual growth in the spatial size of each place was calculated. The size (in hectares) provided by the United States Census Bureau for 2020 was taken as the size in Y0. The size in Y1 was calculated as
 \begin{equation*}Y_1Size=\left(e^{\left(1.5843287-\left(0.3964409\ast In\left(Y_0Pop\right)\right)\right)}\right)\ast\left(Y_1Pop-Y_0Pop\right)+Y_0Size\end{equation*}
This formula adds area to the size of the populated place to accommodate the population increase and follow the scaling relationship shown in Figure 4: the larger a municipality becomes, the less space is required for each additional person. The formula is repeated sequentially for each year. The first portion of the equation uses the regression formula shown in Figure 4 to calculate the number of hectares required for each new person based on the existing population size, employing the logarithmic transformations identified in the formula. The resulting number (hectares per new person) is then multiplied by the change in population size to determine the number of hectares to be added to the populated place. The additional area is then added to the existing area to calculate the new total area of the populated place.
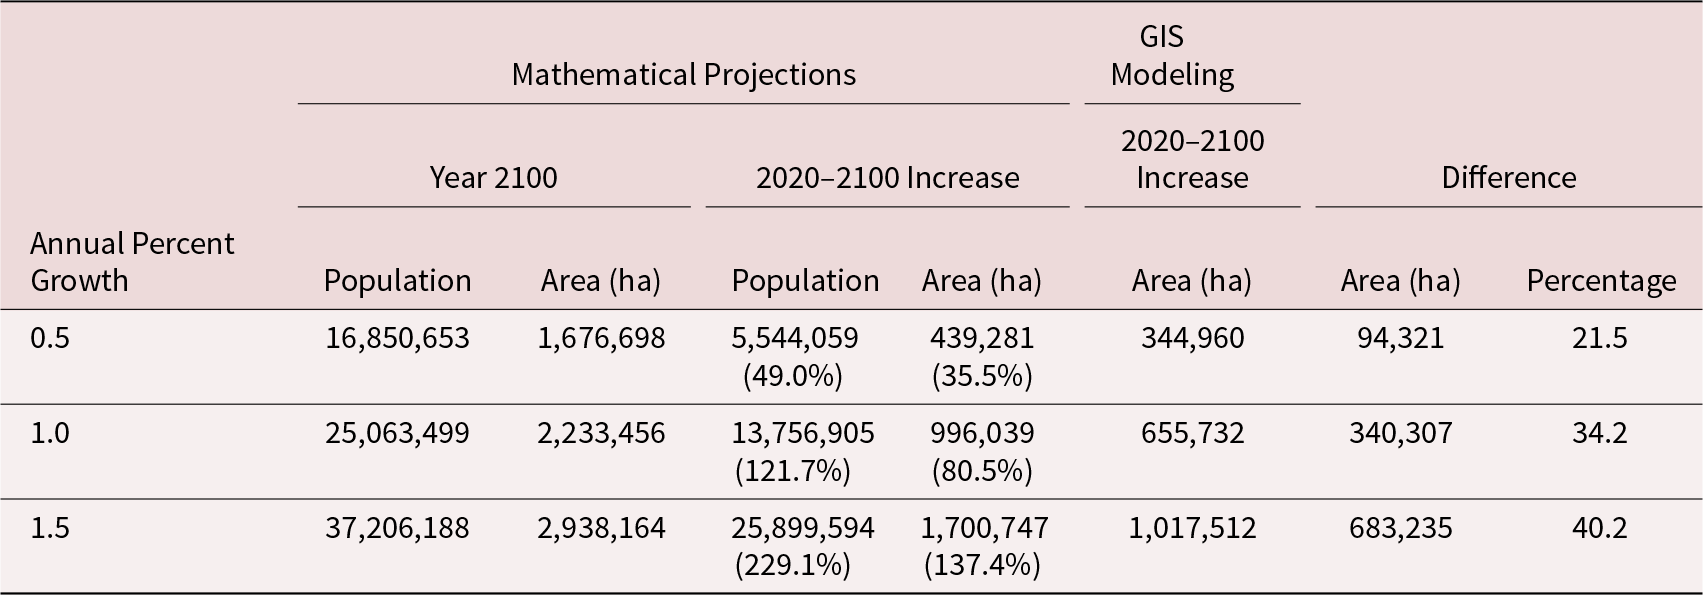
The final estimated sizes of the 1,466 populated places in terms of both population and area are shown for the three growth scenarios in Table 1 and Supplementary Material 1. In 2020, the total population was 11,306,594, and the total size was 1,237,417 ha. Note that final population estimates for the year 2100 can be generated using a standard population growth formula:
 \begin{equation*}x\left( t \right) = {x_0}*{\left( {1 + r} \right)^t}\end{equation*}
Mathematical Projections of Growth by Year 2100 for 1,466 Populated Places in Illinois and Comparisons with GIS Modeling Results.

In this formula x(t) is the final population, x0 is the initial population, r is the annual percentage growth rate, and t is time in years. Occupied area does not increase linearly with population, however, given that each population increase adds fewer hectares per person to the size of a municipal area than the previous population increase.
GIS Modeling
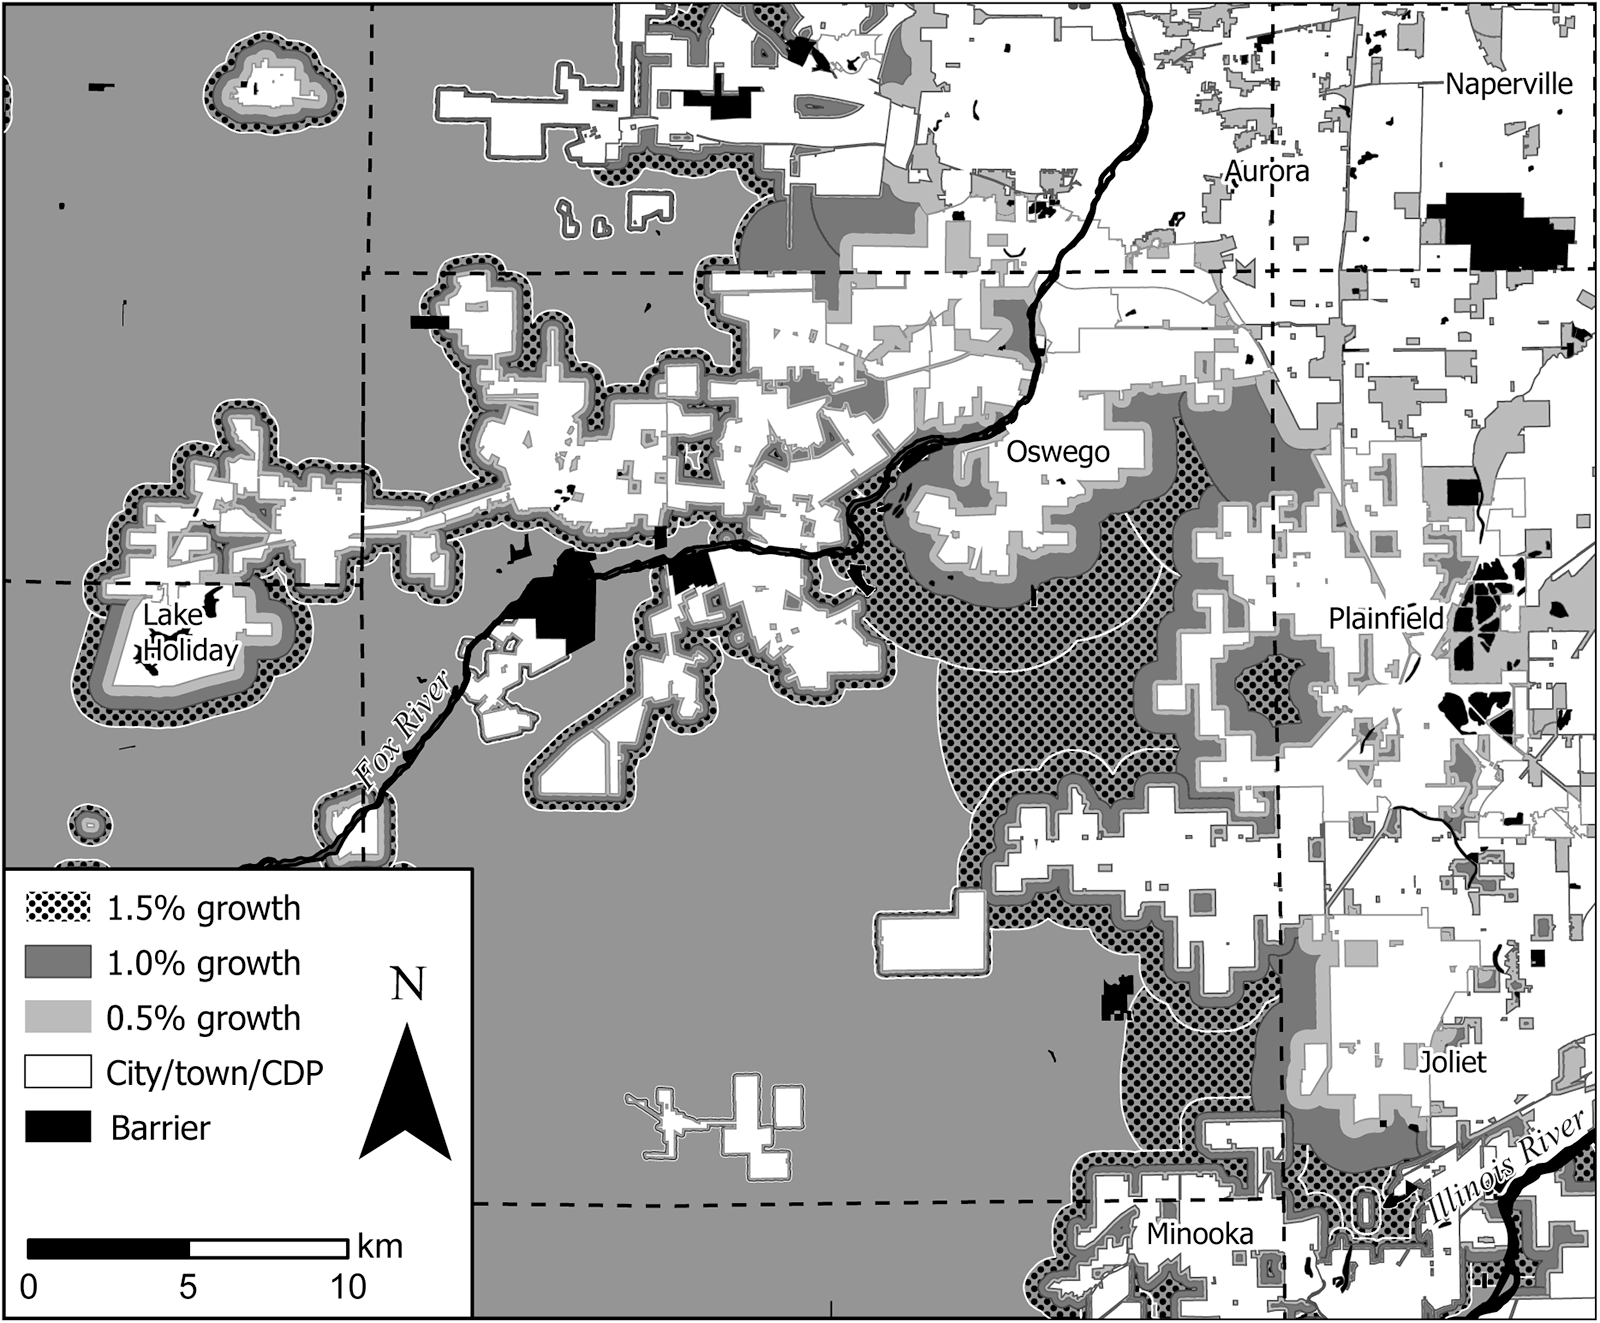
We used GIS (ArcGIS Pro 3.3) to model the spatial expansion of populated places (towns, cities, and census designated places [CDPs]) by the year 2100 under the three APGR scenarios. Each populated place was grown until it reached the target size predicted by mathematical modeling. This was accomplished with the Euclidean Distance tool using barrier features (discussed below), generation of very tightly spaced contours that correspond to distance from a municipality’s edge, and selection of the final contour with an area that most closely matched the predicted final size (Figure 5). All input data and geoprocessing tools (produced in ArcGIS Pro ModelBuilder) associated with models for the three APGR scenarios can be downloaded at https://doi.org/10.13012/B2IDB-6829928_V1.
Modeled expansion of urban areas in the vicinity of Kendall County, Illinois. Existing urban areas are white. Shaded areas show modeled expansion under 0.5%, 1.0%, and 1.5% APGR scenarios.

Cities and towns grew following several simplifying assumptions. First, each place grew evenly in all available directions until it reached its final size. Although this is clearly unrealistic given historic patterns of development, a more granular analysis would consider numerous complex variables (e.g., local zoning policy, real-estate availability and pricing, locations of key infrastructure and social services). We ignore those factors and focus on understanding aggregate impacts of development under different population-growth scenarios.
Second, cities were not allowed to expand into or across seven kinds of spaces: (1) existing urban areas, (2) areas already occupied by modeled expansion of other places, (3) airports, (4) open water, (5) state and national parks and forest land, (6) county forest preserves or similarly designated natural areas, and (7) borders of adjacent states. Although these constraints are appropriate for the present, they may be less realistic in the long term. Although it is unlikely, for example, that municipalities will expand into protected national forest and state park lands in the immediate future, public lands could someday be sold or rezoned. The courses of rivers and the boundaries of both artificial and natural bodies of water could also change.
Third, the geoprocessing tools used in the analysis grew cities, towns, and CDPs one at a time, and the expanded areas were appended to a single feature class. Growth order was determined by the unique ID used in the census-derived GIS data. Because adjacent places very rarely had similar IDs, the main effect of this iterative, one-place-at-a-time growth was a degree of stochasticity in the direction and shape of development associated with particular cities and towns, mainly dictated by the order in which neighboring municipalities were allowed to grow.
In all three APGR scenarios, the spatial growth of developed areas in GIS fell short of the development targets set by mathematical modeling (see Table 1). The percentage of shortfall is positively related to the APGR and the number of hectares of targeted development. This is because spatial expansion of many of the municipalities with the largest populations is highly constrained by physical features of the landscape (such as Lake Michigan and the Mississippi River) and the presence of adjacent municipalities. The mathematical modeling was based on the premise that municipalities will attract new population in proportion to the existing size of their population, but calculations of area of new development associated with those population increases were not made with real geographical constraints in mind. The largest contributors to this effect were the shortages of available undeveloped land around the Chicago and East St. Louis metro areas. The land required for additional growth increases between the 0.5%, 1.0%, and 1.5% APGR scenarios, causing more cities in these areas to become “landlocked” and preventing them from growing to their final projected size.
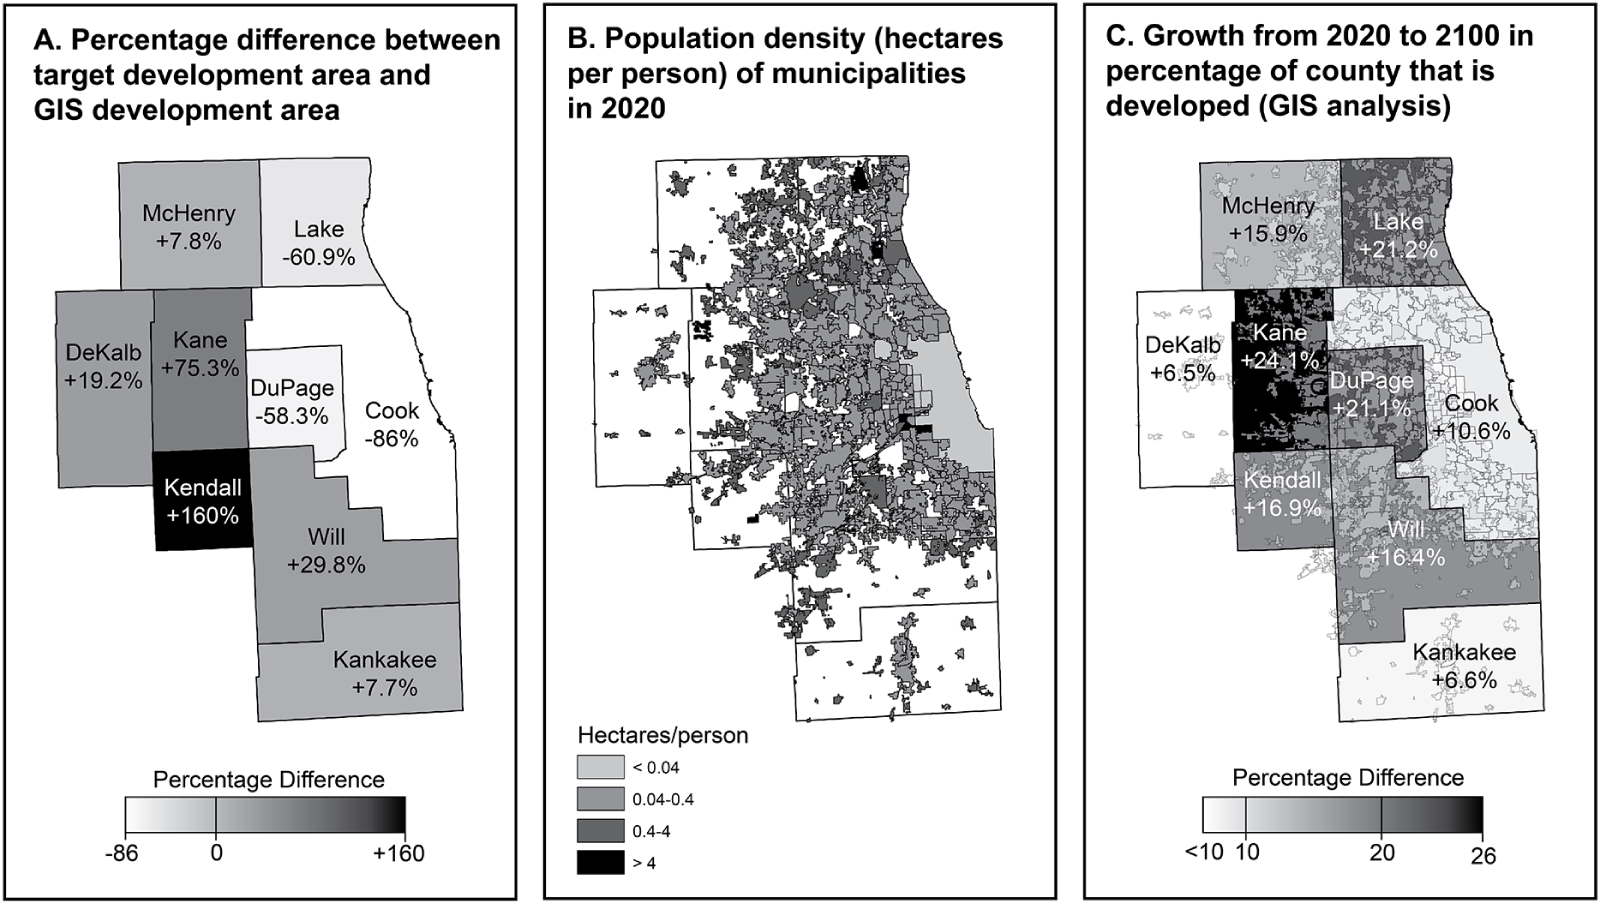
This issue of constrained expansion is illustrated by data from nine contiguous counties in the Chicago metropolitan area (Figure 6; Supplementary Material 2). These counties contain two-thirds of Illinois’s total population of 12.8 million, with Cook County alone accounting for almost 5.3 million people. In the 1.0% APGR scenario, we project the population of Cook County to grow by about 11.6 million—growth that would result in over 182,000 ha of new development in the simple mathematical model. Although Cook County encompasses more than 400,000 ha, only about 31,000 ha are not currently part of a municipal area. Expansion is also constrained by the shoreline of Lake Michigan. This results in less new development in the GIS analysis in Cook County and other highly developed counties (i.e., DuPage and Lake) than is projected by mathematical modeling (Figure 6a). Although some population growth in Cook County could be absorbed by increasing the population density (e.g., building more multistory housing), population densities in the core of the Chicago metro area are already very high (Figure 6b). Ultimately, it is likely that the less-developed areas adjacent to Cook, DuPage, and Lake Counties will experience the greatest changes in land use in the coming century, losing over 20% of their remaining undeveloped area (Figure 6c). The GIS analysis captures some of this effect as large urban areas grow across county lines into open areas of adjacent counties (e.g., see Kendall County in Figure 5). The amount of developed area in our GIS analysis increased in these counties by a larger factor than would be expected based on their 2020 populations alone but not enough to accommodate all the projected population growth in highly developed neighboring areas. This issue is factored into our final projections below.
Maps of northeast Illinois showing (A) the difference between target development area and development area modeled in GIS, (B) population density of municipalities in 2020, and (C) growth in the percentage of counties covered by urban area from 2020 to 2100 in our GIS analysis.

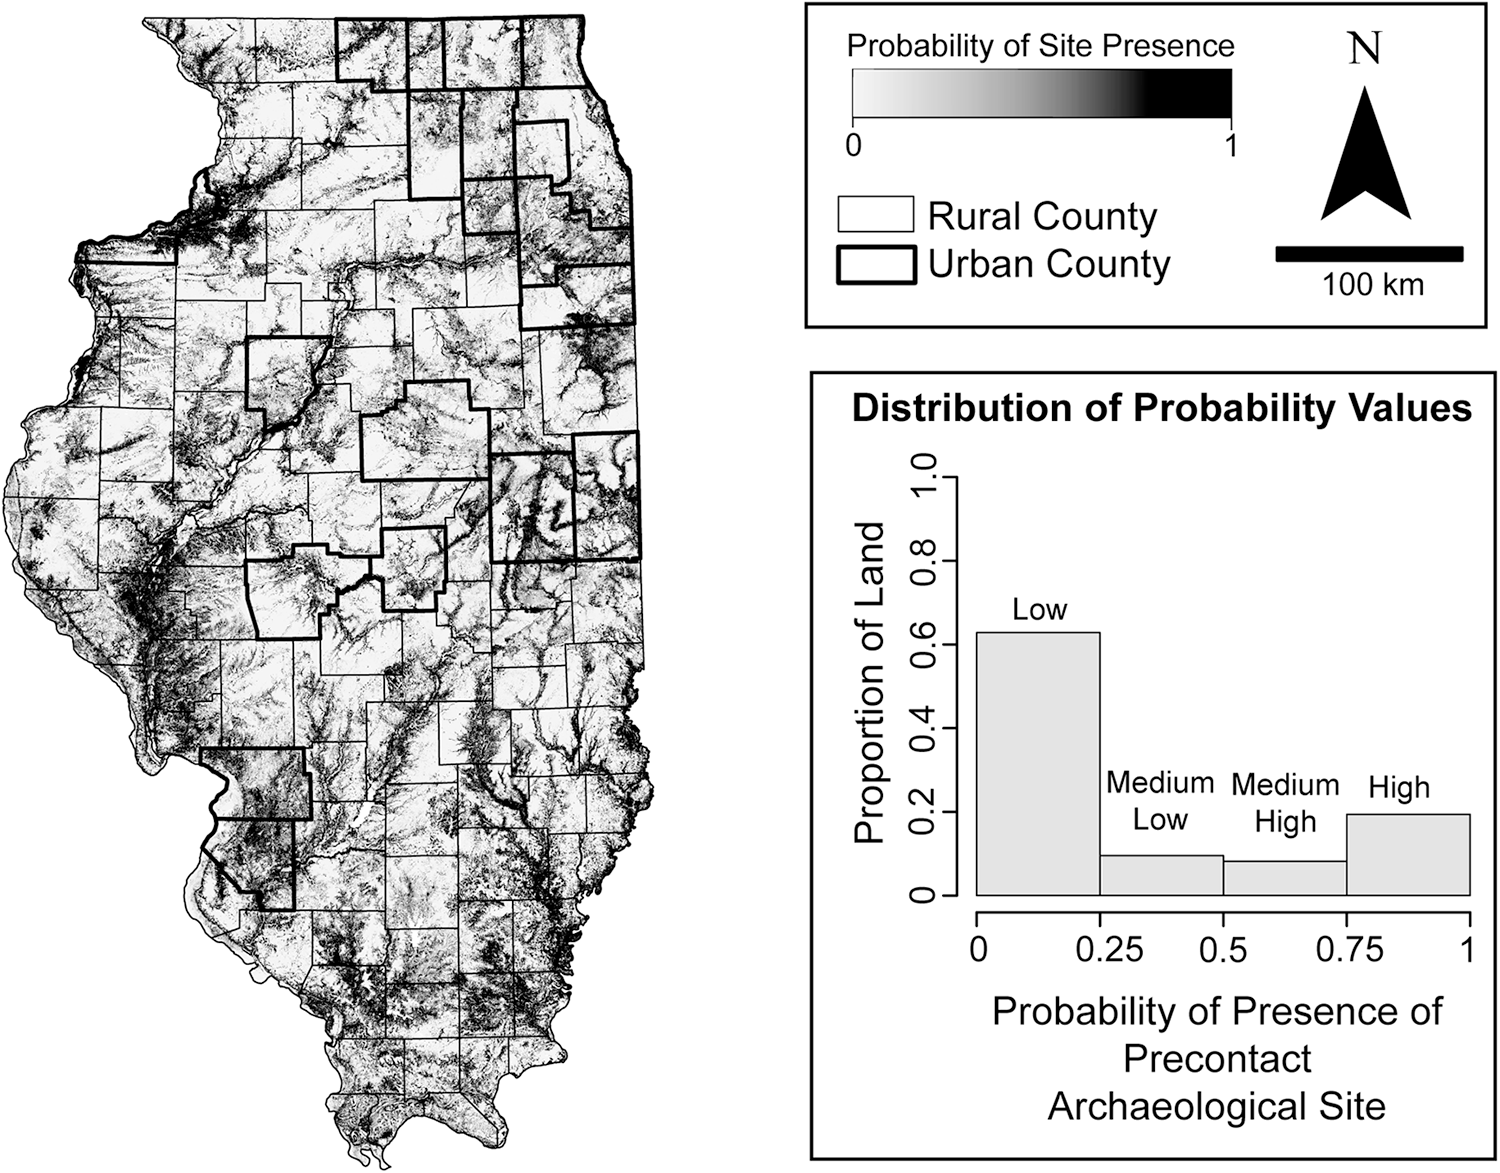
Information from the IAPM and the IIAS were coupled with the GIS analysis to produce site impact estimates. The IAPM (Lambert Reference Lambert2025) is a predictive model that is built on a TensorFlow neural network (Abadi et al. Reference Abadi, Agarwal, Barham, Brevdo, Chen, Citro and Corrado2015) in R using the Keras package (Kalinowski et al. Reference Kalinowski, Falbel, Allaire, Chollet, Tang, Bijl, Studer and Keydana2024). It uses the locations of known precontact archaeological sites, an equal number of randomly selected nonsite locations, and a suite of 15 environmental and geophysical variables to predict the probability (from 0 to 1) of encountering a precontact site in any given 90 × 90 m cell across Illinois. In the February 2025 version of the IAPM, areas of high probability (where the predicted chance of encountering a precontact site is over 50%) cover 27% of the land in Illinois and hit 72% of test sites (Figure 8).
A commonly employed measure of predictive model performance is Kvamme’s Gain statistic (Kvamme Reference Kvamme, Judge and Sebastian1988):
 \begin{equation*}\text{Gain}=1-(\%\,\,\text{area predicted}\,\,/\%\,\,\text{sites predicted})\end{equation*}
This statistic describes the increase in performance of a predictive model relative to chance: gain is positive when a model performs better than chance alone, and it is negative when it performs worse than chance. By chance alone, for example, we would expect 25% of a given area to contain 25% of sites—a gain of 0. The IAPM has a gain of 0.625 (1 − [0.27/0.72]), indicating that the model significantly outperforms chance and is a good predictor of precontact site locations.
Site Impact Projections
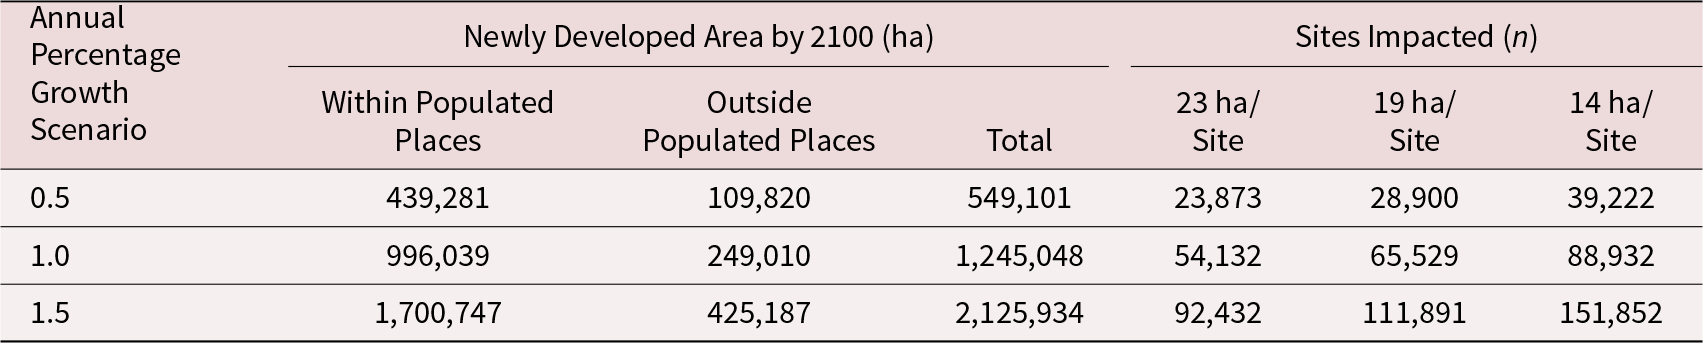
Mathematical projections of development related to population growth can be used to generate estimates of the number of precontact archaeological sites that will be impacted by the three APGR scenarios (Table 2). To arrive at total estimates of the amount of developed area, the development within populated places was multiplied by 1.25 to account for a quarter of development occurring outside of populated places. We chose 25% for this variable because it falls about midway between the 18% suggested by recent GIS data and the 30% suggested by simple subtraction (see above). Table 2 provides estimates of the total number of sites impacted assuming high (one site per 14 ha), medium (one site per 19 ha), and low (one site per 23 acres) site densities. The APGR and site-density assumption make an enormous difference: site impacts are over six times higher under the “high growth, high site density” conditions (about 150,000 sites) than in the “low growth, low site density” situation (about 24,000 sites).
Estimates of Number of Precontact Sites in Illinois Impacted by Development by the Year 2100 Based on Mathematical Modeling of Population Growth and Site Density.

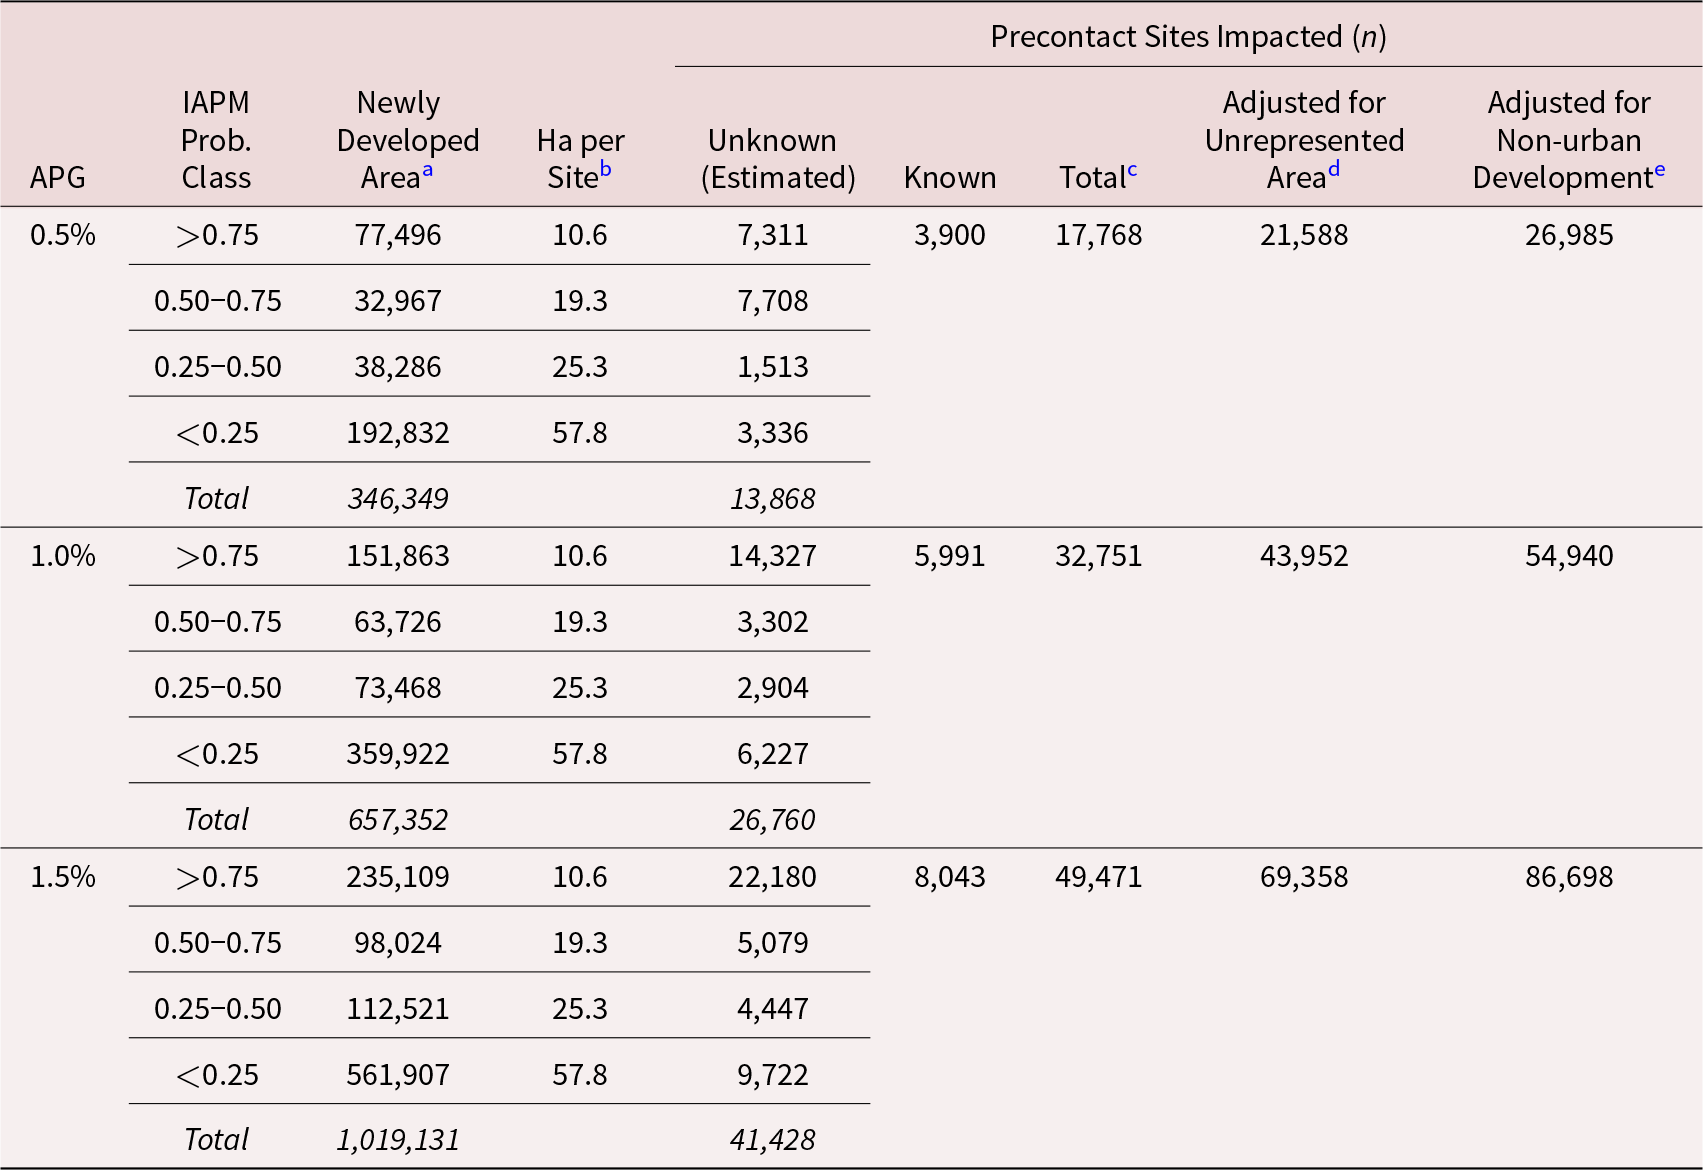
The estimates generated by mathematical modeling do not consider the spatial distribution of sites in Illinois, which is not random with respect to the overall landscape or to urban counties (see Figure 7). To factor that in, the newly developed areas from the GIS modeling were overlaid on the spatial distribution of predicted site probability from the IAPM (Table 3). The significance of population growth rate is evident: the total number of sites (including both documented and unknown) impacted in the 1.5% APGR scenario is about 2.8 times higher than in the 0.5% APGR scenario.
Map and associated histogram showing the distribution of predicted precontact site-probability values from the IAPM and rural versus urban counties.

Estimated Number of Precontact Sites Impacted by Development of Populated Places Based on GIS Analysis.

a Total developed area includes some NULL cells in IAPM where predictions could not be made due to missing data in input layers.
b Hectares/site calculated within surveyed areas.
c Sum of “Unknown” and “Known” sites impacted.
d Total number of sites impacted multiplied by the percentage of unrepresented area in the last column of Table 1.
e Calculated as “Adjusted for Unrepresented Area” × 1.25 to account for development outside of urban areas.
The last two columns of Table 3 adjust the GIS site-impact estimates to account for (1) the underrepresentation of developed area relative to the mathematical modeling and (2) development outside of populated places (which we estimated at about 25%). When these adjustments are made, the final GIS estimates of the number of sites impacted is similar to those of the low site-density (one site per 23 ha) conditions in the mathematical model.
The spatial and nonspatial approaches indicate that over 23,000 precontact sites will be impacted in the 0.5% APGR scenario, and 86,000 or more sites will be impacted at a 1.5% APGR. There is close agreement that a 1% APGR scenario will impact about 55,000 sites by the year 2100. Based on the ratio of documented to undocumented sites suggested by the GIS analysis (Table 3), we project that only about 10,000 of those sites have been documented thus far. Nearly half the sites (about 24,000) will be in roughly 255,000 ha of high-probability area identified by the IAPM. The number of precontact sites that will be impacted by development in a 1% APGR scenario over the next 80 years is comparable to the total number of precontact sites (57,838) that have been recorded by archaeologists in Illinois to date. Destruction of 55,000 sites would entail loss of about 5%–9% of the entire archaeological record of the state.
Discussion
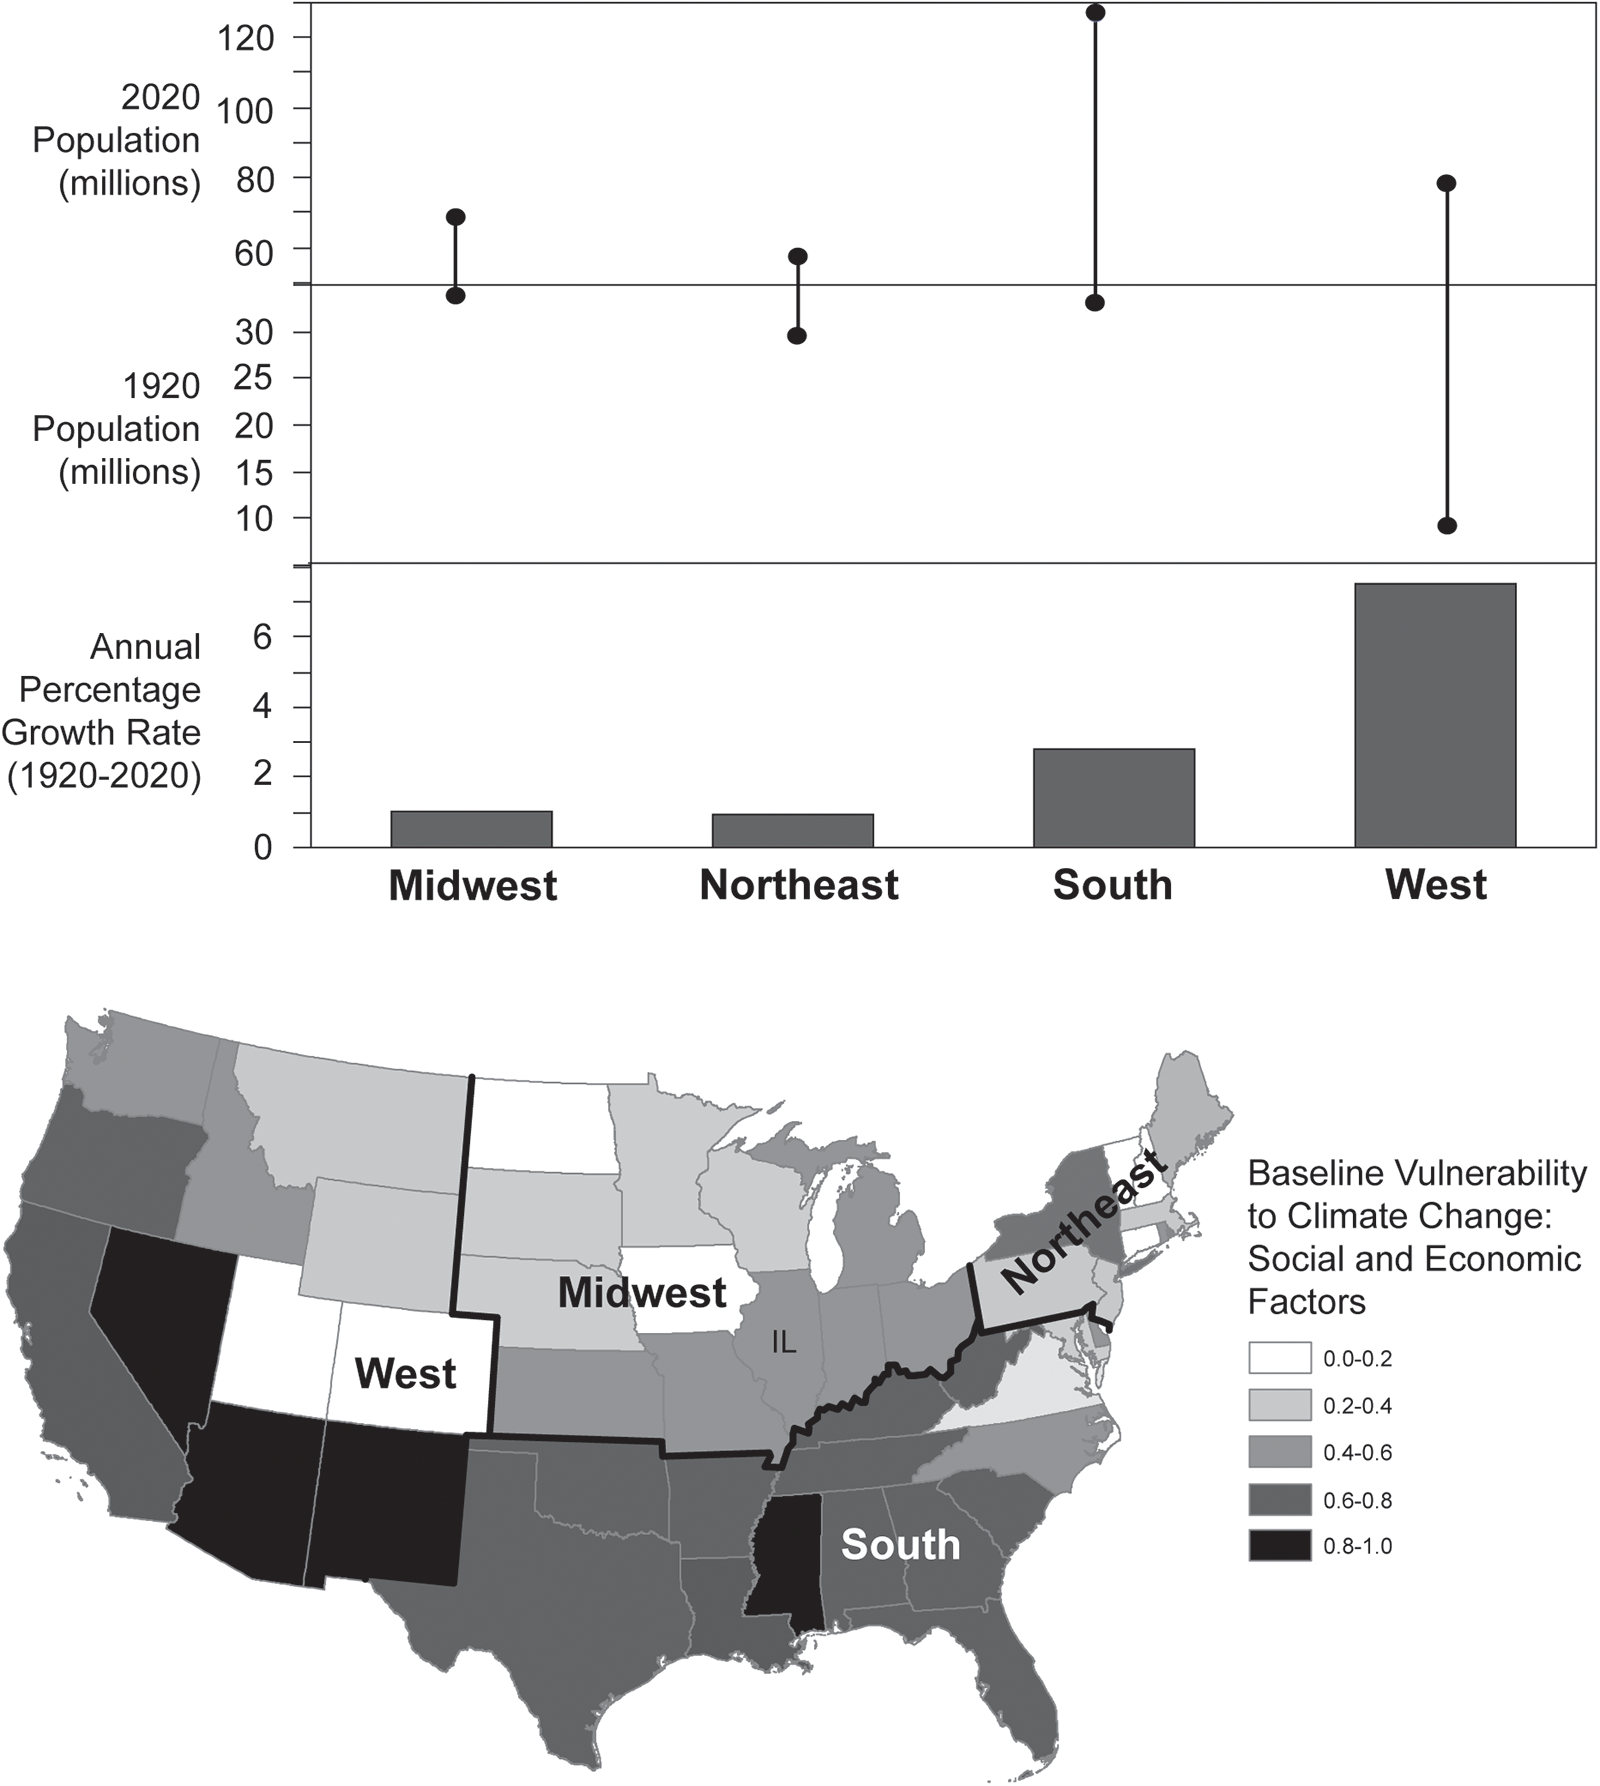
Over the last century, the US population more than tripled—from about 106 million in 1920 to over 331 million in 2020, which is an annual growth rate of about 2.1%. This growth was not evenly distributed across the country (Figure 8, top). Whereas the Midwest and Northeast regions grew at around 1% annually, the South and the West grew much more rapidly (2.8% and 7.5% annually, respectively). The United States Census Bureau (2023c) projects that the US population will peak at 370 million in 2080, growing at an annual rate of 0.19% between 2020 and 2080.
(Top) Change in population and annual growth rate between 1920 and 2020 in the Midwest, Northeast, South, and West regions of the United States (data from United States Census Bureau 2021); (bottom) climate vulnerability of states in these regions by social and economic factors (base map data from Tee Lewis et al. Reference Tee Lewis, Chiu, Nasser, Proville, Barone, Danforth, Kim, Prozzi and Craft2023).

Most of the Midwest and Northeast—the two regions with the slowest population growth over the last century—rank significantly lower in terms of vulnerability to climate change than most of the South and significant parts of the West (see Figure 8, bottom). Much of Illinois ranks in the bottom half of the distribution of social, economic, health, and environmental factors in the Climate Vulnerability Index (Environmental Defense Fund 2025; Tee Lewis et al. Reference Tee Lewis, Chiu, Nasser, Proville, Barone, Danforth, Kim, Prozzi and Craft2023), whereas much of the South ranks in the top half, supporting the idea that Illinois is likely to be attractive to populations on the move if internal migration plays an important role in adaptation to climate change within the United States.
These statistics provide some context for our discussion of projected impacts. An APGR of 1.0% would represent a continuation of the historical trend for the Midwest over the last century. If the United States Census Bureau (2023c) projection is accurate, overall growth in the United States may slow in the future. Even with an overall APGR below 0.5% for the nation, however, much higher growth rates are possible in areas that experience net positive internal migration. It is internal migration that has driven recent annual population growth above 1.5% in southern states such as South Carolina, Florida, and Texas (Biernacka-Lievestro and Fall Reference Biernacka-Lievestro and Fall2024; United States Census Bureau 2024).
Migration-driven population increase in some states is fed by migration-driven population loss in others. Recent data (United States Census Bureau 2024) show that Illinois has gained population since 2022, following a decade of declines. If climate change leads to the emergence of patterns of internal migration that favor the Midwest, parts of Illinois could plausibly experience annual growth rates over 1.5% in the coming decades. Unexpected climate or political events could dramatically and rapidly change the dynamics of internal migration in the United States.
Development and its resultant impacts will not be distributed evenly across the state. Our modeling efforts assumed a kind of preferential attachment process, where new population was attracted to municipalities in proportion to the population size of the municipality. Although this is a reasonable assumption to make to represent the aggregate results of migration, it is worth noting that it does not allow for long-term shifts in settlement behaviors that could emerge because of climate change or other factors, and it does not attempt to model the numerous social, cultural, political, and economic factors that influence individual- and family-level decisions about migration (e.g., see Adams and Kay Reference Adams and Kay2019; Rahmati and Tularam Reference Rahmati and Tularam2017; Suarez and Muneepeerakul Reference Suarez and Muneepeerakul2022).
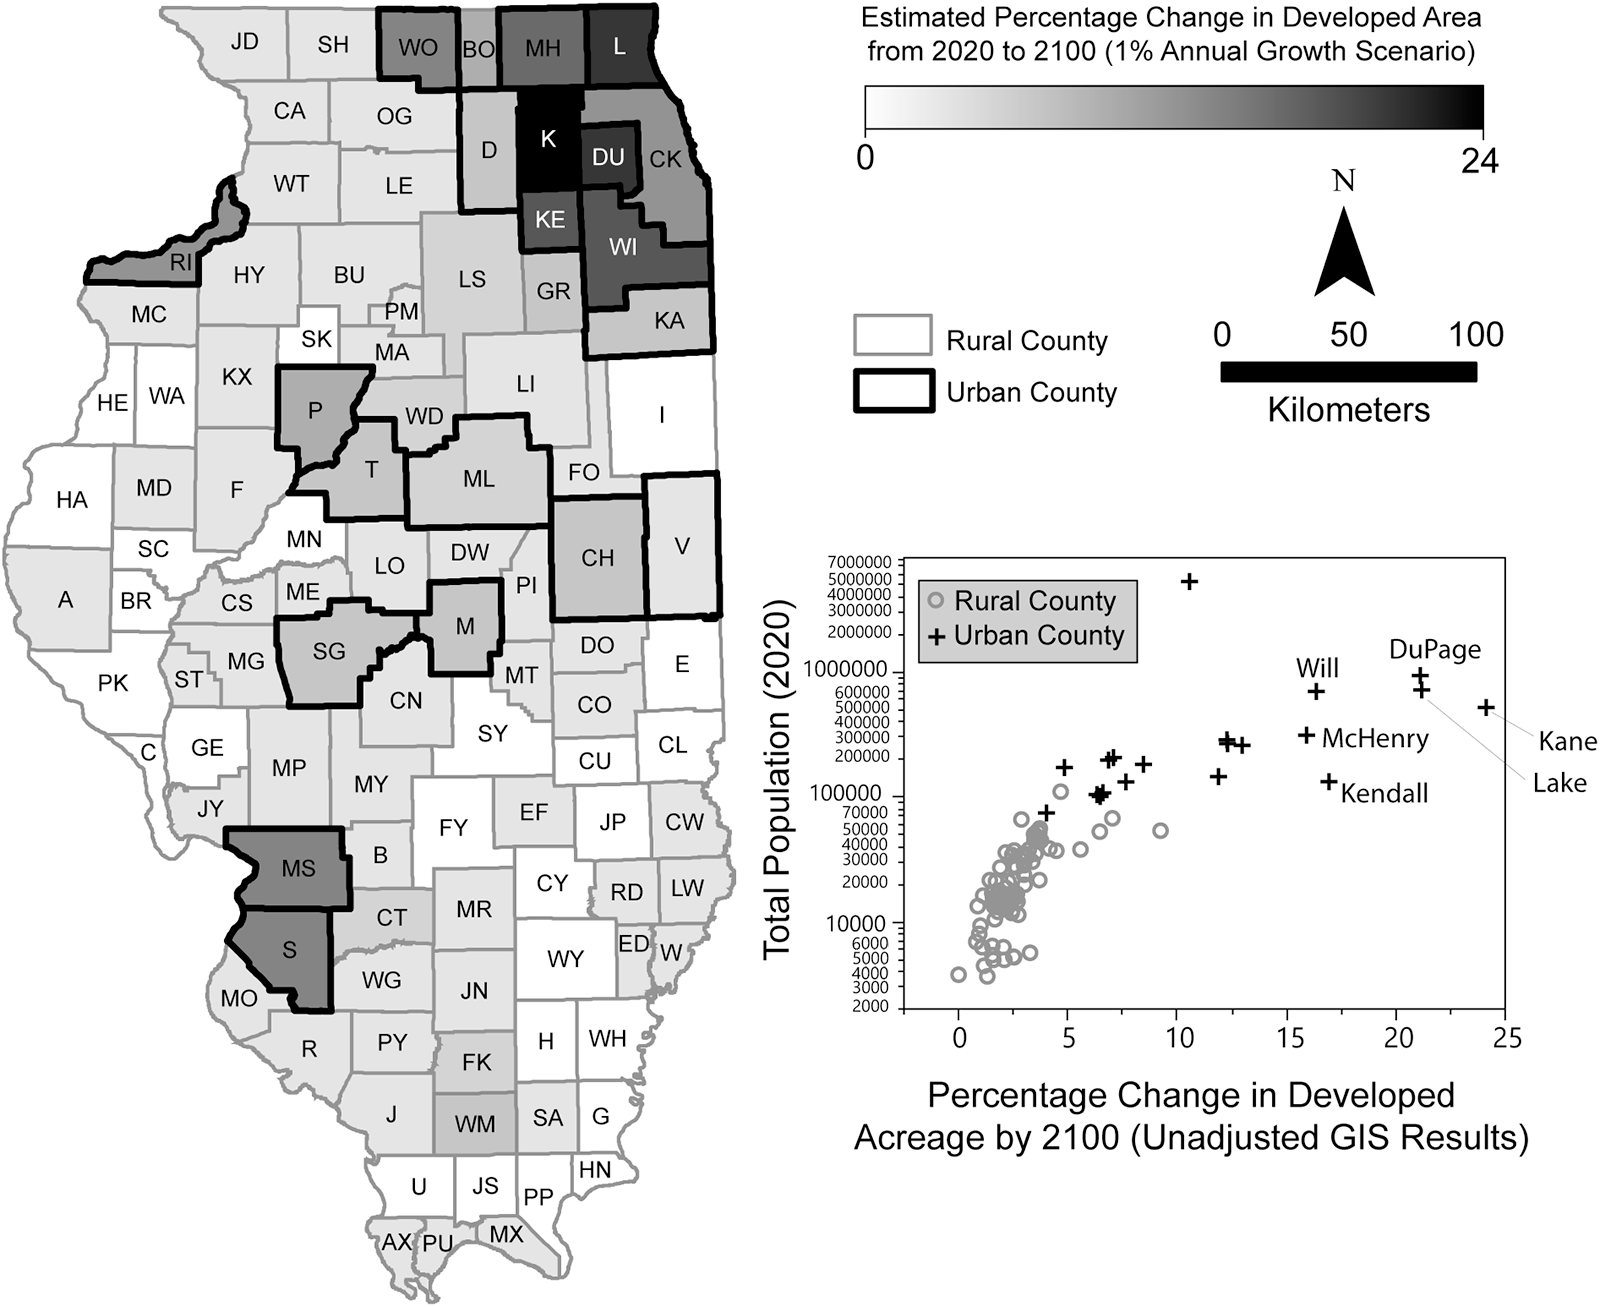
In the near term, we anticipate that new development in Illinois will be concentrated in and around the most densely populated areas of the state. The GIS results (not adjusted for unrepresented development area or development outside of municipalities) show the largest changes in developed area in Illinois’s urban counties (see Figure 9). DuPage, Kane, and Lake Counties, which border the Chicago metropolitan area, experience over 20% projected increases in developed areas. The changes would have been even higher in these and nearby counties if the GIS analysis was able to systematically channel excess population out of “landlocked” municipalities when further spatial expansion was impossible.
Map showing modeled percentage change in developed area from 2020 to 2100 under the 1% APGR scenario and scatterplot showing the relationship between total population in 2020 and percentage change in developed area by 2100 (unadjusted GIS results).

Our development projections agree broadly with those of Xie et alia (Reference Xie, Hunter, Sorensen, Nogeire-McRae, Murphy, Suraci, Lischka and Lark2023:Table S1), who projected that between 96,300 and 181,700 ha (238,000 and 449,000 acres) of farmland in Illinois will be converted to urban use by 2040 (i.e., within the next 15 years). Multiplying the high figure of 181,700 ha (449,000 acres) by four to allow for continued development at the same pace until the year 2100 yields an estimate of about 726,815 ha (1,796,000 acres), a figure falling between the newly developed area totals we calculated in our 0.5% and 1.0% APGR scenarios (see Table 2).
It is important to note that development will occur in Illinois even if the population does not grow at all. Between 1990 and 2024, the Illinois State Archaeological Survey (ISAS) performed between 62 and 263 compliance-related archaeological surveys per year, with an average of about 150. Although the number of surveys correlates somewhat with changes in state population, archaeological work associated with development occurred even in years of population decline. The same is true when non-ISAS surveys in the state are included (combined range of 354–1,262 per year, mean of 640).
Consequently, we suggest that projections for development-related impacts to 55,000 precontact archaeological sites in Illinois (in a 1% APGR scenario) should be considered a baseline case. Potential impacts will increase from this baseline if growth is greater: each additional tenth of a percent in annual growth will put thousands of additional sites at risk through redevelopment within existing cities and towns, expansion through new development, and construction of new infrastructure. Much of the development in Illinois will occur beyond the jurisdiction of federal (e.g., National Historic Preservation Act of 1966, aka Section 106) and state (e.g., Illinois State Agency Historic Resources Preservation Act, aka Section 707) laws protecting heritage resources; however, associated infrastructure projects, such as roads and utilities funded in part by federal and state resources, often do fall within the purview of these laws. Ideally, all interested parties (e.g., policymakers, planners, rightsholders, scientists, and the concerned public) will develop practices to mitigate development impacts.
Development-related impacts to archaeological sites in Illinois are part of a global pattern that is being amplified by the addition of climate change to ongoing trends of population increase and urbanization. Much of the expected growth in world population that will occur by 2100 (United Nations 2024) will be associated with cities, spurring continued development in and around growing urban areas.
Just as in our Illinois example, we expect that development-related impacts to heritage resources will not be spread randomly or evenly across the landscape of the world; they will be concentrated in “hot spots” that will continue to expand spatially at their margins as a mechanism to accommodate new population. These hot spots are forecast to emerge as early as 2030 and to intensify by 2050 (Clement et al. Reference Clement, Rigaud, de Sherbinin, Jones, Adamo, Schewe, Sadiq and Shabahat2021:xxiv). Expansion of these urban areas will inflict significant damage, given that many of the large cities in the world are in areas rich in archaeological sites. Although it is difficult to quantify the number of archaeological sites that could be damaged or destroyed by development as Earth’s population peaks and climate change encourages massive resettlement, we can make some preliminary estimates based on recent changes in global patterns of land use.
Out of the Earth’s total land area of about 149 million km2, about 107 million km2 are classified by the UN as “habitable” because they are neither barren (e.g., salt flats or desert) nor covered by glaciers (Food and Agriculture Organization of the United Nations [FAO] 2024). Recent estimates of the amount of land that is “urban” vary substantially—from about 281,000 km2 (less than 1% of habitable land) to 3.5 million km2 (3.3% of habitable land; see Liu et al. Reference Liu, He, Zhou and Wu2014:Table 1). Much of this variability is attributable to differences in how “urban” is defined: some studies count administrative areas as “urban,” whereas others identify “built up areas” or “artificial surfaces,” and still others rely on nighttime light data (Liu et al. Reference Liu, He, Zhou and Wu2014).
With these inconsistencies in mind, we can consider aggregate annual global rates at which nonurban land is being converted to urban land using longitudinal datasets. Unsurprisingly (see Liu et al. Reference Liu, He, Zhou and Wu2014), the lowest estimate of 486,000 ha of land converted annually comes from “artificial surfaces” data (FAO 2024), with the “built up area” data from the 2023 HYDE 3.3 dataset (Goldewijk et al. Reference Goldewijk, Beusen, Doelman and Stehfest2017) about three times higher. The highest estimate (2 million ha annually) comes from nighttime light data (Center for International Earth Science Information Network 2013). It is logical that significant ground disturbance associated with increasing human population exceeds the “artificial surfaces” estimate but is probably less than the area indicated by nighttime light data. A conversion of 0.8–1.6 million ha of land (8,000–16,000 km2) per year globally seems reasonable and is consistent with the “built up area” estimate (see Goldewijk et al. Reference Goldewijk, Beusen, Doelman and Stehfest2017).
Using a rate of land conversion to estimate how many archaeological sites will be destroyed worldwide in the coming decades requires estimating a global average site density—clearly a difficult task for several reasons. First, we know that site densities vary dramatically by region because of factors such as environment and occupational history, and we are lacking robust survey data from many parts of the world from which to extrapolate site densities. Second, the definition of a “site” varies so widely in different parts of the world and among different researchers that it is difficult to contextualize systematic survey data even when it is available.
In our Illinois example, mean site density for the entire state was about 4.35 sites/km2 (one site per 23 ha). Site densities between one and 10 sites/km2 have commonly been reported from systematic pedestrian surveys of large project areas in a wide range of environments in different parts of the world (e.g., Biella and Chapman Reference Biella and Chapman1977; Eddy et al. Reference Eddy, Oberlin and Farmer1984; Harrower et al. Reference Harrower, Nathan, Dumitru, Lehner, Paulsen, Dollarhide and Wiig2022; Honeychurch et al. Reference Honeychurch, Wright and Amartuvshin2007; Mauldin and Nickels Reference Mauldin and Nickels2001; O’Brien et al. Reference O’Brien, Robert, Warren and Dennis1982; Sobotková et al. Reference Sobotková, Ross, Nehrizov and Weissová2010). Site densities under one site/km2 are also reported (e.g., Algaze et al. Reference Algaze, Hammer, Parker, Breuninger and Knudstad2012; Bashir et al. Reference Bashir, Mamoon and Khaleel2021; King and Higelin Ponce de León Reference Goldewijk, Beusen, Doelman and Stehfest2017; Palmisano et al. Reference Palmisano, Bevan and Shennan2017; Ur et al. Reference Ur, Babakr, Palermo, Creamer, Soroush, Ramand and Nováček2021) as are much higher densities approaching 20 sites/km2 (e.g., Banaszek et al. Reference Banaszek, Cowley and Middleton2018; Fish and Gresham Reference Fish, Gresham, Fish and Kowalewski1990). These high densities seem to be attributable at least in part to studies that include counts of individual features (e.g., individual mounds within clusters) in site totals or a high degree of “splitting” when defining site boundaries.
As a starting point, if we assume a mean global site density of five sites/km2 (i.e., slightly higher than recorded for Illinois) and a land conversion rate of 14,570 km2/year (i.e., ∼1.5 million ha/year, as suggested by the HYDE 2023 “built up area” data), we can conjecture that the world will lose almost 73,000 sites per year to development. At that rate, about 5.5 million sites would be impacted by development by the year 2100, which amounts to about 1% of the entire archaeological record of the planet. Factors such as sea-level rise, flooding, wildfires, and drought will contribute to the dynamics of migration, urbanization, and development, and they have their own impacts on heritage resources.
This figure of a 1% site loss over the next 80 years is significantly lower than that which we forecast for Illinois (about 5%–9%). The main reason for this is that our informal calculation for the world assumes that the distributions of archaeological sites and modern urban areas are independent of one another. Archaeological sites are not evenly distributed across the Earth’s habitable land, however, and many expanding urban areas are in archaeologically rich regions that have supported intensive human settlement for millennia and where site densities are often locally much higher than five sites/km2.
Worldwide, the development-related impacts to archaeological sites are likely to be much more severe than a 1% loss, probably comparable to the Illinois example of 5%–9% or greater. Although Illinois has a denser population (84 persons/km2) than the world on average (75 persons/km2), it is much less densely populated than some areas of the world (e.g., China at 147 persons/km2, Nigeria at 257 persons/km2, and India at 430 persons/km2). Like much of the United States, Illinois is farther along a path of urbanization than the world on average (see United Nations 2019; United Nations World Urbanization Prospects 2024); about 11.9% of Illinois land has been developed compared to about 3% of global land. As populations continue to concentrate in many already crowded areas around the world, we can expect significant damage to archaeological sites that are adjacent to these expanding urban areas. Site densities in many of these areas, located in prime locations for past human habitation, are likely to be much higher than the global average and certainly much higher than in Illinois.
Conclusion
Population growth, urbanization, and climate change pose a significant threat to archaeological resources around the world. Our analysis of the situation in Illinois suggests that population growth over the next 80 years could cause a loss of about 5%–9% of the entire archaeological record of the state. Even in conservative scenarios, development threatens to impact a quantity of sites comparable to the total number that professional archaeologists have documented in the state to date. Only in rare circumstances (e.g., Emerson et al. Reference Emerson, Koldehoff and Brennan2018) do the fragile sites of the Eastern Woodlands survive intensive development. The most common outcome is complete destruction.
On a global scale, the world stands to lose, minimally, tens of thousands of sites per year to development, probably totaling in the millions by the year 2100. Site destruction will probably be most intense at the edges of rapidly expanding urban areas, and the scale of internal climate migration will be largest in the poorest regions of the world (Clement et al. Reference Clement, Rigaud, de Sherbinin, Jones, Adamo, Schewe, Sadiq and Shabahat2021:xxii). The UN hopes to be able to identify “hot spots” for climate-related migration by 2030 and anticipates that much of the population growth in these areas will occur by 2050 (Clement et al. Reference Clement, Rigaud, de Sherbinin, Jones, Adamo, Schewe, Sadiq and Shabahat2021).
The common pattern of threats posed by development and climate change will have to be understood and addressed on a case-by-case basis in the context of local, regional, and national circumstances. In Illinois, we have taken a first step of trying to identify and understand the threats that climate change poses to heritage resources (Aiuvalasit et al. Reference Aiuvalasit, Lambert, Pauketat and Andrew2024). Operationalizing a strategy for mitigating development-related damage will require developing ways to identify and deal with vulnerable sites in the path of development before it is too late. Our work suggests the best ratio of cost to benefit will involve focusing survey efforts on the edges of expanding municipalities in “urban” counties where rapid population growth intersects with areas of high site probability. Improvements to our modeling and coordination with experts in urban planning, growth management, landscape architecture, and other disciplines will be invaluable.
Operationalizing a strategy such as this in Illinois will be challenging. Doing something similar in other parts of the world may seem, on its face, impossible. It will be necessary to (1) understand the particularities of the archaeological record (types of sites as well as their density and distribution), (2) develop a fine-grained consideration of where and how urban areas are expanding, and (3) navigate relevant regulations, cultures, and customs to craft and execute effective strategies to mitigate the damage. If we are to make evidence-based recommendations about the best course of action, archaeologists and other heritage managers need to take an active role in outlining strategies (e.g., Hambrecht and Rockman Reference Hambrecht and Rockman2017; Rockman Reference Rockman2024; Rockman et al. Reference Rockman, Morgan, Ziaja, Hambrecht and Meadow2016) that blend science with effective communication, conveying both the scale of the threat to archaeological resources and the reasons they are worth saving.
Even after threatened sites are identified, it will not be possible to save all of them. Conflicting societal priorities and limited resources for the protection or mitigation of archaeological sites will necessitate hard choices about which sites to save and how to save them. Given this reality, objective strategies to assess the significance of particular heritage resources (e.g., Dawson et al. Reference Dawson, Hambly, Kelley, Lees and Miller2020; Heilen et al. Reference Heilen, Altschul and Lüth2018; Miller et al. Reference Miller, Emily Jane Murray, Kemp, Lee, Simmons-Jenkins, Cochran and Gaillard2024) are needed that consider site integrity, research potential compared to other regional sites, importance to descendant communities, the severity of risk, and what mitigation or site-preservation measures are feasible given available funding and the capacity of professionals and citizen scientists.
The loss of potential knowledge about the human past is sobering: a nontrivial percentage of the archaeological record of the world will vanish over the next several decades as the population of the Earth peaks and climate change amplifies the worldwide processes of urbanization that accelerated in the mid-twentieth century. If UN projections are correct, we have a window of about 25 years to plan and execute strategies to mitigate impacts before the damage is done. Although we are probably not missing any grand lost cities at this point, millions of less spectacular cultural sites are in danger in Illinois and throughout the world. These sites are an invaluable, irreplaceable resource for anybody—most certainly archaeologists—interested in telling the stories of the human past and answering questions about the daily lives of the people that called our planet home for millennia.
Acknowledgments
This research was supported by the Illinois State Archaeological Survey and the Prairie Research Institute. The authors thank Tim Pauketat for the direction he provided to begin thinking about the impacts that climate change will have on heritage resources in Illinois and beyond. We thank Michael Aiuvalasit for his role in organizing and promoting climate-related research at ISAS. We are also grateful for helpful discussions with and encouragement from Trent Ford (Illinois State Climatologist); The Archaeological Conservancy; and Sarah Miller, David Anderson, and other members of North American Heritage at Risk (NAHAR). The comments of three anonymous reviewers helped make this article stronger. Thanks to Mariana Seda for help with Spanish translation of the abstract.
Funding statement
This research received no specific grant funding from any funding agency.
Data Availability Statement
Land-use and population data used in this research were collected from publicly available sources as cited in the text. Non-site-specific results of the IAPM are publicly available online (https://go.isas.illinois.edu/IAPM). Data pertaining to analytical results are available as supplemental files (see Supplementary Material section) and at https://doi.org/10.13012/B2IDB-6829928_V1.
Competing Interests
The authors declare none.
Supplementary Material
The supplementary material for this article can be found at https://doi.org/10.1017/aaq.2025.10145.
Supplementary Material 1. Mathematical Modeling Results by Populated Place (table).
Supplementary Material 2. GIS Developed Area Projections by County (table).