1. INTRODUCTION
Like the rest of the world, Spain has suffered frequent financial crises. In Spain, the Great Depression of 1929 had a relatively lower impact than in other countriesFootnote 1 , and the most interventionist period in terms of regulation (1945-1972) recorded the lowest crisis frequency; in fact, there were no banking crises during these years. By contrast, in 1976 Spain suffered a triple crisis (currency, banking and stock market). It was the most severe crisis in Spanish financial history and is considered one of the «Big Five» crises in terms of severity according to Reinhart and Rogoff (Reference Reinhart and Rogoff2008). It was also associated with a recession, and as Bordo et al. (Reference Bordo, Eichengreen, Klingebiel and Martínez-Peria2001) point out, recessions associated with crises are more severe than recessions that are not. In 2008, Spain again suffered a banking crisis followed by a recession, with rapid deterioration in the Spanish fiscal position (sovereign debt crisis) and a worsening of the main macroeconomic indicators. There was also a significant fall in the stock market index, and the euro suffered serious tensions and even faced an existential threat.
The main purpose of this paper is to compare the two great banking crises in Spanish history and identify the main parallels between them. Is the current crisis as severe as that of 1976? What are the main differences in relation to the impact on the banking industry and the financial sector? We have estimated the macroeconomic impact of the two events and also the output gap and output loss for each. We show that, compared with the 1976 crisis, the 2008 crisis has had a lesser but similar impact in terms of output gap and an equivalent impact in terms of output loss. However, taking into account the macroeconomic impact of the two events, in terms of the decline in GDP, manufacturing production and unemployment, we conclude that the 1976 crisis was surpassed by that of 2008.
Moreover, we analyse the financial impact of the two crises in terms of banking assets, credit growth and other financial indicators, which also confirms the greater severity of the 2008 crisis. Finally, we offer some estimates of their fiscal cost. The aim of this paper is, therefore, to analyse the recent Spanish crisis in comparison with that of 1976 by contrasting the evolution of some key variables in the two events and exploring the reasons behind the great impact of these two crises on the Spanish economic and financial system.
2. THE MAIN PARALLELS BETWEEN THE 1976/1977 AND THE 2008 CRISES
There are a number of parallels between the origins of the 1976/1977 and 2008 crises. External shocks occurred in the years leading up to both crises: the 1973 oil crisis and the 2007 bursting of the U.S. housing bubble with the resulting subprime mortgage crisis. In both cases the crises began later in Spain than in many OECD countries, but their effects in Spain were more pronounced than elsewhere in Western Europe. In Spain, the earlier crisis did not impact until 1976; this was a consequence of the measures introduced by the Franco government and the first government of the democracy to «camouflage» the crisis (Betrán et al. Reference Berges, Ontiveros and Valero2010). The 2008 crisis began later than in other countries for two reasons. First, Spanish banks were very well provisioned thanks to a regulation passed in July 2000 and second, unlike the rest of the world, they were not contaminated by the so-called toxic financial derivative products linked to subprime mortgages (Maudos Reference Maudos2010)Footnote 2 .
In both cases the Spanish economy accumulated high imbalances following a period of rapid growth. From the end of the 1950s, and especially in the 1960s, Spain registered exceptional growth; whereas the average real rate of GDP growth for an average of twelve European countries from 1959 to 1975 was 4.16 per cent, in Spain it was 6.9 per cent. Something similar happened in the pre-2008 crisis years: whereas the average growth rate for fifteen European countries was 2.3 per cent from 1995 to 2008, in Spain it was 3.7 per cent, with comparable results over the shorter period, 2000-2008Footnote 3 .
2.1. Main Pre-Crisis Imbalances
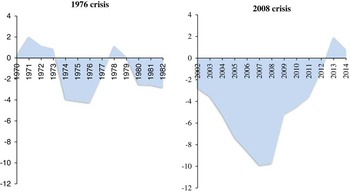
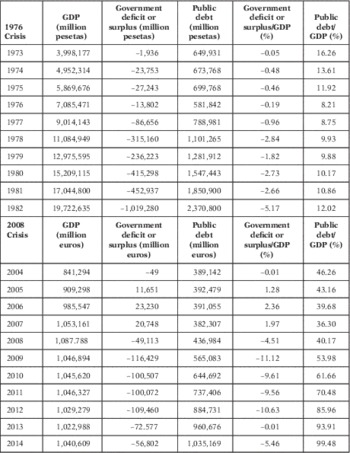
The main imbalances in the 1976 crisis were huge current account deficits and public deficits. Economic growth during the 1960s was mainly based on domestic demand and increased the capital imports needed to maintain rapid industrialisation; the main result was an increase in trade deficits, which represented around −5.55 per cent of GDP between 1965 and 1973 (Tena Reference Tena2005). In this period, however, trade deficits were easily covered by the surplus in the services and transfers balances thanks to tourism revenues and migrant remittances. Between 1973 and 1975, a sharp rise in oil prices produced higher trade deficits which moreover, as a consequence of the international crisis, were not offset by the services and transfers balances, a situation which deteriorated the current account balance (see Figure 1). As a consequence of these financial difficulties, in 1975/1976 Spain received 689.32 million in Special Drawing Rights (SDR) from a special line created by the International Monetary Fund (IMF) to finance the massive international imbalances that had arisen as a result of the high oil prices; this amount was only surpassed by the United Kingdom and ItalyFootnote 4 . The government’s initial decision to absorb part of the rise in oil prices exacerbated the fiscal deficit that started in the mid-1960s, worsened in 1974, and from 1977 onwards drove the country into a fiscal crisis. As Table 1 shows, after the crisis the public deficit to GDP ratio increased to −2.84 per cent in 1978 and reached a peak in 1982 (−5.17 per cent). As a consequence of the fiscal crisis there was an increase in public debt issues although it never reached particularly high levels (around 10 per cent to 12 per cent of GDP in the post-crisis years, see Table 1).
CURRENT ACCOUNT BALANCE TO GDP (%) Sources: 1970-1982: Tena (Reference Tena2005) and 2002-2014: INE (several years,).

GOVERNMENT DEFICIT OR SURPLUS AND PUBLIC DEBT IN THE 1976 AND 2008 CRISES

Source: Comín (Reference Comín and Cuevas2017).
In the 2008 crisis, the main imbalances were the substantial current account deficit accumulated from the second half of the 1990s up to 2007 (Carballo-Cruz Reference Carballo-Cruz2011) and the high levels of private debt. The current account deficit was a result of a decline in competitiveness (Escrivá and Correa 2010) that coincided with joining the euro and capital globalisation (full capital liberalisation and increased confidence in Spain as part of the euro zone stimulated booms)Footnote 5 . Figure 1 shows the evolution of the current account-to-GDP ratio in the two crises; we observe a significant increase in the current account deficit in the years prior to the crises in both the 1976 and the 2008 crisis.
In addition to current account deficits there were also debt imbalances during the 2008 crisis. As mentioned, Spain experienced a long period of rapid growth in the years preceding the crises and in a context of capital globalisation with low interest rates and credit facilities, economic growth was accompanied by an increase in indebtedness (in 2007, Spanish private debt represented around 191.2 per cent of GDP, according to EUROSTAT several years), mainly foreign private debt (Maudos Reference Maudos2012)Footnote 6 . At the start of the crisis, Spain’s fiscal position was apparently excellent and the country did not have a public debt problem. It was only as a result of the crisis that the fiscal deficit rose (due to the recession, the banking sector intervention and social expenses), changing from a surplus of around 2 per cent of GDP in 2007 to a deficit peak of −11.12 in 2009 (see Table 1). Added to this was a debt crisis from 2009/2010, and the public debt to GDP ratio increased from 36.30 per cent in 2007 to 99.48 per cent in 2014 (Table 1). Therefore, the roots of 2008 crisis in Spain do not show a problem of fiscal profligacy leading to government deficits, but rather buoyant growth fuelled by domestic demand based on credit (Comín Reference Comín2012, Reference Comín2016).
2.2. Liberalisation, Deregulation and Globalisation
In both cases, in the build-up to the crisis there was a process of economic liberalisation and deregulation combined with the lack of an efficient banking supervision system. During the 1960s and early 1970s, there were many interventions in the Spanish financial system in terms of barriers to entry, interest rate controls, mandatory investment coefficients in government debt and in priority sectors, and branch expansion, among others (Pons 2001). In the prelude to the 1977/1978 crisis, the Spanish financial sector was dominated by two types of financial intermediaries: banks and saving banks. The Spanish banking system was highly concentrated; in 1975, 59.12 per cent of all deposits were in the hands of the «Big Five» banks (CR5)Footnote 7 (Fanjul and Maravall Reference Fanjul and Maravall1985). In addition to commercial banks, there was a group of non-profit saving institutions that were subject to regular interventions and were tightly regulated by the Spanish authorities through geographical limits on operations and high investment coefficientsFootnote 8 . The 1962 Banking Law expanded the field of operations open to saving banks — especially in terms of branch liberalisation — which allowed these financial institutions to increase their market share. Despite these reforms, it was not until 1977 that saving banks could really operate as banks.
There was a major boost to the liberalisation process in the mid-1970sFootnote 9 and the result of this was an increase in competition (Caminal et al. Reference Caminal, Gual and Vives1993; Salas and Saurina Reference Salas and Saurina2003). Two problems arose. On the one hand, banks were not used to operating in a competitive environment and, in this new context, their main reaction was to increase their focus on gaining market share. Many banks expanded their geographical and business areas leading to an increase in operational costs. On the other hand, the liberalisation process was not accompanied by the establishment of an efficient banking supervision system. Despite the fact that a regulatory regime certainly existed, the financial authorities lacked an adequate system of information and supervision. As Poveda (Reference Poveda2012) explains, the break-up of the banking status quo was insufficiently backed by appropriate prudential regulation and supervision; the minimum capital requirements imposed on new banks were insufficient, the criteria for granting banking licences included no assessment of their viability, and so on.
The liberalisation process and the increase in competition were also behind the 2008 banking crisis. From the 1990s up to 2007 the Spanish financial system underwent major transformations due to technological change, globalisation and European market integration. In this context, there was a parallel process of deregulation in order to encourage competition (which mainly allowed banks and savings banks to carry out the same operations) and reregulation (to implement prudential regulation and to adapt the Spanish financial system to conform to EU regulations). In the run-up to the 2008 crisis, the banking system was even more concentrated than it had been in the 1970s. Following the 1977 crisis, there was only a modest increase in banking concentration and it was not until after Spain’s entry into the European Economic Community in 1986 that there was a rapid process of banking concentration, with mergers between some of the main banks between 1991 and 1999Footnote 10 . Increased competition in the banking sector prompted a restructuring process through the merging and closing of branches and also through the greater presence of the larger banks in international markets, mainly in Latin America (Berges et al. 2012).
With respect to savings banks — which, as mentioned above, became banks in the operational sense in 1977 — the 1985 and 1988 regulations allowed these financial institutions to expand their regional limits and the regional governments assumed the function of controlling and supervising them (Comín Reference Comín2007, Reference Comín2008). These financial institutions were not unaware of the transformations of the financial system and, from 1991, there was a wave of mergers between saving banks, with support from the Saving Bank Deposit Guarantee Fund (Martín Aceña Reference Martín Aceña2013). For example, in 1991 the Caja de Ahorros y Monte de Piedad de Castellón merged with the Caja de Ahorros de Valencia to form the Caja de Ahorros de Valencia, Castellón y Valencia (Bancaja) Footnote 11 . In the same year, the saving banks of Ronda, Antequera, Málaga, Cádiz and Almeria merged to form Unicaja. By 2007, the saving banks held around half of the total Spanish market share.
The increase in competition had a negative effect on the banking interest marginFootnote 12 and the main reaction of financial intermediaries was to find new sources of business: commissions for the services rendered, reallocation of loan activities towards more profitable sectors, international expansion and so on (Saurina Reference Saurina2012). Savings banks that historically had a strong territorial connection, with their operations limited to within a specific territory, extended their geographic limits (especially from 1988) thanks to deregulation. For example, from 1992 to 2004 the number of savings bank branches in new territories increased by more than 300 per cent, whereas in the same period banks decreased their number of branches by 20 per cent (Cardenas Reference Cardenas2013). As mentioned, savings banks are non-profit entities with two categories of members on their board of directors: insiders (bank employees, depositors and private funders) and outsiders (regional politicians and public founders). For many of these savings banks, regional and local governments exercised considerable control over the way they were run, and a substantial percentage of board members were directly appointed by local and regional governmentsFootnote 13 . A conflict of interest then became apparent: regional governments supervised savings banks, but they also controlled them. In this context, the savings banks, limited by regulation (they did not have adequate mechanisms to increase their own resources) and by politicians, tried to gain market share through a policy of opening branches nationwide and by implementing a more aggressive and riskier lending policy, especially in the building sector (mortgages and loans to real estate developers). In many cases, savings banks became the owners of real estate development companies. The main problem in terms of regulation in the current crisis was, therefore, the failure to adapt savings bank regulation to a new framework characterised by a strong increase in competition and the influence of politicians on these financial intermediariesFootnote 14 .
The 1976/1977 and the 2008 crises were similar in terms of the large number of risky, unprofessional and even illegal banking practices. As mentioned above, bank managers in the 1970s were not used to operating in a competitive environment and many banks expanded into geographical and business areas of which they had little prior knowledge. Also, the industrial banks established after 1962 lacked expertise and qualified professionals. Moreover, there were cases of illegal banking practices, unwarranted risk concentration and imprudent management (Cuervo Reference Cuervo1988). Such practices were also present in the 2008 crisis, especially in savings banks (Cardenas Reference Cardenas2013; Pérez Díaz and Rodríguez Reference Pérez Díaz and Rodrígez2013).
2.3. Exchange Rate Regime
Another difference between the two crises was the exchange rate system, which is related to the ability to react to the crisis. In the 1970s, Spain was able to manipulate its exchange rate to improve competitiveness and promote its exports. In fact, the peseta was devalued in 1976, 1977 and 1982 (Rojo Reference Rojo2005). The 1976 devaluation was very smooth but 1977 saw the strongest devaluation with the peseta falling more than 20 per cent with respect to the dollar and, as Figure 1 shows, Spain managed a current account surplus in 1978 and 1979 (Serrano Sanz Reference Serrano Sanz2000). In 1982 the peseta was devalued again, this time by 8 per cent. However, in the case of the 2008 crisis, Spain had been in the euro zone since 1999 and as a consequence had lost certain policy instruments, in particular control over exchange rate policy. This problem was exacerbated by the imperfections in the design of the euro zone, in particular the lack of a stabiliser that had existed at the national level prior to the creation of the union: there were no common institutions such as a banking union to solve financial and banking problems, nor was there a fiscal union to provide instruments to face crises (De Grauwe Reference De Grauwe2013). Therefore, currency manipulation allowed Spain to mitigate the negative effects of the crisis in the 1970s but this was not possible in the 2008 crisis.
2.4. The Transmission Mechanism
The transmission mechanisms of these two crises were different. In the 1976 crisis, there were two main transmission mechanisms. The first was the industrial crisis that led to an increased number of failures of industrial firms and unpaid clients. Spanish firms had a low level of self-financing in comparison with other European firms and, consequently, were dependent on banking finance. These loans represented a substantial share of the banks’ business. According to Lluch (Reference Lluch1974), self-financing represented around 27 per cent of total financing of Spanish firms between 1964 and 1970, a markedly lower share than in other countries such as Germany (49 per cent), the United Kingdom (42 per cent) or Italy (42 per cent). The difficulties during the 1970s increased the demand for credit and the low interest rates fuelled credit growth. When, in the 1980s, interest rates increased, there was a corresponding rise in the level of non-performing loans (Fuentes Quintana Reference Fuentes Quintana2004).
The second transmission mechanism was the stock exchange recession resulting from the crisis, and the fact that those Spanish banks (mixed banks)Footnote 15 caught with large industrial portfolios, saw their balance sheets deteriorate (Cuervo Reference Cuervo1988). During the 1970s, the Spanish economy had more industrial sectors experiencing problems than other OECD countries did, and most of the Spanish banks’ industrial holdings were from firms operating in these sectors (Fuentes Quintana Reference Fuentes Quintana2004).
By contrast, the transmission mechanism in the 2008 crisis was the end of the housing bubble. From the mid-1990s to 2008, Spain experienced a real estate bubble, one of the most dramatic housing booms of any developed countryFootnote 16 . The construction and housing bubble was linked to a credit boom (mortgages and loans to real estate development firms)Footnote 17 . When the housing bubble burst and banking institutions stopped lending, a domino effect was set off: there was a drastic fall in production and employment and the decrease in housing prices had a direct impact on disposable income. This change in the macroeconomic environment (and in particular the large increase in unemployment rates) had a direct impact on banking balances and public finances. The international financial crisis restricted the access of Spanish banks and the government to the international markets and the internal problems produced a rise in default.
We have found certain similarities in the origins of both crises: an external shock in the years prior to both financial disturbances, the accumulation of high imbalances following periods of rapid growth, and a process of liberalisation and deregulation accompanied by a financial and credit expansion in the years preceding these crises. We have also observed a number of differences in terms of transmission mechanisms to the real sector and the exchange rate regime that affected the country’s ability to react to the crisis. But what were the differences between the two crises in terms of the macroeconomic and financial impact and why did these differences exist? Is the 2008 crisis as severe as that of 1976? To answer these questions, in the next two sections we compare the macroeconomic (section 2) and financial (section 3) impact of the two crises.
3. IS THE 2008 CRISIS AS SEVERE AS THAT OF 1976?
3.1. Macroeconomic Impact of the Crises
This paper analyses the severity of the crises in two steps. First, it examines the impact of both crises on real GDP, real manufacturing production and the unemployment rate. Second, we use output gap and output loss to measure the severity of the crises.
As Bordo et al. (Reference Bordo, Eichengreen, Klingebiel and Martínez-Peria2001) highlight, crises come in waves, with a new one breaking before there has been a complete recovery from the preceding crisis. As such, determining which part of the macroeconomic impact or output loss should be attributed to each crisis is problematic. How can we establish the duration of a crisis? Most researchers consider a crisis to have ended when GDP growth returns to the pre-crisis trend. However, Field (Reference Field2017) disagrees with this criterion, arguing that a recovery cannot be declared until the economy appears to have returned to potential output in levels. For the Spanish crises, there are problems with both criteria. Following the 1976 crisis, the economy never returned to the pre-crisis growth trend because of the exceptional growth in the pre-crisis years. Moreover, the economy did not experience a decline in output in levels. The crisis led to lower rates of growth than years prior to the crisis but there were no negative growth rates. For the 2008 crisis, growth rates were negative until 2014 when the annual rate of GDP growth was once again positive (2.2 per cent in the last quarter) but below the pre-crisis growth rate (potential output growth of 3 per cent). The pre-crisis growth rate was reached in the second quarter of 2015, when it rose to 3.1 per cent (Instituto Nacional de Estadística (INE) several years). Furthermore, Spain has not yet returned to its previous GDP levels. In light of all these circumstances, we have decided to consider both crises as lasting for 6 years — 1976-1981Footnote 18 and 2008-2013 — given that all the estimations are affected by the methodologies used and also the assumptions made about the duration of the crises.
3.1.1. The evolution of the main macroeconomic indicators
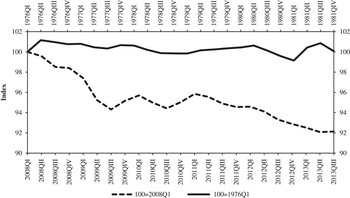
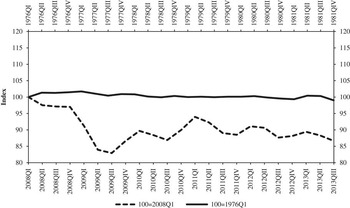
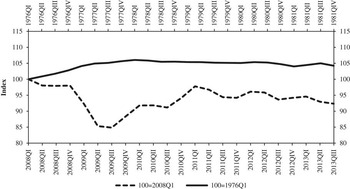
In Figure 2 we show the fall in real GDP in the 1976 and 2008 crises. In the case of the 1976 crisis, the real output index after the crisis was around 100, as it was in the crisis year (100=1976Q1)Footnote 19 . However, the real output during the 2008 crisis declined by as much as 8 per centFootnote 20 . These patterns also occurred in terms of real manufacturing production which was 5 per cent higher in 1981 than in 1976, and which fell by 15 per cent during the 2008 crisis (Figure 3). For the 1976 crisis, the increase was even higher if we consider industrial production, which includes both the manufacturing and building sectors; but the decline was a little less in the 2008 crisis (Figure 4).
REAL GDP Source: INE (several years).

REAL MANUFACTURING GDP Source: INE (several years).

REAL INDUSTRIAL GDP Source: INE (several years).

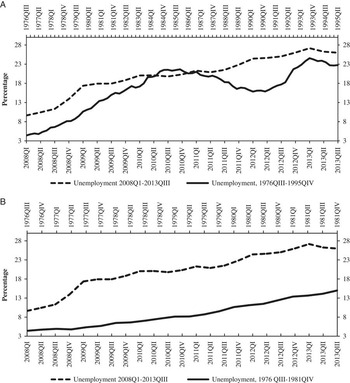
Unemployment peaked at 27 per cent in the 2008 crisis (in 2013Q1) and 15 per cent in 1976 (in 1981Q2) (Figure 5A). The highest unemployment in history prior to the 2008 crisis was recorded in 1994Q1 with a ratio of 24.5 per cent (Figure 5B). However, the unemployment growth rate was higher in the case of the 1976 crisis due to the relatively low unemployment rate at the start of 1976 (4.41 per cent in 1976QIV compared to 9.63 per cent in 2008Q1). The evolution of unemployment and social conditions is also related to the income inequality trend. In the 1976 crisis, the Gini index did not change substantially, standing at 32.7 in 1975 and at 32.3 in 1981 (Atkinson and Morelli Reference Atkinson and Morelli2014). By contrast, in the 2008 crisis the Gini index increased from 33 in 2008 to 35 in 2012 (EUROSTAT).
(A, B) UNEMPLOYMENT RATE Source: INE (several years).

3.1.2. Output gap and output loss calculations
A number of different measures can be used to estimate the severity of a crisis. We use two different approaches: the output gap and the output loss. The output gap measures the cumulative difference between actual output and potential output relative to the average potential output as a percentage. The crisis is considered over when actual output returns to its potential. The output gap is calculated to see how the actual output diverges from the equilibrium level. Output loss is estimated as the sum of the differences between trend growth and actual GDP growth until growth returns to trend. As explained above, both measures are sensitive to different assumptions about potential output or trend and so a 6-year duration has been set for both crises.
There are several different processes used to establish potential output; normally it is calculated as a measure of inflationary tensions in an economy and is therefore used for monetary policy objectives. There is no perfect method to obtain potential output but the processes used in the literature can be classified into three groups. The first group fixes some criteria for normal growth, such as a trend growth rate for 3 or 5 years before the crisis. Also included in this group is the method that takes into consideration the economic cycle, the period between two peaks, and within each cycle a deterministic trend growth rate of output is calculated.
The second group uses the Hodrick–Prescott filter. Potential output is determined as the output level that simultaneously minimises a weighted average of the gap between actual output and that obtained by the rate of change of trend output. Another approach uses a semi-structural model from the Phillips curve or Okun’s law.
The third group consists of the production function approach. This is the method used by the IMF, the OECD and the European Commission (more recently). This is a specification form of production function estimated to indicate the level of maximum production that a country can reach with the existing inputs (labour and capital) and technology. Potential GDP can be represented by a combination of factor inputs, multiplied by the technological level or total factor productivity (TFP). The parameters of the production function essentially determine the output elasticities of the individual inputs, with the trend components of the individual production factors, except capital, being estimated. Since the capital stock is not detrended, to estimate potential output amounts the cyclical component is removed from both labour and TFP.
We try, as far as possible, to apply the production function approach. We wanted to use the estimation of trend growth before the onset of the crisis, that is, the pre-crisis estimation. We have to compare actual output with what the potential output would have been if the downturn had not occurred. For the 1976 crisis, there is no estimation for the production function of the Spanish economy such as that before the crisis. We therefore take the approach of using the trend growth between two peaks. The trend growth comes from Prados de la Escosura (Reference Prados de la Escosura2003), and is defined as the average growth rates for a period delimited by 2 peak years. We employ the average growth over the phase prior to the crisis as an indicator of potential growth (potential output 1), which was 6.75 per cent for the 1976 crisis.
However, there is an estimation that was made using the production function for the period 1980-2003 (2.59 per cent for the whole period, and 2.27 per cent for 1981-1990, 1.86 per cent for 1991-1995, and 3.41 per cent for 1996-2003, Estrada et al. 2004). We will use this estimation for comparison (potential output 2).
In order to better compare the two crises, we will calculate the same process for the 2008 crisis as in the 1976 crisis, with the trend growth between two peaks calculated from the INE (several years) database (3.35 per cent)Footnote 21 , the so-called potential output 1. However, as there is an estimation for the potential output growth for the pre-crisis period, 2000-2007 (3 per cent, Hernández de cos et al. 2011) and for the crisis period 2008-2012 (1 per cent, Hernández de cos et al. 2011), we will also use both of these. The estimation during the crisis period is potential output 2, such as in the case of the 1976 crisis, and the one for the period prior to the 2008 crisis is potential output 3.
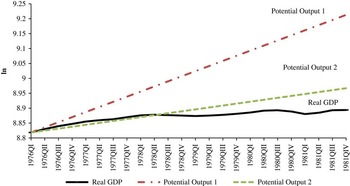
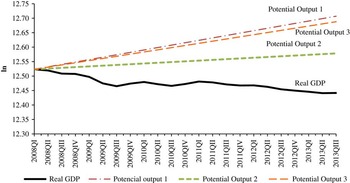
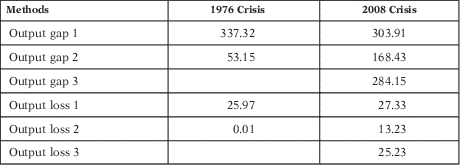
We obtain different results when we calculate the output gap for the 1976 crisis compared with the results obtained for the 2008 crisis (Figures 6 and 7 for the 1976 and 2008 crisis, respectively). The recession between 1976 and 1981 resulted in a cumulative output gap 1 equal to about 337.32 per cent of average potential GDP at the time, an amount higher than that related to the 2008-2013 crisis using the same method of calculation (303.91 per cent), shown in Table 2 Footnote 22 . However, for the 2008 crisis, following the production function approach with potential output 3, output gap 3 was 284.15 per cent, a figure which is close to the output gap 1 estimation (Figure 7 shows how close together potential outputs 1 and 3 are).
1976 CRISIS: OUTPUT GAP Source: see text.

2008 CRISIS: OUTPUT GAP Source: see text.

OUTPUT GAP AND OUTPUT LOSS, IN PERCENTAGES

Notes: Output gap and output loss definitions are explained in the text. 1976 crisis duration: 1976Q1-1981QIV, 2008 crisis duration: 2008Q1-2013QIII. In the 1976 crisis: (1) growth rate for the period: 6.75% (previous period), (2) growth rate: 2.59% (output function for the crisis period). In the 2008 crisis: (1) growth rate for the period: 3.35% (previous period), (2) growth rate: 1% during the crisis period and (3) growth rate: 3%, potential output by production function in the previous period.
Source: Calculated with data from INE (several years).
If we calculate the output gap associated with the potential output during the crisis period, denominated potential output 2, the results are different. In this case the cumulative output gap is 168.43 per cent of average potential GDP during the 2008 crisis and 53.15 per cent of average potential GDP in the 1976 crisis (Table 2). The reason for the relatively greater impact of the 2008 crisis is that the aggregate demand contraction was higher than the potential output during this crisis, as we can see by comparing potential output 2 and real GDP in 2008 (Figure 7) and 1976 (Figure 6).
Another way of determining the loss associated with the crisis is to calculate the cumulative loss of output, namely output loss. This is estimated by summing the differences between trend or potential growth and output growth rate until the crisis ends (6 years in our case). In this metric, the output loss with respect to potential output 1 is 25.97 per cent in 1976 and 27.33 per cent in 2008 (see Table 2). However, if we take into account potential output 2 (the potential output during the crisis), the 2008 output loss was also higher than the 1976 output loss (13.23 and 0.01 per cent, respectively), as was the case with the previous output gap 2 calculation. When we consider the growth rate estimated by a production function for the period prior to the 2008 crisis, output loss 3, we obtain an output loss of 25.23 per cent. The explanation for these results in relation to the output gap results calculated previously is that here we are comparing growth rates instead of output in levels and also the actual growth rate during the 2008 crisis was far lower than potential growth due to the higher aggregate demand contraction. As a consequence, the decline in output was much higher in the 2008 crisis than in that of 1976.
Summing up, using the output gap measure 1 for the 1976 and 2008 crises and the output gap 3 for the 2008 crisis, the 1976 crisis would appear to be slightly more severe than that of 2008. However, when we use the output loss measure, we are considering the differences in growth rates between potential and actual output, and since these differences were greater in the 2008 crisis, the output loss is slightly greater in this case. We are conscious of the fact that the different calculation methods used and assumptions made have implications for the assessment of crisis severity, but taking into account the greater macroeconomic impact of the 2008 crisis (in terms of the decline in GDP, manufacturing production and unemployment), we conclude that the 2008 crisis was more severe than that of 1976.
3.2. Financial Impact of the Crises
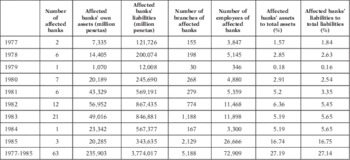
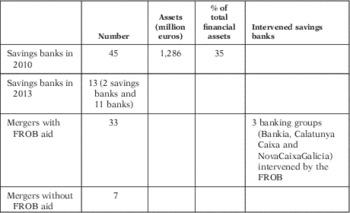
The crises of 1976 and 2008 were principally banking crises. In this section, we compare their impact on the financial sector. The crisis in which the Spanish financial sector was involved in the 1970s was mainly a banking crisis, although it also affected some savings banksFootnote 23 . The banking crisis erupted in 1977. As Table 3 indicates, in 1977 there were 110 banks and around half of these (sixty-three) were affected by the crisis. As the crisis struck small and medium banks rather than the core large banks, the affected banks only represented around 27 per cent of total bank assets and liabilities (Cuervo Reference Cuervo1988). In 1983 the banking crisis hit a large industrial holding group (Rumasa), and twenty banks linked to this holding failed. In 1985 the last three banks failed. By contrast, the 2008 crisis mainly afflicted savings banks (Martín Aceña Reference Martín Aceña2013), although other banks also suffered the consequencesFootnote 24 . In 2007 there were forty-five savings banks while, as Table 4 shows, in 2010 there were only two (Caixa Ontinyent and Caixa Pollença). The remaining savings banks had merged with or been acquired by other entities and transformed into new commercial banks, representing the largest integration process of the Spanish financial system in history. The crisis affected around 35 per cent of total financial assets and around 50 per cent of total loans and deposits (Martín Aceña et al. 2013).
IMPACT OF THE 1977 BANKING CRISIS: NUMBER OF AFFECTED BANKS AND % OF THE BANKING SECTOR

Source: Cuervo (Reference Cuervo1988).
SAVINGS BANKS RESTRUCTURING, 2010-2013

Note: FROB: Fund for Orderly Bank Restructuring.
Sources: Banco de España (2013) and Martín Aceña et al. (2013).
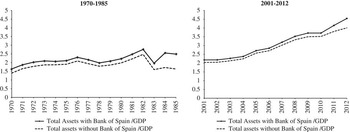
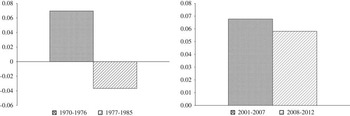
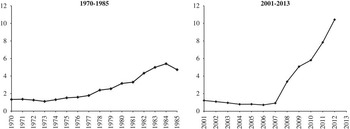
We aim to focus on the bigger picture of the impact of the two crises on the financial sector by examining the following aspects: the size of the financial system, the evolution of loans and the quality of loans or non-performing loans. We also examine the pre- and post-crisis dynamics of both crises. To measure their impact on the size of the financial system, we use the ratio financial assets to GDP. As Figure 8 shows, in the 1977-1985 crisis the Spanish financial system reduced in size. By contrast, in the more recent crisis the impact on the size of the financial system was very modest (Figure 8). In the build-up to the 1976/1977 crisis, the financial assets to GDP ratio grew at an annual rate of 6.9 per cent, and as a consequence of the crisis the ratio fell at an annual rate of −3.6 per cent. By contrast, from 2001 to 2007, the ratio financial assets to GDP grew at a similar rate to the previous crisis (6.8 per cent), but following the crisis the ratio shows a positive growth of 5.8 per cent (see Figure 9). Therefore, compared to the 1976 crisis, the 2008 crisis has led to a restructuring of the Spanish financial sector but has not affected its size. The ratio commercial bank assets to GDP in Spain increased from 3.04 in 2007 to 3.65 in 2011Footnote 25 , whereas other countries showed a slow-down in the ratio after the crisis, as was the case of Germany (from 3.13 in 2007 to 3.11 in 2011), the Netherlands (from 5.92 in 2007 to 4.69 in 2011) and Switzerland (6.64 in 2007 and 4.94 in 2011) (Houben Reference Houben2013)Footnote 26 .
FINANCIAL ASSETS/GDP Sources: Private Banks: Boletín del Consejo Superior Bancario, Savings Banks: Boletín Estadístico del Banco de España, Bank of Spain: Boletín Estadístico del Banco de España.

FINANCIAL ASSETS/GDP: AVERAGE ANNUAL GROWTH RATE Sources: Private Banks: Boletín del Consejo Superior Bancario, Savings Banks: Boletín Estadístico del Banco de España, Bank of Spain: Boletín Estadístico del Banco de España.

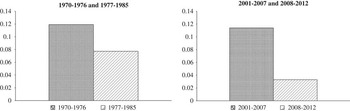
Figure 10 displays the evolution of real credit in the periods 1970-1985 and 2001-2012. In terms of loans, in both cases the periods prior to the crisis were characterised by an increase in real credit growth. Credit rose at an annual rate of 11.9 per cent from 1970 to 1976 and at 11.4 per cent from 2001 to 2007. In the 1970s and 1980s, the number of foreign private loans was negligible (Hernando and Vallés Reference Hernando and Valles1991), however, in the pre-2008 crisis years, the high indebtedness of the Spanish economy was made possible by access to international marketsFootnote 27 , in a context of low interest rates — even negative in real terms in some years — resulting in a gradual accumulation of external debt (Maudos Reference Maudos2012).
REAL CREDIT: AVERAGE ANNUAL GROWTH RATE Sources: 1970-1985: Martín Aceña and Pons (2005), 2001-2013: INE (several years).

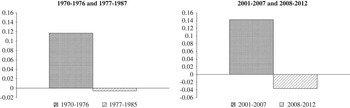
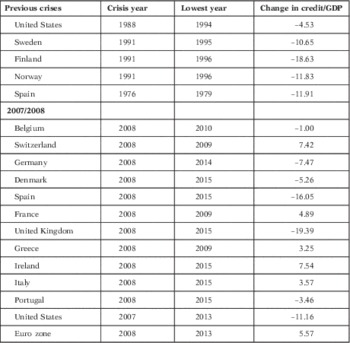
Both crises were followed by a credit crunch, more acute in the recent crisis than in that of 1976. The impact is even stronger when we include not only loans but also commercial effects (see Figure 11). In both cases the annual growth rate of real credit investment (loans and commercial effects) was negative in the post-crisis years but from 1977 to 1985 the rate was −0.5 per cent, while from 2008 to 2012 the fall was much sharper (−3.6 per cent annually). Tong and Wei (Reference Tong and Wei2009) compare the credit growth between 2001 and 2006 for a sample of 45 countries and Spain is one of the countries with highest credit growth in the 6 years preceding the 2007/2008 crisis, only surpassed by Ireland and Sweden. EUROSTAT offers data on the private sector credit flow as percentage of GDP for a sample of twenty-eight European countries and Spain is one of the countries registering the most serious credit contraction after the 2008 crisis. The Bank for International Settlements (BIS) (Reference Betrán, Martín-Aceña and Ponsseveral years) data yield similar results (Table 5). In this sense, data show that the transmission of the banking crisis to the real sector through a contraction of credit has been more acute in the 2008 crisis than in that of 1977. In both cases, small- and medium-sized enterprises were the most affected by the liquidity restrictions (see Hernando and Vallés Reference Hernando and Valles1991, for the 1980s, and Maudos and Fernández de Guevara Reference Maudos and Fernández de Guevara2014 and Salas Reference Salas2013 for the post-2008 crisis years).
REAL CREDIT INVESTMENT (CREDIT AND COMMERCIAL EFFECT): AVERAGE ANNUAL GROWTH RATE Sources: Martín Aceña and Pons (2005), 2001-2013: INE (several years).

CREDIT TO PRIVATE NON-FINANCIAL SECTOR

Note: Change in the ratio credit to GDP from the year of the crisis to the year with the lowest ratio in the aftermath of the crisis.
Source: BIS (Reference Betrán, Martín-Aceña and Ponsseveral years).
Both crises damaged the quality of banking assets, which depends on the degree of credit risk linked to banking activities. The ratio non-performing loans to total loans increased from a level of just 1.1 in 1973 to 3.3 in 1981 (it grew at a cumulative rate of 13.6 per cent), whereas in the 2008 crisis it shows a sharp boost from a rate of only 0.92 in 2007 up to a level of 10.4 in 2012 (it grew at a cumulative rate of more than 60 per cent) (Figure 12). Banks have definitely been more severely hit by an incorrect evaluation of risks in the recent crisis than in that of 1977. Securitisation may have led to less accurate credit evaluation as it weakened credit risk controls by increasing the distance between the bank and the ultimate bearer of the loan-default risk (Carbó et al. Reference Carbó, Marqués-Ibáñez and Rodríguez-Fernández2011). The research by Petria et al. (Reference Petria, Zapodeanu and Cociuba2014) for twenty-two countries during the 2008 crisisFootnote 28 shows that Spain is among those with a level of non-performing loans above 10 per cent (along with Greece, Ireland, Romania, Slovenia, Hungary, Cyprus, Italy, Lithuania and Bulgaria).
NON-PERFORMING LOANS TO TOTAL LOANS Source: Boletín Estadístico del Banco de España.

The crises also altered the bank portfolio structure. After the 1977 crisis, Spanish banks reduced their industrial equity investments. From the mid-1970s, factors such as the stagnation of the Spanish economy, the fall in firms’ profits, rising interest rates and the stock market crash, all came together to reduce the attractiveness of industrial equities investment for banks (Blanch et al. Reference Blanch, Garrido and Sanromá1990, Martín et al.Reference Martín, Carbó and Sáez1995). Only after 1985, when economic activity recovered, did banks once again reorient their investment policy towards industrial securities, but selling off industrial holdings in sectors with low profitability and increasing their holdings in strategic sectors such as electricity, chemical, building or communications (Chulia Reference Chuliá1990). A novel element in this period was the involvement of the saving banks in the capital of industrial firms. As mentioned above, more intense competition reduced intermediation margins and saving banks tried to find new sources of profit. The privatisation of some state-owned firms gave saving banks the opportunity to buy industrial securities (Cals Reference Cals1998). Thus, in 2006, the industrial portfolio of banks represented 3.5 per cent of total assets, whereas for the saving banks it was 5.7 per cent (Sacristan and Cabeza Reference Sacristán and Cabeza2008).
The 2008 crisis produced deep changes in the structure and performance of Spanish financial intermediaries. Factors such as the disappearance of the saving banks, the need to follow the restructuring plans agreed with Brussels and the required compliance with international financial regulations — Basel III/CRD IV — that impose capital penalties on financial institutions with a large portfolio of financial and non-financial securities, have all come together to encourage Spanish financial intermediaries to rid themselves of these holdings and to get back to traditional banking business. This process has been called Back to Boring Banking, which means reverting to more traditional banking business models (retail or commercial banking) and, thus, separating investment banks from commercial banking activitiesFootnote 29 . The main result has been that banks and saving banks in Spain registered a new low in holdings of non-financial equities in 2015, at 3.6 per cent. This is 12 percentage points lower than in 1992 and 5.8 points lower than in 2007 (Bolsas y Mercados Españoles 2016).
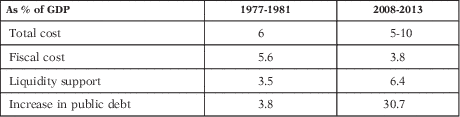
Finally, there are several estimations of the costs of both banking crises. Cuervo (Reference Cuervo1988) made an estimation of the total cost of the 1977-1985 banking crisis and he concluded that the public sector and private contributions jointly represented around 6 per cent of GDP. As Poveda (Reference Poveda2012) mentions, although these figures have been criticised, they remain the best estimates available. There is no equivalent research for the 2008 crisis. It is too early to have a good approximation of the total cost of this crisis and the existing data differ depending on what is considered as a loss. The first estimates from the Banco de España (2013) established that the cost of the banking crisis up to 2012 was 61,366 million euros, and the most recent update puts this figure at 61,495 million euros (Banco de España 2016). These estimates included the aid from the FROBFootnote 30 (Fund for Orderly Bank Restructuring), the FGDFootnote 31 (Fund of Deposits Guarantee) and other direct financial assistance. In addition to these funds, there were also other possible losses that are difficult to establish in advance. For example, in November 2012 the government created the Sociedad de Gestión de Activos Procedentes de la Reestructuración Bancaria (SAREB), an organisation that received a substantial amount of assets transferred from those banks with problems. The SAREB was, therefore, a «bad bank» created to manage and sell all the «toxic» assets (from the housing bubble) over the following 15 years. The SAREB and other bonds guaranteed by the state (the so-called contingent liabilities) made up another 101,632 million euros (Maudos Reference Maudos2013). It is difficult to know what will happen with these assets and how much the actual losses will come to. The most optimistic estimates of the cost of the crisis suggest that from 2008 to 2014 it was around 5 per cent of GDP (European Central Bank (ECB) Reference Escrivá and Correa2015), not very far from the estimates of the 1976 crisis, whereas other estimates are around 9 per cent to 10 per cent of GDP (clearly above the 1976 crisis); however, as mentioned above, these results depend on what is considered as a loss. For example, as Maudos (Reference Maudos2013) explained, direct capital injection from 2007 to 2012 represented 5.2 per cent of GDP, on a par with the average value in the EU-27 and very close to the average value of 5.5 per cent in the euro area. By contrast, contingent liabilities represented 10 per cent of GDP, a percentage twice that of the EU-27 average (Table 6). Thus, although in other countries such as Germany, the Netherlands, the United Kingdom and Greece, more public resources were mobilised to inject capital into the banking sector than in Spain, Spanish taxpayers have had to pay more to bailout their banks due to the fact that the bulk of the capital aid transferred was to absorb losses rather than to carry out financial transactions, such as buying shares. Another indicator of the crisis is the increase in the public deficit produced by state aid to banks; Spain is ranked second of all EU-27 countries in terms of the cost to taxpayers of its bank bailout, at 3.8 per cent of GDP.
COST OF THE BANKING CRISES

Sources: Total cost 1977-1985: Cuervo (1988); total cost 2008-2013: lower bond of 5 per cent ECB (2015) and Maudos (2013), considering only direct capital injection and upper bond of 10 per cent Maudos (2013), considering contingent liabilities. Remaining data: Laeven and Valencia (2012, 2013).
Empirical research carried out by Laeven and Valencia (Reference Laeven and Valencia2012, Reference Laeven and Valencia2013) includes the following results in relation to Spain:
-
∙ The fiscal costs (the component of gross fiscal outlays related to the restructuring of the financial sector, including fiscal costs associated with bank recapitalisations but excluding asset purchases and direct liquidity assistance from the Treasury) associated with these two crises were 5.6 per cent of GDP for the 1976 crisis and 3.8 per cent for that of 2008. The fiscal cost for the 1976 crisis (5.6 per cent) is below the average for all the countries (6.8 per cent) and for the advanced countries from 1970 to 2011 (3.8 per cent), whereas the fiscal cost for the more recent crisis coincides with the average for the advanced countries.
-
∙ The liquidity support (liquidity is measured as the ratio of central bank claims on deposit money banks and liquidity support from the Treasury to total deposits and liabilities to non-residents) was around 3.5 per cent for the 1976 crisis and higher (by 6.4 per cent) for that of 2008. The liquidity support for both crises is clearly below the average for all countries for the period 1970-2011 (9.6 per cent) and in the case of the recent crisis is above the average for the advanced countries (5.7 per cent).
-
∙ The increase in public debt as a percentage of GDP from the year before the start of the crisis to the 3 years following the start of the crisis was 3.8 for the 1976 crisis and 30.7 for that of 2008. In this case the increase for the recent crisis is clearly above the figure for all the countries (12.1 per cent) and even for the advanced countries (21.4) from 1970 to 2011.
To sum up, in terms of the impact of the crisis on the financial sector (with the exception of size) and the cost of the banking crisis, our estimates show that the 1976 crisis was surpassed by that of 2008 (Table 6). Moreover, the former was solved internally thanks to the peseta devaluation and fiscal expenses, although there was also an external default in 1978 assisted by the IMF. However, in the more recent crisis Spain was unable to tackle the financial crisis by means of the exchange rate instrument and increasing fiscal expenses, and instead had to increase public debt and employ internal wage devaluation. It also received external financial assistance by applying for a 100,000 million euro rescue package provided by the European Stability Mechanism.
4. CONCLUSIONS
Is the 2008 crisis as severe as that of 1976? Considering the macroeconomic impact of the two crises, the more recent crisis had a lesser but similar impact in terms of output gap and an equivalent impact in terms of output loss. However, taking into account the macroeconomic impact of the two events (in terms of the decline in GDP, manufacturing production and unemployment), we conclude that the 1976 crisis was surpassed by that of 2008.
With respect to the financial impact of the two crises, in terms of banking assets the 2008 crisis was less severe than that of 1977. The 1977 crisis led to a reduction in the size of the financial system whereas the 2008 crisis did not. The 1977 crisis affected half of all banking institutions but the impact was predominantly on small and medium banks rather than the core large banks. By contrast, the 2008 crisis severely hit savings banks, most of them large and medium size institutions that merged with other banks. Therefore, in comparison to the 1976 crisis, the more recent crisis has led to a restructuring of the Spanish financial sector but has not affected its size. In terms of loans, in both cases the crises were preceded by credit growth and the crises produced a credit crunch, but the credit contraction was much higher in the 2008 crisis than in the earlier one. The ratio non-performing loans to total loans was greater in the 2008 crisis than in that of 1977, reaching rates above 10 per cent (it should be borne in mind that in the more recent crisis the ratio for U.S. banks has been around 3 per cent and the average for the advanced economies 4 per cent). Finally, the fiscal cost of the 1976 crisis is higher than that of the later crisis, but the total cost, which includes the central bank support and public debt, seems to be higher in the 2008 crisis.
To sum up, we are still experiencing the most severe crisis of the last 150 years, with an extraordinary impact not only on macroeconomic variables, but also on the financial system. The big question is what explains the greater severity of the 2008 crisis. The most recent debate about the factors that produce financial crises focussed on the role of current account imbalances and credit booms. Although it is difficult to test empirically, the evidence we have shown indicates that the 1976 and 2008 crises were preceded by an expansion of credit. However, the main difference between the two crises relates to the current account imbalances. In both cases there was a significant increase in the current account deficit the years prior to the crises, more exacerbated in the case of the 2008 crisis. Moreover, whereas in 1976 the authorities devaluated the peseta and even managed to change the sign of the current account balance (it was positive in 1978 and 1979), in 2008 Spain had lost the exchange rate policy as a consequence of being in the euro zone. Therefore, a possible factor that could be behind the differences in terms of severity between the two crises is that in 1976 currency control allowed Spain to mitigate the negative effects of the crisis but this was not possible in the more recent crisis when Spain no longer had the fiscal and monetary instruments to tackle the crisis and instead had to rely primarily on wage adjustmentFootnote 32 . Moreover, although being in the euro system was good for the growth of the Spanish economy since it encouraged the entry of much more capital for investment at lower interest rates, this had an adverse effect when the 2012 euro crisis occurred. Due to the possibility of breaking away from the euro, a high risk-premium was paid. It is true, however, that from 2012 Spain managed to create a moderate surplus in the current account balance thanks to a dynamic export sector and to the balance on services (mainly tourism) maintained until 2015. The extent to which the current account adjustment in Spain has been cyclical or structural is open to debate, but is probably not only the result of the former but also the latter.