Introduction
Impairments of visual information processing have been assessed with visual masking (VM) tasks in patients with schizophrenia (Saccuzzo & Braff, Reference Saccuzzo and Braff1981; Green et al. Reference Green, Nuechterlein and Mintz1994a , Reference Green, Nuechterlein and Mintz b , Reference Green, Nuechterlein, Breitmeyer, Tsuang and Mintz2003; Cadenhead et al. Reference Cadenhead, Serper and Braff1998; Rassovsky et al. Reference Rassovsky, Green, Nuechterlein, Breitmeyer and Mintz2005). In VM paradigms, a target stimulus is flashed briefly and the detectability of the target is reduced by a masking stimulus that either precedes the target in forward masking or follows the target in backward masking. Although patients with schizophrenia display deficits in both forward (Slaghuis & Bakker, Reference Slaghuis and Bakker1995; Slaghuis & Curran, Reference Slaghuis and Curran1999; Green et al. Reference Green, Nuechterlein, Breitmeyer, Tsuang and Mintz2003; Rassovsky et al. Reference Rassovsky, Green, Nuechterlein, Breitmeyer and Mintz2004) and backward (Braff & Saccuzzo, Reference Braff and Saccuzzo1981; Saccuzzo & Braff, Reference Saccuzzo and Braff1981; Schwartz et al. Reference Schwartz, Winstead and Adinoff1983; Green & Walker, Reference Green and Walker1986; Knight, Reference Knight1992; Green et al. Reference Green, Nuechterlein, Breitmeyer, Tsuang and Mintz2003) VM in comparison to controls, evidence has consistently shown that visual backward masking (VBM) deficits are robust across task manipulations and subtypes of schizophrenia (Saccuzzo et al. Reference Saccuzzo, Cadenhead and Braff1996). Furthermore, masking deficits in both directions have been reported in unmedicated remitted schizophrenia patients (Miller et al. Reference Miller, Saccuzzo and Braff1979; Green et al. Reference Green, Nuechterlein, Breitmeyer and Mintz1999), unaffected first-degree relatives of schizophrenia patients, and schizotypal personality disordered subjects (Saccuzzo & Schubert, Reference Saccuzzo and Schubert1981; Saccuzzo et al. Reference Saccuzzo, Cadenhead and Braff1996; Green et al. Reference Green, Nuechterlein and Breitmeyer1997, Reference Green, Nuechterlein, Breitmeyer and Mintz2006; Keri et al. Reference Keri, Antal, Szekeres, Benedek and Janka2000), suggesting that masking deficits may represent an endophenotypic marker (Gottesman & Gould, Reference Gottesman and Gould2003).
The prodromal phase of schizophrenia reflects a vulnerable state to the full disorder with evidence of significant clinical and functional disability; yet these declines in psychosocial functioning may also be present in individuals who do not go on to develop a psychotic illness (Ballon et al. Reference Ballon, Kaur, Marks and Cadenhead2007; Addington et al. Reference Addington, Cornblatt, Cadenhead, Cannon, McGlashan, Perkins, Seidman, Tsuang, Walker, Woods and Heinssen2011). Conversion rates from the prodrome, as defined by empirical clinical criteria (Miller et al. Reference Miller, McGlashan, Rosen, Cadenhead, Cannon, Ventura, McFarlane, Perkins, Pearlson and Woods2002, Reference Miller, McGlashan, Rosen, Cadenhead, Cannon, Ventura, McFarlane, Perkins, Pearlson and Woods2003), to psychosis have been reported to be approximately 25–35% over 1 to 2.5 years (Yung et al. Reference Yung, Phillips, Yuen and McGorry2004; Olsen & Rosenbaum, Reference Olsen and Rosenbaum2006; Cannon et al. Reference Cannon, Cadenhead, Cornblatt, Woods, Addington, Walker, Seidman, Perkins, Tsuang, McGlashan and Heinssen2008). As a means of improving the positive predictive power of these criteria, biobehavioral markers (Cornblatt & Erlenmeyer-Kimling, Reference Cornblatt and Erlenmeyer-Kimling1985; Gur et al. Reference Gur, Cowell, Turetsky, Gallacher, Cannon, Bilker and Gur1998; Cadenhead et al. Reference Cadenhead, Light, Geyer, McDowell and Braff2002, Reference Cadenhead, Light, Shafer and Braff2005; Niendam et al. Reference Niendam, Bearden, Johnson, McKinley, Loewy, O'Brien, Nuechterlein, Green and Cannon2006b ; Turetsky et al. Reference Turetsky, Calkins, Light, Olincy, Radant and Swerdlow2007; Perez et al. Reference Perez, Ford, Roach, Woods, McGlashan, Srihari, Loewy, Vinogradov and Mathalon2011) and neurocognitive assessment (Eastvold et al. Reference Eastvold, Heaton and Cadenhead2007; Jahshan et al. Reference Jahshan, Heaton, Golshan and Cadenhead2010) have been implemented as additional strategies to increase the specificity of prodromal criteria, but VM has yet to be assessed in individuals at risk for psychosis meeting these criteria.
To improve the sensitivity of VM as a putative biomarker for psychosis, and to better understand the mechanism by which psychosis develops, the stimuli used in the VM task can be modified to stimulate specific subcortical neuroanatomical pathways (a low spatial frequency mask stimulates the magnocellular and a high spatial frequency mask the parvocellular pathway) that originate in the eye and project to primary visual cortex and the corresponding dorsal and ventral processing streams (Breitmeyer & Ganz, Reference Breitmeyer and Ganz1976; Breitmeyer & Ogmen, Reference Breitmeyer and Ogmen2000; Van Essen et al. Reference Van Essen, Anderson and Felleman1992) The masking paradigms can require participants to locate (dorsal stream) versus identify (ventral stream) target stimuli, activating the cortical component (Balogh & Merritt, Reference Balogh and Merritt1987; Green et al. Reference Green, Nuechterlein and Mintz1994b;Cadenhead et al. Reference Cadenhead, Serper and Braff1998; Slaghuis & Curran, Reference Slaghuis and Curran1999). Patients with psychosis exhibit VM deficits when they are required to locate the target stimuli (Green et al. Reference Green, Nuechterlein and Mintz1994b , Reference Green, Nuechterlein, Breitmeyer and Mintz2006; Cadenhead et al. Reference Cadenhead, Serper and Braff1998), suggesting dysfunction in the magnocellular channel and dorsal stream. Other findings of deficits in identification tasks (Purushothaman et al. Reference Purushothaman, Ogmen and Bedell2000) implicated dysfunction in the parvocellular channel and ventral stream.
The severity of VM abnormalities has been linked to negative symptoms (Green & Walker, Reference Green and Walker1986; Slaghuis & Bakker, Reference Slaghuis and Bakker1995; Slaghuis & Curran, Reference Slaghuis and Curran1999), poorer prognosis for recovery (Saccuzzo & Braff, Reference Saccuzzo and Braff1981; Rund et al. Reference Rund, Landrø and Orbeck1993), and impaired social perception (Sergi & Green, Reference Sergi and Green2003). Furthermore, Green & Braff (Reference Green and Braff2001) discussed the importance of determining how these information processing deficits are related to specific functional outcomes such as social skills acquisition, problem solving, and the ability to function within the community. Therefore, early identification of processing deficits that are predictive of functional outcome may provide treatment targets linked to specific dysfunction in patients in the early stages of psychosis.
The key to using VM as a measure of future clinical severity is its stability over time, and thus far, two studies have assessed VM stability in schizophrenia (Rund et al. Reference Rund, Landrø and Orbeck1993; Lee et al. Reference Lee, Nuechterlein, Subotnik, Sugar, Ventura, Gretchen-Doorly, Kelly and Green2008). Neither of these studies found a significant effect of time on VM in patients tested over a 2-year period. However, in both studies, patient age spanned a large range and was not accounted for in stability measures, confounding the purported stability of VM with normative age-related changes.
The present study is the first to characterize visual information processing in subjects at risk for psychosis relative to first-episode (FE) psychosis patients and healthy controls (HC). We expected to find VM deficits in FE patients, with less pronounced impairments in at-risk (AR) subjects, of whom only a portion are predicted to go on to develop a psychotic disorder. We hypothesized that VM performance would show high stability over time and predict clinical and functional outcome. In exploratory analyses we investigated whether VM deficits are predictive of later psychosis in subjects at risk for psychosis, representing a vulnerability marker for future psychotic illness.
Method
Participants
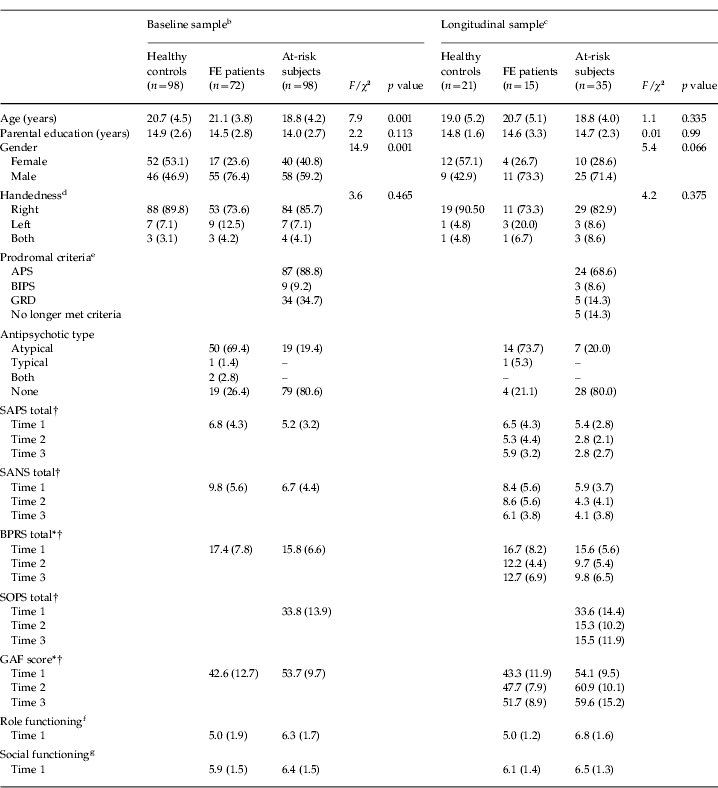
Baseline assessment included 98 AR subjects, 72 FE patients and 98 HC. Clinical ratings and demographic data are presented in Table 1. Subjects were part of the Cognitive Assessment and Risk Evaluation (CARE) Program at the University of California, San Diego (UCSD). AR subjects were identified as at risk for psychosis based on criteria from the Structured Interview for Prodromal Syndromes (SIPS; Miller et al. Reference Miller, McGlashan, Rosen, Cadenhead, Cannon, Ventura, McFarlane, Perkins, Pearlson and Woods2002, Reference Miller, McGlashan, Rosen, Cadenhead, Cannon, Ventura, McFarlane, Perkins, Pearlson and Woods2003), which includes three prodromal syndromes: attenuated psychotic symptoms (APS), brief intermittent psychotic states (BIPS) and/or genetic risk with deterioration in psychosocial functioning (GRD). FE subjects met DSM-IV criteria for a psychotic disorder [52 schizophrenia, 16 psychosis not otherwise specified (NOS), four psychotic mood disorder] according to the Structured Clinical Interview for DSM-IV Axis I Disorders (SCID), with psychosis onset within 24 months. HC were recruited through advertisements. Exclusion criteria for HC consisted of current psychiatric medications, current or past diagnosis of an Axis I disorder, Cluster A personality disorder, or family history of psychotic illness. Exclusion criteria for all participants consisted of past head injury, current drug abuse/dependence, neurological disorder, visual acuity of <20/50, or IQ <70. This study was approved by the Institutional Review Board (IRB) of UCSD, and all participants provided written assent/consent.
Group demographicsFootnote a

FE, First-episode psychosis; APS, attenuated positive symptoms; BIPS, brief intermittent psychotic symptoms; GRD, genetic risk and deterioration; SAPS, Scale for the Assessment of Positive Symptoms; SANS, Scale for the Assessment of Negative Symptoms; BPRS, Brief Psychiatric Rating Scale; SOPS, Scale of Prodromal Symptoms; GAF, Global Assessment of Functioning.
a Values are given as number and percentage of subjects for gender, handedness, prodromal criteria and antipsychotic type. Group means with the standard deviation for age, parental education, SAPS, SANS, BPRS, SOPS, GAF, Global Role, and Global Social scales are reported. Age and education were analyzed with one-way ANOVAs. Gender and handedness were analyzed with Pearson χ2 tests.
b Demographics for all participants included in the baseline analysis at Time 1: healthy controls (HC) n=98, FE n=72, at-risk (AR) subjects n=98.
c Demographics exclusively for subjects participating across Time 1, Time 2 and Time 3: HC n=21, FE n=15, AR n=35.
d The Annett Handedness (Reference Annett1985) questionnaire was used to measure handedness.
e Prodromal criteria APS, BIPS and GRD are not mutually exclusive.
f The Global Functioning: Role (GF: Role) scale (Niendam et al. Reference Niendam, Bearden, Johnson and Cannon2006a ) was used to measure role functioning.
g The Global Functioning: Social (GF: Social) scale (Auther et al. Reference Auther, Smith and Cornblatt2006) was used to measure social functioning.
Baseline FE subjects included for each measure are as follows: Handedness n=65; SAPS, SANS, BPRS, GAF n=68; GF: Role/Social: T1 n=32.
Baseline AR subjects included for each measure are as follows: Handedness, SAPS, SANS, BPRS, SOPS, GAF n=95; GF: Role/Social: T1 n=85.
* Significant improvement within the FE group over time. * p<0.05.
† Significant improvement within the AR group over time. † p<0.05.
Follow-up data are included for three time points over 2 years. At Time 2 (mean 9.07±5.7 months), participants included 60 AR, 38 FE and 49 HC. At Time 3 (mean 16.4±8.3 months), participants included 35 AR, 15 FE and 21 HC.
Only AR subjects who had follow-up clinical data were included in psychotic conversion versus non-conversion analyses. Our conversion rates were: 8/66 (12.1%) at 12 months after baseline, 9/45 (20.0%) at 24 months, and 10/31 (32.3%) at 36 months.
Clinical ratings
Clinical ratings were collected by a clinician researcher within 1 month of VM data collection for Time 1, Time 2 and Time 3. Assessment measures included: the Scale for the Assessment of Positive Symptoms (SAPS; Andreasen, Reference Andreasen1984), the Scale for the Assessment of Negative Symptoms (SANS; Andreasen, Reference Andreasen1983), the Brief Psychiatric Ratings Scale (BPRS; Overall & Gorham, Reference Overall and Gorham1962), the Global Assessment of Functioning (GAF) scale (Hall, Reference Hall1995), and additionally for AR, the Scale of Prodromal Symptoms (SOPS) from the SIPS (Miller et al. Reference Miller, McGlashan, Rosen, Cadenhead, Cannon, Ventura, McFarlane, Perkins, Pearlson and Woods2002, Reference Miller, McGlashan, Rosen, Cadenhead, Cannon, Ventura, McFarlane, Perkins, Pearlson and Woods2003). At Time 1 only, AR subjects and a subset of FE subjects (n=32) were scored on the Global Functioning: Role (GF: Role; Niendam et al. Reference Niendam, Bearden, Johnson and Cannon2006a ) and the Global Functioning: Social (GF: Social; Auther et al. Reference Auther, Smith and Cornblatt2006) scales.
Masking task
Stimuli (Green et al. Reference Green, Nuechterlein and Breitmeyer2002) were driven at 150 Hz/6.67 ms per screen sweep. The target was a square with a gap on one of three sides that appeared in one computer screen quadrant 1° from fixation. The mask comprised four clustered squares that spatially overlapped each possible target location. The three conditions included a high-energy target location task (LOC), a high-energy target identification task (HI), and a low-energy target identification task (LO). Energy is defined as duration×intensity; a high-energy mask was twice the target (four screen sweeps per mask and two per target) and a low-energy mask was half the target (one screen sweep per mask and two per target). For forward and backward directions, six interstimulus intervals (ISIs; 26, 52, 78, 104, 130, 156 ms) were administered for LOC, and seven ISIs (26, 52, 78, 104, 130, 156, 234 ms) were administered for HI and LO. Trials with simultaneous presentation of target and mask, and unmasked target trials, are included in each condition. Twelve trials were administered for each run (each of three targets presented at each of four locations). Conditions were in a block design with random forward and backward trial presentation. In LOC, participants indicated in which quadrant the target appeared. In HI and LO, participants indicated which side of the target stimulus contained the notch. Staircasing methods (Wetherill & Levitt, Reference Wetherill and Levitt1965) were used to arrive at an individualized perceptual threshold to equate unmasked performance. The gray scale value (i.e. critical stimulus intensity) of the target was systematically varied upward and downward, based on whether the subject's response was correct or not, until performance yielded 84% accuracy. During thresholding, target duration was held constant for 13.3 ms. Subjects who did not perform above chance on unmasked target trials were excluded (three AR and three FE subjects). Analyses were conducted with the remaining participants.
Statistical analyses
Group effects in baseline VM
Separate repeated-measures ANCOVAs were conducted at baseline (Time 1) for each of the three masking conditions (LOC, HI and LO) with group as the between-subjects factor, direction (forward, backward) and ISI as within-subject factors, and age as a covariate. Significant interactions involving group and direction were parsed with follow-up one-way ANCOVAs. Greenhouse–Geisser and Bonferroni corrections were used where appropriate.
Conversion effects in baseline VM
AR subjects were parsed into individuals who later converted to psychosis and those who did not develop a psychotic disorder within 12 months of clinical follow-up. Because of the small sample sizes (converters, n=8; non-converters, n=66), we developed a priori hypotheses to examine VM performance, with emphasis at those ISIs that best differentiated AR and FE from HC. As mentioned earlier, patients with schizophrenia display both forward and backward deficits, although some studies suggest more severe impairment in backward masking (Saccuzzo et al. Reference Saccuzzo, Cadenhead and Braff1996). Based on these previous findings, converter/non-converter analyses were limited to VBM performance.
Stability of VM
Data were collected at three time points over 2 years. To examine the stability of masking effects over time, a repeated-measures ANCOVA was conducted separately for forward and backward conditions for each task (LOC, HI, LO) with group as the between-subjects factor, age as a covariate, and time (Time 1, Time 2, Time 3), direction (forward, backward) and ISI (six intervals for LOC, seven intervals for HI and LO conditions) as within-subject factors. Only those subjects (35 AR, 15 FE, 21 HC) who had data for each time point were included. To assess potential contributions of attrition in the characteristics of the longitudinal sample, subjects who were followed for each of the three time points (completers) were compared to those who did not remain in the study (non-completers) on demographic, clinical and functional measures.
Correlates of VM to clinical and functional outcome
To examine the relationship between baseline VM and clinical and functional outcome, each of the six VM conditions (forward and backward LOC, HI, LO) at Time 1 was averaged independently across ISI and entered into a Pearson correlation with clinical and functional measures at Time 1 (98 AR, 72 FE, 98 HC), Time 2 (60 AR, 38 FE, 49 HC) and Time 3 (35 AR, 15 FE, 21 HC) for each patient group separately. Significant correlations (p<0.05) informed follow-up analyses, where correlated baseline VM conditions were entered as predictors of future clinical/functional outcome into backward multiple regression analyses for Time 2 and Time 3 separately. The assumptions of normality, linearity and homoscedasticity of residuals were met.
Results
Group characteristics
As seen in Table 1, gender and age differed statistically between groups and were included as a between-subjects factor and a covariate, respectively, in VM analyses. Post-hoc tests revealed that AR tended to be younger than FE (p<0.001) and HC (p<0.01), but FE and HC did not differ from each other. AR presented with fewer overall symptoms and higher functioning than FE patients.
Group effects for critical stimulus intensity and unmasked targets
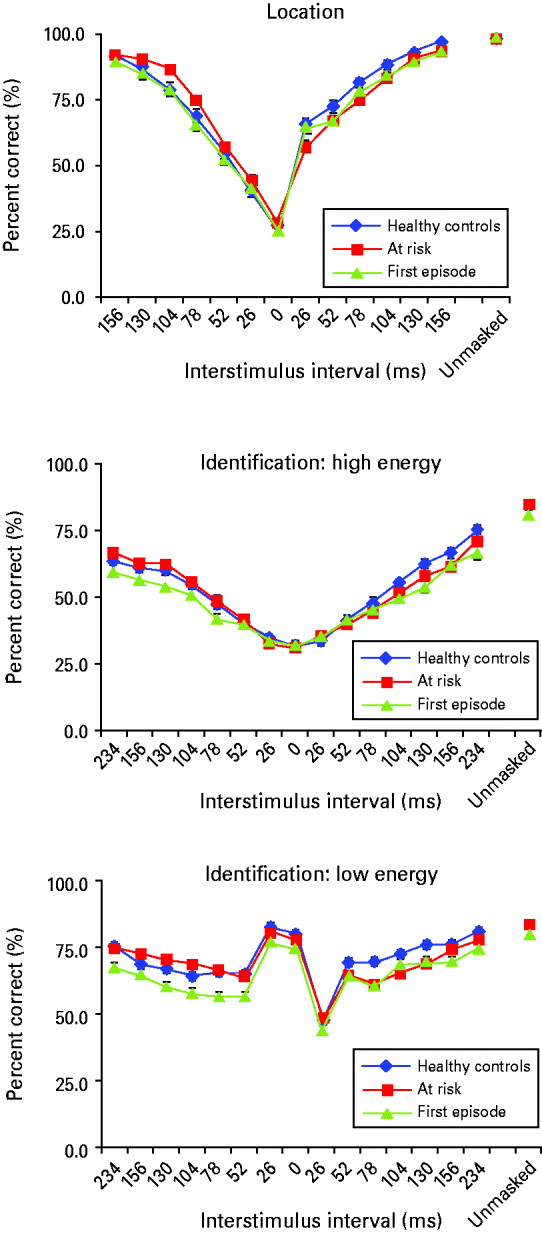
VM performance is shown in Fig. 1. Values for critical stimulus intensity were comparable across groups (p>0.5) and accuracy for the unmasked targets did not differ between groups in any condition (all p>0.1), suggesting that non-specific factors such as task difficulty or baseline performance differences did not affect group differences in VM.
Visual masking (VM) performance for first-episode (FE) patients (green), at-risk (AR) subjects (red) and healthy controls (HC; blue) is shown for all three masking conditions (Location, Identification: high-energy masking, Identification: low-energy masking). Interstimulus intervals between the target and the mask are shown on the x axis. Forward masking trials present the mask and then the target, and are depicted to the left of the 0 ms time point. Backward masking trials present the target and then the mask, and are depicted to the right of the 0 ms time point. At time 0 ms, the target and the mask are presented concurrently. The target presented alone without the mask occurs at the ‘unmasked’ time point. Performance accuracy (percent correct) is shown on the y axis.

Group masking effects
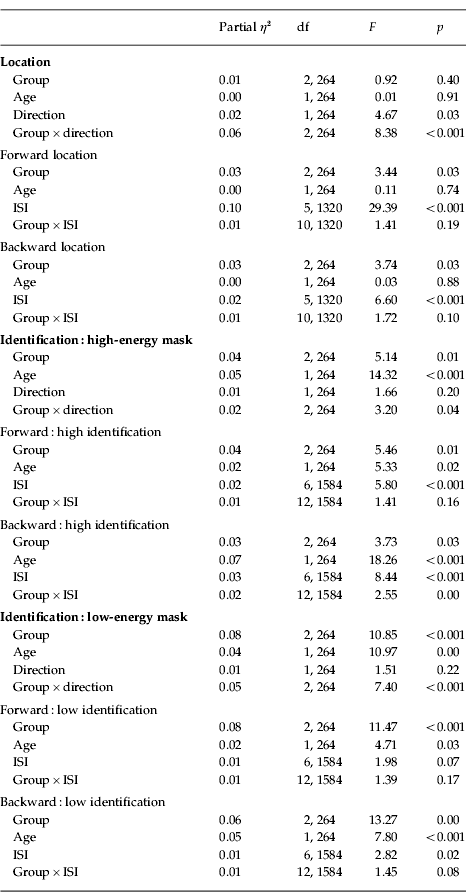
Analyses for group, age, direction and ISI are shown in Table 2.
ANCOVA results showing group differences in visual masking (VM) performance

ISI, Interstimulus interval; df, degrees of freedom.
Gender
There was a significant gender effect in overall VM performance in LOC (p<0.01; females<males) but not in HI or LO. Gender did not significantly interact with group, direction, ISI, time or age in any condition in any analysis. Subsequent report of results, therefore, does not include gender in the model.
Age
We failed to find a significant group×age interaction in any of the ANCOVA models, indicating that each group's VM performance was related to age equivalently, and the interaction term was dropped from the model. Subsequent analyses revealed significant improvement in HI and LO performance with increased age, but not in LOC.
Direction
A significant direction effect was present in LOC, but not in the HI or LO masking conditions. Significant group×direction interactions in each condition justified the decision to parse each task with follow-up ANCOVAs for each direction.
Location mask
We observed main effects of group and ISI, but the group×ISI interaction did not reach significance in either direction. Of note, planned contrasts suggested that AR performed better than HC (p<0.05) in forward masking, yet, in backward masking, AR performed worse than HC (p<0.05). FE did not differ from HC in either direction.
Identification: high-energy mask
Forward masking analyses showed main effects of group and ISI, but no group×ISI interaction was found. Across ISIs, FE performance was reduced significantly compared to HC (p<0.05), although AR did not differ statistically from HC. In backward masking, there were main effects of group and ISI. Planned contrasts showed that FE patients performed worse than HC (p<0.05), and AR performed intermediate to HC and FE, but were not significantly different from either group. We also found a group×ISI interaction, justifying a parsing of ISI. Post-hoc tests revealed that FE performed worse than HC in the backward 104 ms (p<0.05), 130 ms (p<0.005) and 234 ms (p<0.005) ISI conditions, and AR performed worse than HC in the 130 ms (p=0.052) and 156 ms (p<0.05) ISI conditions. There were no differences in VM between FE and AR when each ISI was examined individually.
Identification: low-energy mask
Forward masking analyses revealed a significant main effect of group, a marginal effect of ISI, but no interaction effect was observed. FE performance was significantly reduced compared to HC (p<0.001), but HC and AR groups did not differ from each other. In backward masking, we found main effects of group and ISI. We also found a marginal group×ISI interaction. Post-hoc tests revealed that FE performed worse than HC in the backward 78 ms (p<0.001), 130 ms (p<0.05), 156 ms (p<0.01) and 234 ms (p<0.05) ISI conditions, and AR performed worse than HC in the 52 ms (p<0.05), 78 ms (p<0.001), 104 ms (p<0.01) and 130 ms (p<0.005) ISI conditions. There were no differences in backward VM between FE and AR when each ISI was examined individually.
Masking performance among converters to psychosis
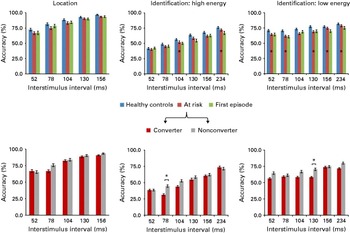
Because of the small sample sizes, we conducted exploratory analyses of converter (n=8) and non-converter (n=66) differences at Time 1 based on a priori hypotheses that pairwise differences would be greatest in conditions that best differentiated AR and FE from HC in VBM. Therefore, planned contrasts were performed at each ISI between 52 and 234 ms in the backward conditions. Converters showed a significant reduction in baseline VBM performance relative to non-converters at the 78 ms ISI in the backward HI condition (p<0.05, Cohen's d=0.91), and at the 130 ms ISI in the backward LO condition (p<0.05, Cohen's d=0.66), as shown in Fig. 2.
Visual backward masking (VBM) accuracy (group means and standard error bars) is displayed for the interstimulus intervals in each masking condition predicted to show the greatest deficits in patient groups. Top panels: VBM performance is shown across first-episode patients (green), at-risk subjects (red) and healthy controls (blue). Bottom panels: From the at-risk group, follow-up clinical data 12 months after baseline parses VBM performance for converters (crimson) and non-converters (gray) to psychosis. Data show poorer VBM performance among converters to psychosis. * p<0.05.

Effect of time on masking across groups
VM performance by ISI for each condition is presented for each group for Time 1, Time 2 and Time 3 in the sample that received all three test sessions in Fig. 3. In the backward LOC condition exclusively, a main effect of time was observed (LOC: F 2,142=3.4, p<0.05), where all groups improved over time. There were no significant interactions involving time with group, age, or ISI in any condition, indicating stable performance over time for all groups and across ISI. Furthermore, correlational analyses examining performance at Time 1 with performance at Time 2 indicated that good performers remained good, and poor performers remained poor (r values range from 0.3 to 0.7 across all VM tasks, all p<0.001). Similar associations occurred between performance at Time 1 and Time 3 (r values range from 0.3 to 0.6 across all VM tasks, all p<0.005).
Visual masking (VM) performance is displayed at each interstimulus interval for each group at Time 1 (black), Time 2 (magenta) and Time 3 (blue). In the location condition, chance performance has an accuracy of 25%. For both identification tasks, chance performance has an accuracy of 33%. The sample size at Time 1 included 98 healthy controls (HC), 72 at-risk (AR) subjects, and 98 first-episode (FE) patients. At Time 2, samples comprised 49 HC, 60 AR subjects and 38 FE patients. At Time 3, samples comprised 21 HC, 35 AR subjects and 15 FE patients.

Attrition
To address any potential contributions of attrition in the baseline sample relative to the longitudinal sample included in the stability analyses, we examined baseline demographic, clinical and functional measures between subjects who remained in the study compared to those who did not complete all three assessments (Table 1). Subjects who completed the study were somewhat younger than those who did not complete each of the three time points (F 1,267=4.2, p<0.05) and, as such, age remained a covariate in stability analyses. Demographics did not differ on any other dimension (parental education, gender, handedness all p<0.2). Furthermore, non-completers showed no evidence of increased symptom severity or psychosocial decline: FE and AR completers did not differ from non-completers on symptoms (all p>0.35 and p>0.2, respectively) or functional measures (all p>0.7 and p>0.3, respectively).
Potential medication effects
To address effects of dopamine D2-receptor blocking antipsychotic medication, exploratory analyses comparing antipsychotic medicated (n=53) to unmedicated (n=19) FE patients, and antipsychotic medicated (n=19) to unmedicated (n=79) AR subjects, were conducted. No VM differences were observed in either group.
Relationship between masking performance and functional ability
Baseline VM was not correlated with GAF scores for either patient group at any time point. In AR, poor role functioning at Time 1 was associated with worse performance on baseline forward identification tasks (HI: r=0.23, p<0.05; LO: r=0.28, p<0.01). In a subset of FE, poor performance on forward identification tasks (HI: r=0.44, p<0.01; LO: r=0.36, p<0.05) was correlated with social functioning, but not role functioning at Time 1. Masking performance was not predictive of future functional outcome in role or social domains in either patient group. Because of the lack of association between baseline masking and future functional measures, predictive regression analyses were not conducted.
Prediction of clinical symptom profile
In FE, no significant correlations were observed between clinical symptoms and VM in any condition at baseline or follow-up. In AR, baseline VM was not correlated with clinical symptoms at Time 1. However, baseline VM was associated with total negative symptoms on the SANS in AR at Time 2 (forward HI: r=−0.27, p=0.036; backward HI: r=−0.31, p=0.015; forward LO: r=−0.37, p<0.01; backward LO: r=−0.31, p=0.015) and Time 3 (forward HI: r=−0.33, p=0.038; backward HI: r=−0.39, p=0.014; forward LO: r=−0.51, p<0.001; backward LO: r=−0.28, p=0.055). VM was not correlated with positive symptoms in either patient group.
VM and clinical symptom profile did not reveal any association in the FE group. As such, follow-up regression analyses were only performed in the AR group. Two separate backward multiple regression analyses examined future negative symptoms at Time 2 and Time 3. Baseline (Time 1) forward HI and LO and backward HI and LO conditions were entered as predictors. The results of the Time 2 initial model accounted for 17.1% of the variance in negative symptoms, and showed that forward LO masking was negatively predictive, indicating that AR with worse performance were expected to have greater negative symptoms at Time 2 (β=−0.146, p<0.05). All other variables did not contribute significantly to the model, and secondary stepwise models were not predictive above and beyond the initial model (F change 1,59=0.01, p=0.97, R 2=0.00). In the Time 3 model, we observed a significant regression coefficient that accounted for 33.5% of the variance in negative symptoms (F 4,34=5.1, p<0.02, R 2=0.335, at step 1). Forward LO (β=−0.25, p<0.01) and backward HI (β=−0.21, p<0.05) VM significantly predicted negative symptoms at Time 3. Additional stepwise models were not significantly predictive above and beyond the initial model (F change 1,34=0.6, p=0.46, R 2=−0.01).
Discussion
Using a VM paradigm, we examined information processing across putative developmental phases of schizophrenia. Previously, it has been shown that performance in VM tasks was diminished across the schizophrenia spectrum (Green et al. Reference Green, Nuechterlein and Mintz1994a , Reference Green, Nuechterlein and Mintz b , Reference Green, Nuechterlein and Breitmeyer1997, Reference Green, Nuechterlein, Breitmeyer and Mintz1999; Rassovsky et al. Reference Rassovsky, Green, Nuechterlein, Breitmeyer and Mintz2004; Lee et al. Reference Lee, Nuechterlein, Subotnik, Sugar, Ventura, Gretchen-Doorly, Kelly and Green2008). The current study replicates these findings by showing abnormal masking performance in schizophrenia patients early in their illness course, and further extends the current literature to show that these deficits are present in individuals at risk for psychosis, although to a lesser degree.
Findings of less pronounced neurobiological abnormalities in AR relative to FE may reflect the heterogeneity of putatively prodromal patients and the fact that only a small percentage will convert to schizophrenia (Cannon et al. Reference Cannon, Cadenhead, Cornblatt, Woods, Addington, Walker, Seidman, Perkins, Tsuang, McGlashan and Heinssen2008). However, the low-energy backward masking condition showed that AR performance resembled the performance of FE, and that both of these groups showed impairment relative to HC. In addition, AR subjects with the most severe impairments in the identification tasks were more likely to convert to psychosis (although the small samples necessitate cautious interpretation). Notably, our observation of impairment in AR subjects across backward location and identification tasks implicates both the dorsal and ventral processing streams, as observed in FE patients.
An unexpected finding was that, although the AR sample had deficits in the backward location VM task relative to the HC sample, they had superior performance in the forward location task. Patients with schizophrenia spectrum disorders are known to have difficulty integrating perceptual information, leading to superior performance on tasks that require interpretation of individual features of a stimulus or visual illusion (Parnas et al. Reference Parnas, Vianin, Saebye, Jansson, Volmer-Larsen and Bovet2001; Silverstein et al. Reference Silverstein, Uhlhaas, Essex, Halpin, Schall and Carr2006). Although we can speculate that AR patients, who are already showing signs of clinical symptomatology and/or psychosocial deterioration, are showing evidence of early difficulties with perceptual integration on this task, clarification of the mechanism underlying superior performance warrants further study.
Theoretically, age-related differences in VM may be reflective of the typical developmental course of speed and accuracy improvements in information processing. Some (Haith, Reference Haith1971; Miller, Reference Miller1972; Welsandt et al. Reference Welsandt, Zupnick and Meyer1973) but not all (Buss et al. Reference Buss, Hall, Grose and Dev1999; Green et al. Reference Green, Nuechterlein, Breitmeyer, Tsuang and Mintz2003) studies have found an inverse relationship between age and susceptibility to the disruptive effects of the mask. Importantly, VM performance was analyzed in parallel with aging, and over time. We confirmed that VM performance improved with age equally across groups. Thus, the magnitude of the deficits observed in FE relative to those observed in AR is not due to age-related decline. Furthermore, age did not interact significantly with time for any group.
In the sample who received repeated assessment, VM performance was stable, with significant correlations over time on each task. These results are consistent with previous studies examining the stability of the VM paradigm (Rund et al. Reference Rund, Landrø and Orbeck1993; Lee et al. Reference Lee, Nuechterlein, Subotnik, Sugar, Ventura, Gretchen-Doorly, Kelly and Green2008). Therefore, stability analyses suggest that VM remains a useful biomarker as an endophenotype and as a vulnerability marker for psychosis.
Disruptions in information processing in schizophrenia have been linked to specific clinical and functional outcomes such as negative symptoms, social skills acquisition, problem solving and the ability to function within the community (Cadenhead et al. Reference Cadenhead, Geyer, Butler, Perry, Sprock and Braff1997; Slaghuis & Curran, Reference Slaghuis and Curran1999; Green & Braff, Reference Green and Braff2001; Sergi & Green, Reference Sergi and Green2003). The present evidence converges with other studies (Ballon et al. Reference Ballon, Kaur, Marks and Cadenhead2007; Cornblatt et al. Reference Cornblatt, Auther, Niendam, Smith, Zinberg, Bearden and Cannon2007) indicating that VM deficits observed in patient groups are associated with a poorer level of functioning, and that these declines begin even before the onset of psychosis. Regarding symptom profile, we did not find an association between symptoms and VM in FE, consistent with other studies (Green et al. Reference Green, Nuechterlein, Breitmeyer, Tsuang and Mintz2003), although many studies do not report these relationships (Saccuzzo et al. Reference Saccuzzo, Cadenhead and Braff1996; Rassovsky et al. Reference Rassovsky, Green, Nuechterlein, Breitmeyer and Mintz2004; Lee et al. Reference Lee, Nuechterlein, Subotnik, Sugar, Ventura, Gretchen-Doorly, Kelly and Green2008; Green et al. Reference Green, Lee, Cohen, Engel, Korb, Nuechterlein, Wynn and Glahn2009). Additionally, we did not find a relationship between performance and AR symptom profile at baseline. However, poor VM in each identification task was associated with future negative symptoms in AR. Such findings suggest that masking performance may identify not only those individuals who go on to develop a psychotic illness but also those who develop deficit symptoms and associated psychosocial decline (Cannon et al. Reference Cannon, Cadenhead, Cornblatt, Woods, Addington, Walker, Seidman, Perkins, Tsuang, McGlashan and Heinssen2008). The relationship between VM impairment and negative symptomatology that emerges prior to the onset of psychosis may be helpful in identifying those at highest risk for severe illness.
We have shown that VM tasks are reliably able to detect information processing impairments in FE patients, and in subjects at risk for developing psychosis, and that these deficits are not due to the influence of aging. By comparing masking performance across different tasks, the current findings show that neural mechanisms underlying both forward and backward masking are dysfunctional (Perkins et al. Reference Perkins, Gu, Boteva and Lieberman2005; Barnes et al. Reference Barnes, Leeson, Mutsatsa, Watt, Hutton and Joyce2008), and that information processing deficits are evident in tasks that favor both the dorsal and ventral processing streams, even before psychosis onset. As target and mask parameters can be modified to emphasize different information processing streams (i.e. dorsal versus ventral pathways), using specific target–mask combinations that are highly sensitive to information processing deficits across the phases of schizophrenia may be most effective for detecting those AR patients who may go on to develop psychosis. Impaired VM performance in putatively prodromal patients may help to identify traits that represent surrogate end-points, and lead to targeted early intervention of specific deficits.
Acknowledgments
We thank M. Green and K. Neuchterlein for allowing us to use the computerized visual masking paradigm they developed at University of California, Los Angeles (UCLA). In addition, we thank the clinicians who provided careful assessment of all at-risk and first-episode subjects (N. Haroun, K. Kristensen, A. Hurria, T. Kaur, A. Eslami, C. Jashan, T. Alderman and I. Domingues) and the dedicated research assistants who spent many hours with our subjects and their data (A. Eastvold, I. Marks, J. Nunag and D. Roman). This study was supported by National Institutes of Health (NIH)-supported grants R01 MH60720 and K24 MH76191.
Declaration of Interest
None.