I. INTRODUCTION
The ternary alloys of aluminum–transition element–rare earth element system was the hot research field in materials science and engineering owing to their strong glass-forming ability and their excellent microstructures, mechanical, electrical, and corrosion resistance performances (Gordillo et al., Reference Gordillo, Zhang, Watson and Aindow2013). There is a phase diagram of complete isothermal section for the Gd–Cu–Al alloy system at 773 K (Raghavan, Reference Raghavan2007) that had been reported, but there are only several compounds that have the crystal structure data in the ICSD database (Inorganic Crystal Structure Database, 2015), such as AlCuGd, AlCu4Gd, Al3CuGd, Al3Cu2Gd, Al6Cu6Gd, Al8Cu4Gd, Al9Cu8Gd2, Al10Cu7Gd2, and Al11Cu6Gd2. There are no reports about the new compound of Al2Cu3Gd. In this work, the crystal structure of Al2Cu3Gd had been studied by the X-ray powder diffraction (XRPD) technique and Rietveld refinement.
II. EXPERIMENTAL
A. Sample preparation
The new ternary compound sample of Al2Cu3Gd had been synthesized by melting with stoichiometric composition in an electric arc furnace under the protection of high purity argon. The raw materials are high purity metals of 99.99 wt.% Al, 99.99 wt.% Cu, and 99.9 wt.% Gd, that come from China New Metal Materials Technology Co., Ltd. The total mass of the sample is 2 g with the composition proportion of 13.43 wt.% Al, 47.44 wt.% Cu, and 39.13 wt.% Gd. In order to reduce the influence from residual gas, titanium metal ingot was melted firstly for 1 min in the melting process. In order to ensure the compositions of the sample had been fused together and distributed uniformly, three times melting processes have been carried out in the experiment. The weight-loss ratio of the sample was 0.8 wt.% after the melting process. The sample was enclosed in an evacuated quartz tube and annealed at the temperature of 1100 K for 30 days.
B. X-ray diffraction (XRD) data collection and processing
The sample had been ground into powder in an agate mortar after the annealing process, and then the XRPD data had been collected by the Rigaku Smart Lab powder diffractometer that equipped with a Cu target and a graphite monochromator at room temperature. The diffractometer was operated at 40 kV and 160 mA, and the step-scanning mode had been adopted with the scan step size of 0.02° and the scan speed of 2 s per step. The goniometer radius is 300 mm, the receiving slit of 0.3 mm, ½°. The data collection range of two-theta (2θ) was from 10.00° to 100.00°. The Bragg angle of the XRD pattern had been corrected by an internal theta calibration method. So the XRPD data for the mixture of Al2Cu3Gd and silicon were collected, and the silicon is the standard reference material that is required to provide the reference peak locations for the calibration. The Bragg angles in the whole pattern were calibrated by building the calibration curve with correction type of parabolic fit. The calculated and observed Bragg angle in the XRD pattern had been determined by means of pattern indexing and cell refinement with Jade 6.5 software (Materials Data Inc., 2002), and the observed intensity of diffraction peaks were acquired too. The precise lattice parameters were determined by the Rietveld refinement with DBWS9807 program (Young, Reference Young, Larson and Paiva-Santos2000). In order to calculate the reference intensity ratio (RIR) value by means of internal standard calibration, the XRPD data of the mixture of 50 wt.% Al2Cu3Gd and 50 wt.% corundum were collected.
III. RESULTS
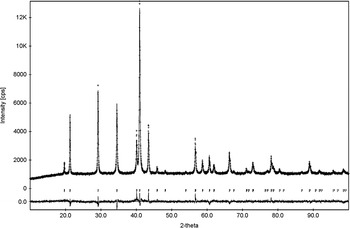
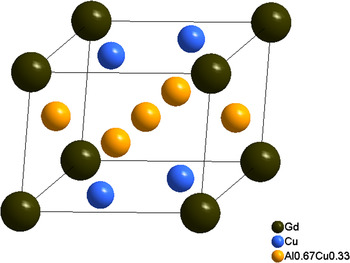
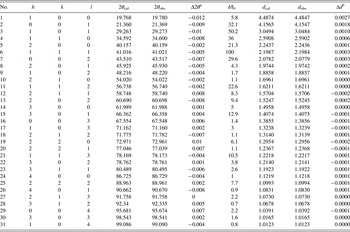
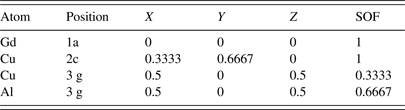
All diffraction peaks in the XRPD pattern of Al2Cu3Gd ternary compound were indexed successfully by Jade 6.5 software with the hexagonal structure, and the calculated and observed 2θ values of XRPD data for Al2Cu3Gd are listed in Table I. The Smith–Snyder figure-of-merit (Smith and Snyder, Reference Smith and Snyder1979) is F 30 = 173.7 (0.0061, 33). The intensity ratio RIR value is 1.29 by calculating the ratio of the highest diffraction peak intensity between Al2Cu3Gd and corundum. It was found that Al2Cu3Gd and Al2Cu3La (Guo et al., Reference Guo, Liang, Zhang, Tang, Zhao and Rao1997) have the same structure type (P6/mmm, no. 191) by comparing the crystal structure information of Al2Cu3Gd with that of Al2Cu3La. The lattice parameters had been refined by DBWS9807 program for the XRPD pattern, and the results show that a = 5.1822 (1) Å, c = 4.1566 (1) Å, V = 96.67 Å3, Z = 1, and the density is 6.62 g cm−3 with the R factors: R p = 3.11%, R wp = 4.05%, R exp = 2.88%, R B = 7.66, R F = 6.09, and S = 1.41. The observed, calculated, and residuals of the XRPD pattern for Al2Cu3Gd after refinement have been shown in Figure 1, and ×Table II shows the atomic positions and their site occupation factor (SOF). The unit-cell structure of Al2Cu3Gd was shown in Figure 2.
Observed, calculated and residuals of the XRPD pattern for Al2Cu3Gd after refinement.

(Color online) Unit-cell structure of Al2Cu3Gd.

The calculated and observed values of XRPD data for Al2Cu3Gd (CuKα 1, with λ = 1.5406 Å).

a Δ2θ = 2θ cal–2θ obs.
b Δd = d cal–d obs.
Atomic positions and occupancy of Al2Cu3Gd with the Rietveld refinement.

SUPPLEMENTARY MATERIAL
To view supplementary material for this article, please visit https://doi.org/10.1017/S0885715616000683..
ACKNOWLEDGEMENTS
This work was supported by the Science and Technology Research Project of the Education Department of Guangxi Government (Grant numbers KY2015YB279 and ZD2014134), and supported by the Scientific Research Project of Baise University (Grant no. 2015KBN03).