Introduction
Aquatic ecosystems are important biodiversity elements in the cold deserts of polar regions, rich in both biomass and species in otherwise barren landscapes (Vincent & James Reference Vincent and James1996, Vincent Reference Vincent2000, Quesada et al. Reference Quesada, Fernández-Valiente, Hawes and Howard-Williams2008). At the highest latitudes, the persistence of such systems depends on melting of surface ice, ground ice, permafrost or snow to replace water lost to evaporation and ablation. All of these processes are sensitive to climatic variability and it has been clearly shown how changes in the flux of liquid water resulting from climate change can propagate to substantial change to the habitat and the biotic components of polar aquatic ecosystems (Smol & Douglas Reference Smol and Douglas2007, Doran et al. Reference Doran, McKay, Fountain, Nylen, McKnight, Jaros and Barrett2008, Hawes et al. Reference Hawes, Howard-Williams and Fountain2008, Verleyen et al. Reference Verleyen, Hodgson, Gibson, Imura, Kaup, Kudoh, De Wever, Hoshino, McMinn, Obbels, Roberts, Roberts, Sabbe, Souffreau, Tavernier, van Nieuwenhuyze, van Ranst, Vindevogel and Vyverman2012, Lyons et al. Reference Lyons, Welch, Gardner, Jaros, Moorhead, Knoepfle and Doran2012). Rates of climate change in polar regions vary, and while the Arctic and Maritime Antarctic appear to be undergoing rapid warming continental Antarctica has so far experienced only a slight temperature increase over recent decades (Turner et al. Reference Turner, Colwell, Marshall, Lachlan-Cope, Carelton, Jones, Lagun and Iagovkina2005, Steig et al. Reference Steig, Schneider, Rutherford, Mann, Comiso and Shindell2009), and a fall in average temperature over the decade 1990–2000 was reported by Doran et al. (Reference Doran, Priscu, Lyons, Walsh, Fountain, McKnight, Moorhead, Virginia, Wall, Clow, Fritsen, McKay and Parsons2002). Against this, the last few decades have seen an irregular but consistent trend of rising levels in the large lakes of the McMurdo Dry Valleys (MDV) of southern Victoria Land (e.g. Chinn Reference Chinn1993, Hawes et al. Reference Hawes, Sumner, Andersen, Jungblut and Mackey2013), which has been linked to consistently warm summers, and particularly large numbers of degree days above freezing (Wharton et al. Reference Wharton, McKay, Clow, Andersen, Simmons and Love1992).
While the large, perennially ice-covered lakes of the MDV are amongst the best known of continental Antarctic aquatic ecosystems, small ponds that freeze in winter and may be ice-free for weeks during summer are perhaps the most common elements of the aquatic environment in polar regions (Howard-Williams & Hawes Reference Howard-Williams and Hawes2007, Vincent Reference Vincent2010, Verleyen et al. Reference Verleyen, Hodgson, Gibson, Imura, Kaup, Kudoh, De Wever, Hoshino, McMinn, Obbels, Roberts, Roberts, Sabbe, Souffreau, Tavernier, van Nieuwenhuyze, van Ranst, Vindevogel and Vyverman2012). Like the MDV lakes, ponds that are hydrologically connected to glacial melt streams are affected by climate-driven variations in melt generation (Lyons et al. Reference Lyons, Welch, Gardner, Jaros, Moorhead, Knoepfle and Doran2012). However, a large sub-set of continental Antarctic ponds occupy closed basins, lacking outflows and fed by melting of winter snow deposits. Such ponds, with their shallow depth and high surface area to volume ratio, are particularly vulnerable to climatic change insofar as it affects the balance of loss by ablation/evaporation and gain from melt (Hawes et al. Reference Hawes, Howard-Williams and Pridmore1993, Moorhead Reference Moorhead2007, Webster-Brown et al. Reference Webster-Brown, Gall, Gibson, Wood and Hawes2010, Verleyen et al. Reference Verleyen, Hodgson, Gibson, Imura, Kaup, Kudoh, De Wever, Hoshino, McMinn, Obbels, Roberts, Roberts, Sabbe, Souffreau, Tavernier, van Nieuwenhuyze, van Ranst, Vindevogel and Vyverman2012). In the high Arctic there is evidence accumulating that many ponds are drying up under a warmer regime (Smol & Douglas Reference Smol and Douglas2007). However, while the sensitivity of closed-basin Antarctic ponds to climatic fluctuations is self evident, identifying effects of changing climate is challenged by our poor understanding of inherent variability of these systems. There are few empirical datasets against which the nature, timescales and magnitude of variability, or the links between variability and climate, can be examined. Timescales are important, as links between changes in habitat and biology depend on the relative speeds over which they operate (Quesada et al. Reference Quesada, Fernández-Valiente, Hawes and Howard-Williams2008).
An opportunity to examine this variability comes from the meltwater ponds on the McMurdo Ice Shelf (MIS), southern Victoria Land (Howard-Williams et al. Reference Howard-Williams, Pridmore, Downes and Vincent1989). Investigations of these ponds have been undertaken since 1988 and a subset of them has been sampled repeatedly. While not a continuous record, the data are sufficient for timescales and magnitude of variability of individual ponds to begin to be assessed, to provide an amplitude scale against which change can be measured. In addition, there is a continuous climate record from 1957 at New Zealand's Scott Base research station located some 30 km away from which a generalized picture of regional climatic variability can be extracted. In this contribution we examine variability in a series of parameters in twelve ponds and focus on the hypothesis that regional climatic variation over decadal timescales is the principal determinant of environmental variability in endorheic Antarctic ponds. In doing this we examine two sub-hypotheses: 1) that the physical parameters in ponds in different catchments will vary together where this variation is driven by overarching climatic variables (coherence), and 2) that variables that are primarily driven by biological activity will be less coherent and more related to pond-specific attributes (consistency).
Testing these hypotheses will provide a baseline of temporal variability in Antarctic ponds against which the relative importance of cyclic and directional change, and the resilience of pond biology to such change, can be assessed. In addition it will assist in understanding the limitations of single-season sampling of polar ponds, often imposed by logistic constraints, on characterization of variable environments.
Study area
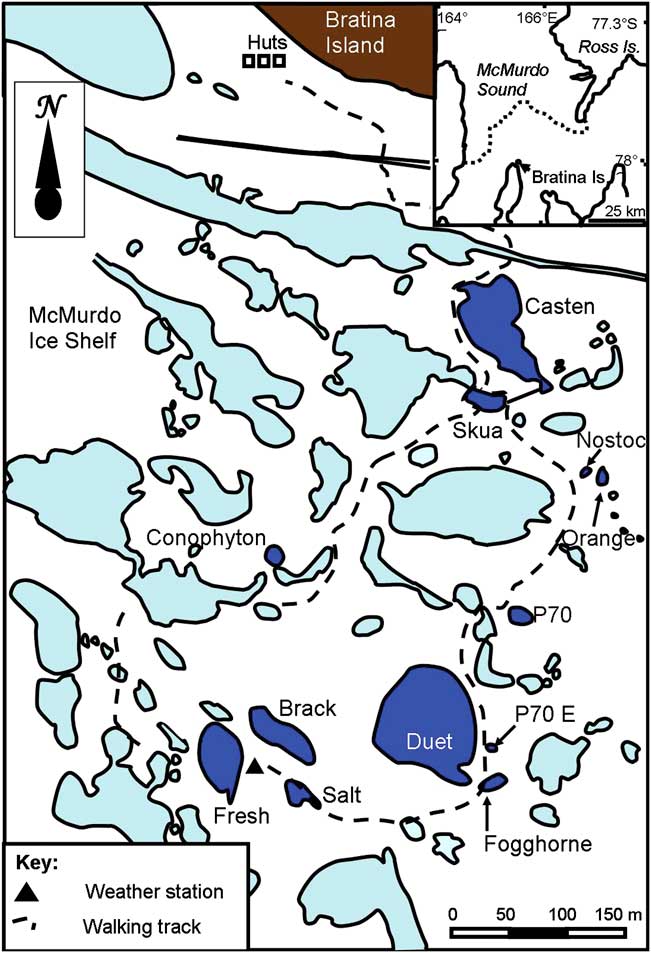
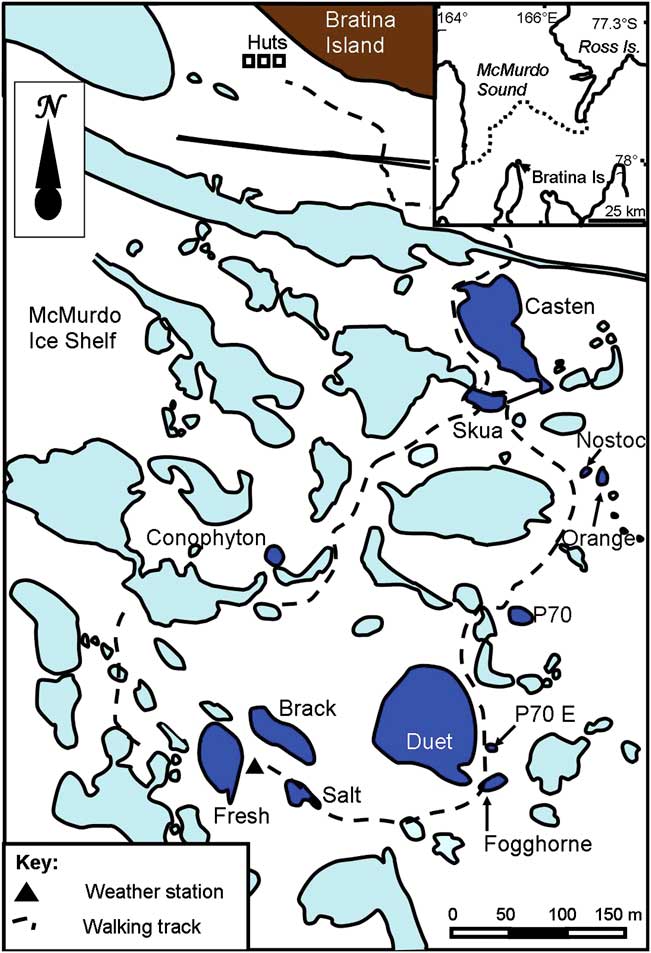
The MIS joins the Ross Ice Shelf, and is located in the south-west corner of the Ross Sea (Fig. 1). It is bounded by Minna Bluff to the south and the coast of southern Victoria Land to the west. On the eastern side, the MIS grades into the Ross Ice Shelf proper, on the western side it grades into the Koettlitz Glacier, while to the north it meets the episodically ice-free waters of the McMurdo Sound. The MIS is one of the most extensive surface ablation areas in Antarctica (Swithinbank Reference Swithinbank1970), but surface ablation is counteracted by a unique characteristic of the area - nourishment of the floating ice shelf by the freezing of seawater beneath (Debenham Reference Debenham1920, Kock et al. Reference Kock, Fitzsimons, Cullen, Hambrey, Samyn and Tison2012). As a consequence of this mechanism, there are large amounts of marine sediment on the surface of the MIS that were incorporated into the ice during basal freezing and have been slowly moved upwards as the surface ice ablates. The surface of the ice shelf at our study site between Bratina Island and Brown Peninsula, has a compression-induced, rolling surface relief with a vertical scale of c. 10 m, with most of the ice shelf surface covered by > 100 mm of sediment. The terrain comprises an array of c. 104 sediment-lined, meltwater ponds (Howard-Williams et al. Reference Howard-Williams, Pridmore, Broady and Vincent1990) of a few tens to hundreds of square metres, lying between rounded mounds of sediment-covered ice. As the ice shelf is continually moving, pressure induced warping of the shelf causes gradual deformation and occasional failure of pond walls resulting in ponds draining or joining. In this study we focus on twelve of these ponds that provide a range of chemical and physical conditions and are conveniently located close to a field laboratory at Bratina Island, a volcanic cone that emerges through the ice shelf.
Ponds on the McMurdo Ice Shelf close to Bratina Island showing the scale and proximity of the twelve study ponds (shown in dark blue). Other ponds are shown in pale blue. Inset top right shows the location of Bratina Island relative to Ross Island and McMurdo Sound.
Methods
Meteorological variables
Meteorological variables at the McMurdo Ice Shelf study area were recorded using a CR10X (Campbell Scientific) datalogger linked to appropriate sensors. Incident radiation was obtained using a LiCor pyranometer, wind speed and direction using Vector Instruments devices, and air temperature using a Vaisala combination temperature/humidity sensor.
This recording station was erected in 1988 but was configured for short-term studies and records are discontinuous. We therefore attempted to correlate measurements on the MIS with comparable ones from Scott Base, some 30 km to the north-east, and where a continuous record from 1957 exists for many variables to allow a continuous surrogate record to be established. To accomplish this we collated periods when synchronous records between MIS and Scott Base were available and constructed simple correlation matrices. For temperature and irradiance these correlations used daily average data. Digitised Scott Base information available for the full period of interest was of daily maximum gust. Maximum gust was, however, not available for MIS, where only hourly mean was recorded. We therefore correlated maximum daily gust at Scott Base with daily average for MIS whenever measurements coincided. We also calculated degree days above freezing (DDAF), a variable which has previously proved useful in characterizing Antarctic climate (Howard-Williams et al. Reference Howard-Williams, Hawes and Gordon2010).
Pond sampling
Water sampling was undertaken each year between the months of December and February during the summer melt period. Sampling in the ponds has been primarily from the pond edge and, since intra-annual variation has been documented (Hawes et al. Reference Hawes, Howard-Williams and Pridmore1993), as close as possible to 15 January. Typically sampling has involved in situ determination of water temperature, conductivity and pH, using a variety of freshly calibrated hand-held instruments. Water was scooped into a one litre polyethylene bottle and returned to the field station laboratory for same day processing. There, water was vacuum filtered through a GF/F filter and the filtrate frozen for return to New Zealand. In New Zealand, NO3-N, NH4-N and dissolved reactive phosphorus (DRP) were determined using an Astoria autoanalyser. Dissolved organic nitrogen and phosphorus (DON and DOP) were analysed as NO3-N and DRP by Lachat FIA, after persulphate digestion.
Samples for measuring planktonic chlorophyll a (chl a) concentration were collected onto Whatman GF/F filters and stored frozen for return to New Zealand. Filters were ground in cold 95% acetone, extracted at 4°C for four hours then the supernatant separated by centrifugation. Chlorophyll a was estimated using a Perkin Elmer or Crary Varian Eclipse spectrofluorometer, calibrated with standard solutions of chl a, using acidification to correct for the presence of phaeopigments.
Samples of benthic microbial mat were collected from the pond margins using a piston corer, with a 2.84 cm2 cross sectional area. In each pond, quintuplicate cores were taken, with care to collect the mat only and no underlying sediment. Cores were extracted into 95% acetone, separated by centrifugation, then absorption was measured at 675 and 750 nm using a twin-beam spectrophotometer before and after acidification. Chlorophyll a concentration, as μg cm-2, was calculated using equations of Marker et al. (Reference Marker, Crowther and Gunn1980).
Statistical treatment
Initial statistical analysis was designed to test first for coherent behaviour between ponds, in order to determine whether regional factors common to all ponds were playing a part in determining pond-variables, and then between variables to determine if consistent correlations could provide insight into mechanisms in play. Correlation analyses, both by rank and by metric, were used, with appropriate transformations to ensure normality prior to analysis for the latter. We used SigmaStat 3.5 (Systat Software Inc) throughout. Subsequently, selected data were analysed, with planktonic and benthic chl a concentration as dependent variables, using regression tree analysis (De'ath & Fabricius Reference De'ath and Fabricius2000). Regression tree analysis is a classification tool that divides datasets into increasingly homogeneous groups using a hierarchy of binomial divisions. It is well suited to datasets where there are non-linear relationships, unequal sample sizes and higher-order interactions, as seen in the data assembled here. Regression tree models were selected by running a series of 50, tenfold cross-validations and selecting the smallest tree with an estimated error rate within one standard error of the minimum (Breiman et al. Reference Breiman, Friedman, Olshen and Stone1984).
Results and discussion
Meteorology
Comparison of conditions at the McMurdo Ice Shelf study site with those at Scott Base showed a strong correlation for air temperature and irradiance. Maximum daily air temperature was well correlated (r 2 = 0.89, P < 0.001, n = 1982), although the deviation from a 1:1 equivalence varied between summer and winter. During midsummer (December–January), the MIS was on average 0.6° warmer than Scott Base, while for the remainder of the year it was 0.8° colder. Mean daily irradiance also correlated well between Scott Base and the MIS (r 2 = 0.84, P < 0.001, n = 1454). These results appear to justify the use of Scott Base temperature and irradiance as proxies for the MIS.
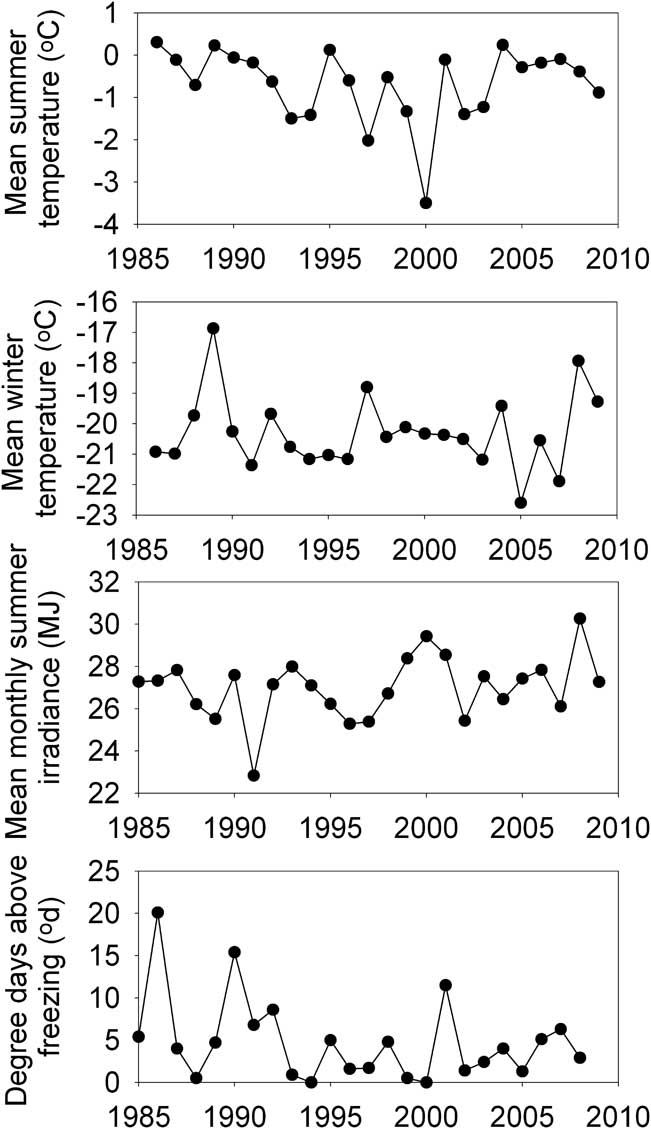
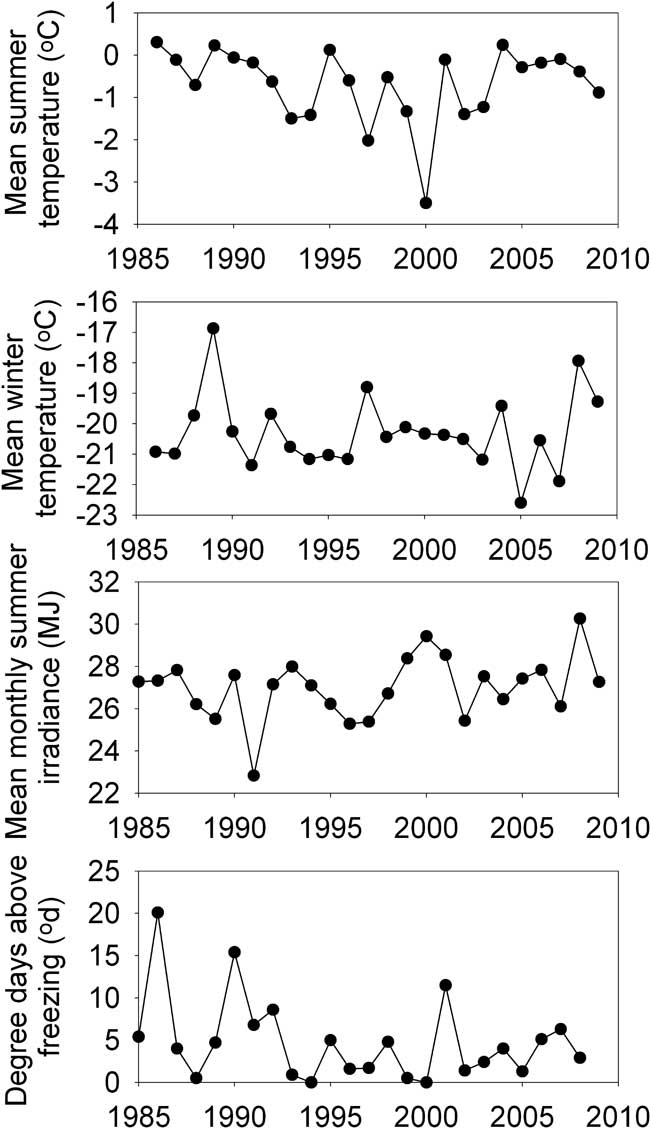
When developing summary metrics for temperature and irradiance to describe long-term variability in conditions at McMurdo Ice Shelf, we considered that the short period when meltwater is generated is likely to act on pond dynamics in different ways than the longer winter period when snow is accumulating. We therefore calculated mean “summer” values using the months of December and January and “winter” values as using data from May–October (Fig. 2). While irradiance fluctuated only slightly between years, there were marked shifts in temperature, with the period 1993–2004 tending to be the most variable and cold in summer, but least variable and warmest in winter. Degree days above freezing would be expected to be related to air temperature and irradiance, although this was not evident in Fig. 2. Rather peaks in DDAF were evident in specific years, which were neither very warm nor very bright.
Average summer (December–January) and winter (May–October) temperatures, mean monthly irradiance and degree days above freezing (DDAF) at Scott Base over the study period. Summer temperature, irradiance and DDAF calculations spanned years and points are plotted such that 1998–99 data are plotted at 1999, to correspond to the year in which that summer's samples were taken, which was always in January.
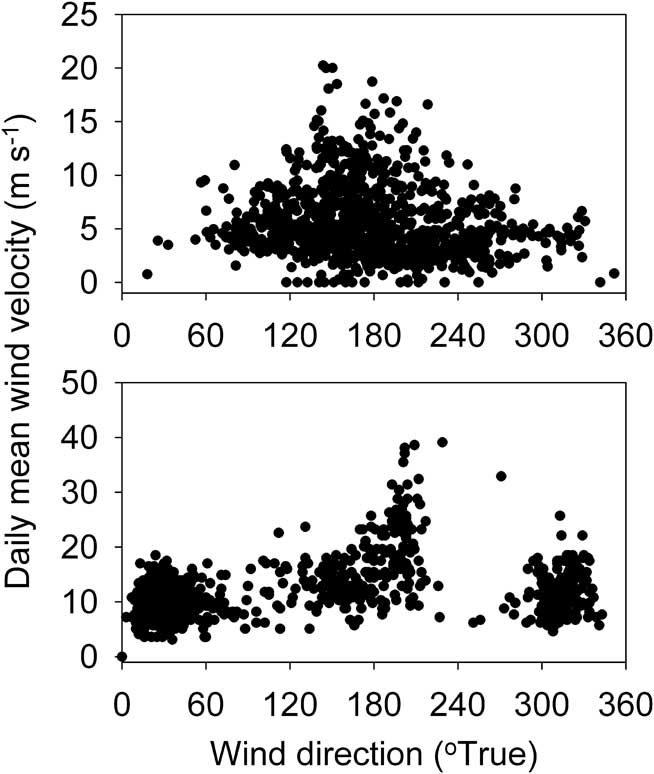
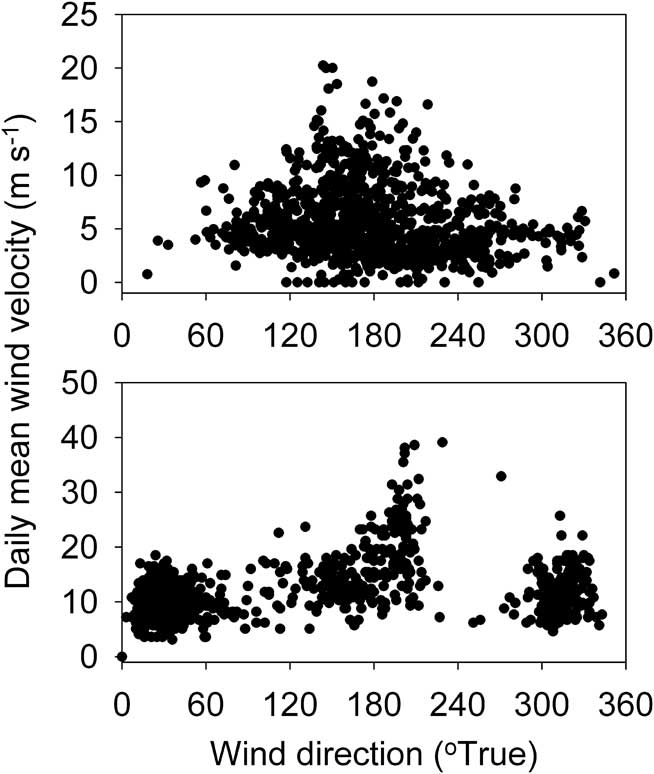
While useful correlations between air temperature and irradiance were found between MIS and Scott Base, this was less evident of wind. A statistically significant correlation was obtained between wind velocities at the two sites, as would be expected from two such close locations, but the predictive precision was low (r 2 = 0.31, n = 960, P < 0.001). When we compare direction-velocity plots for the two sites (Fig. 3) it is evident that most winds at the MIS site, and all the stronger ones, blow from the south-east to south-west quarter whereas at Scott Base, while strongest winds tend to also come from a southerly direction, many moderate winds blow from the north-east. North-east winds are missing from the MIS data. This is a function of the topographic setting of Scott Base, where wind direction is influenced by its situation on the southern side of the Hutt Point Peninsula, below Mount Erebus, which deflects moderate east and south-east winds to come from the north-east quadrant (Simpson Reference Simpson1923), whereas the site on the MIS is more open.
Wind direction and velocity for the McMurdo Ice Shelf (top) and Scott Base (below). Only days when data from both sites are available have been plotted.
Delivery of water to the ponds is likely to be primarily due to melting of accumulated snowfall. However, no measures of snowfall are available for either location, and snowfall in Antarctica is anyway often unrelated to snow accumulation within a catchment since it is frequently redistributed by strong winds. A proxy for snow accumulation is hard to identify. However, relatively warm temperature during winter at Bratina Island tends to correspond to periods of strong southerly winds (Hawes et al. Reference Hawes, Schwarz, Smith and Howard-Williams1999). Such warm “blizzard” conditions, during which snow accumulates have been recognized in this region since the beginning of human occupation (Simpson Reference Simpson1923) and there is evidence to suggest that the majority of precipitation in the southern Victoria Land coastal region comes from air masses associated with the Amundsen Sea Low and circulating northwards along this coast (Patterson et al. Reference Patterson, Bertler, Naish and Morgenstern2005). Monaghan et al. (Reference Monaghan, Bromwich and Schneide2008) have shown for Antarctica in general that warming trends tend to correlate with increased snowfall. Warm winters at Scott Base were therefore considered a possible indicator of frequent warm and snow-accumulating conditions at the MIS, and we have calculated winter temperature as the average daily temperature from May–October (Fig. 2).
Abiotic variables
Conductivity
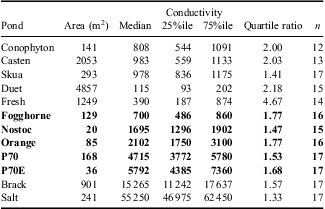
Conductivity of the ponds of the MIS (Table I) varied both between ponds (medians ranged from 115–56 300 μS cm-1) and within ponds. However, the variation was considerably less within ponds, and quartile ratios were typically ≤ 2, while occasional very high values in some ponds (particularly Fresh and Casten) resulted in ratios of maximum to minimum conductance ranging up to 15:1.
Conductivities of the study ponds over the period 1990–2010. Samples were taken as close as possible to 15 January, but were not taken in every year. Values are medians, 25 and 75 percentile and the ratio of maximum to minimum. n indicates the number of years for which data were available. All values are in μS cm-1. The values shown in bold are those of the largest coherent group of ponds, in which changes in conductivity were correlated.

Three of the ponds in Table I share a characteristic that separates them from the others, in that their hydrology has changed over time. Skua and Casten ponds (unofficial names) both partially drained during the course of this investigation, and Skua pond captured a small stream that now flows regularly through it and on into Casten pond. In contrast Conophyton pond (unofficial name) became connected to a neighbouring pond for several years when the latter's water level rose. The connection was broken after some years. These events add another dimension to interannual variability insofar as they highlight the critical role of historical changes induced by warping and cracking of the ice shelf in determining the current characteristics of pond ecosystem, and for this reason we have largely removed Skua, Casten and Conophyton ponds from further analyses of variability.
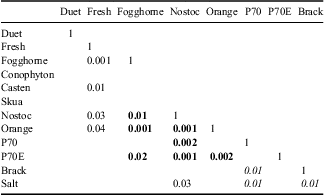
To examine temporal variability in the other ponds, all of which were permanently closed-basin ponds, we first normalized conductivity to pond-specific median, hereafter referred to as ECN (dimensionless). If a regional variable was affecting variability of conductivity, we anticipated coherent behaviour of ECN between ponds - that is that direction and magnitude of change in ECN should be similar across ponds. If each pond was behaving idiosyncratically we expected no coherence. An initial exploration was undertaken using a Spearman rank correlation matrix of ECN (Table II), which identified coherent groups of ponds and outliers in the data.
Spearman rank correlation matrix for ECN (conductivity normalized to pond-specific median) for the twelve study ponds. Significance (P) values < 0.05 are shown. Values in bold represent the largest group of correlated ponds (the small-pond group) and those in italics the “saline” group of ponds.

The outliers in Table II are Duet and Fresh ponds (unofficial names), which correlated with no others. Duet pond stands apart from all others in that it is the largest pond and has always been > 90% ice-covered throughout the summer. The presence of a large volume of ice not only affects the mixing regime, but also provides a reservoir of water to buffer change. It is not surprising that this pond shows no coherence to any others. The other outlier, Fresh pond is unusual in that it loses its ice cover in some, but not all, years. This pond also showed the greatest range of conductivity (Table I), and unusually high conductance in 1990, 2002 and later in 2006–10 coincided with the loss of summer ice cover, and in 1990 and 2002 with years of unusually high DDAF (Fig. 2), while low conductivities tended to be recorded when ice cover was present.
At least two mechanisms exist whereby the absence of ice can enhance conductivity. Firstly, evaporative concentration will be much faster in the absence of ice. The second effect is via wind mixing, which may stir deeper, more saline waters into the sampled volume in the absence of ice. The existence of saline brines at the base of some Antarctic ponds as a consequence of freeze-concentration during winter has now been well established (Wait et al. Reference Wait, Webster-Brown, Brown, Healy and Hawes2006, Hawes et al. Reference Hawes, Safi, Sorrell, Webster-Brown and Arscott2011a). On a number of occasions, although not routinely, we have examined ponds for residual vertical stratification by profiling for temperature and conductivity and have found that the degree to which a brine pocket remained through summer was variable. Nostoc, Conophyton, Fogghorne, P70, P70E, Orange, Fresh, Casten and Duet ponds (unofficial names) have all been found to be stratified in at least one summer, although not in all. We have never found Skua, Salt or Brack ponds (unofficial names) to be summer stratified.
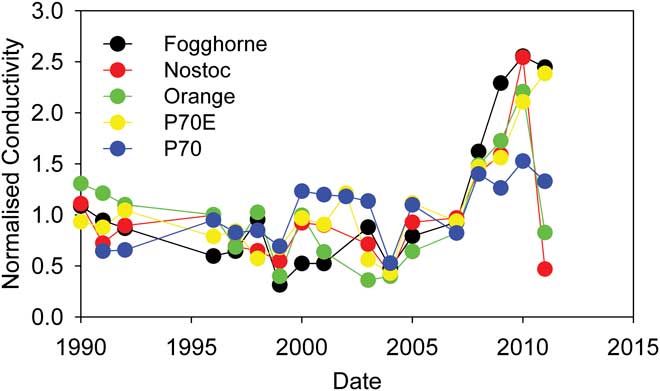
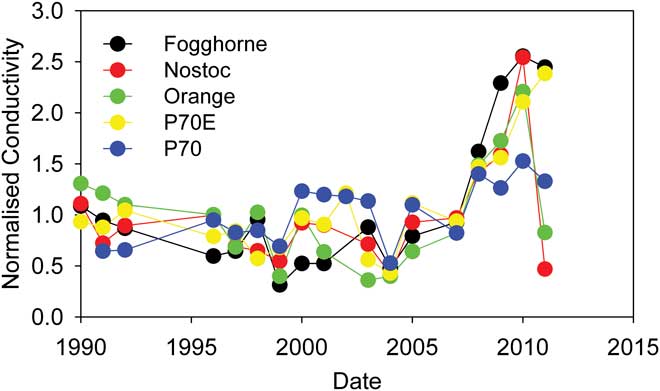
Two overlapping coherent groups remain: Fogghorne, Nostoc, Orange, P70 and P70E (Fig. 4), and Brack, Salt with P70. Each group of ponds tends to have common characteristics. The first, which we term the small-pond group, are all closed basin ponds, of similar (small) size and moderate conductivity (Table I), all of which regularly lose their ice cover, and all of which have been sometimes found to be stratified during the ice-free period. Coherent behaviour of conductivity (Fig. 4) within this group of physically similar ponds may reflect their tendency to respond similarly to factors that affect both the mixing regime and water balance. Correlations of some of the central ponds with others outside of the cluster may reflect shared common propensity to be affected by one of these processes.
Trends of conductivity, normalized to the long-term median, in the group of five “coherent” ponds on the McMurdo Ice Shelf.
The final group of ponds, Salt, Brack and P70 (note P70 was common to both groups) are moderate sized ponds, always losing ice cover but rarely stratifying and includes the ponds with the highest conductivities. Salt and Brack ponds both precipitate salts at their margins, and this reservoir of ions may buffer conductivity from changes to pond volume.
Attempts to correlate ECN to summer or winter air temperature or irradiance were not successful for any single pond. Calculation of annual change in conductance (ECN2-ECN1)/ECN1 was possible when successive years of data were available, but these also showed no significant relationship with either temperature or irradiance. While the presence of clusters of coherent ponds within the conductivity data confirm our hypothesis that variables acting on spatial scales in excess of individual pond catchments were affecting pond conductivity, pond conductivity appears to have been controlled by more than one process that varies in significance according to properties of individual ponds, such as ice cover and vulnerability to mixing. No link was found between the distance between ponds and their strength of correlation, suggesting a broad-scale effect.
Winter snowfall, which tends to accumulate in defined drifts within the pond basins (cf. Eveland et al. Reference Eveland, Gooseff, Lampkin, Barrett and Tacaks-Vesbach2012), is a variable that may explain a mix of coherent and individual behaviour between the ponds. We have no long record of wind fields, winter snowfall and for the moment, it appears that understanding how pond systems respond to climate requires site-specific small-scale understandings rather than the broader variables that we currently possess. The prevalence of small-scale rather than large-scale effects on moisture-dependent systems and processes in continental Antarctica has recently been highlighted in cross-latitude comparisons (Howard-Williams et al. Reference Howard-Williams, Hawes and Gordon2010).
It thus appears that climate may be affecting Antarctic ponds, and it may be acting via water balance as it is Arctic ponds (Smol & Douglas Reference Smol and Douglas2007) and Antarctic lakes (Wharton et al. Reference Wharton, McKay, Clow, Andersen, Simmons and Love1992). However, our data are unable to confirm this or identify a mechanism as conductivity is an incomplete proxy for water balance due to its apparent sensitivity to other factors.
Biotically influenced variables
While conductivity is a conservative variable, most of the others measured in this study are to some extent mediated by biological processes. We had initially hypothesized that these would vary differently to the abiotic variables, and would tend to be more pond-specific and show less coherence.
Dissolved nutrients
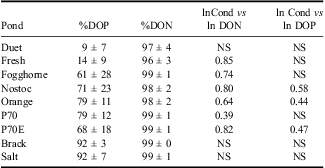
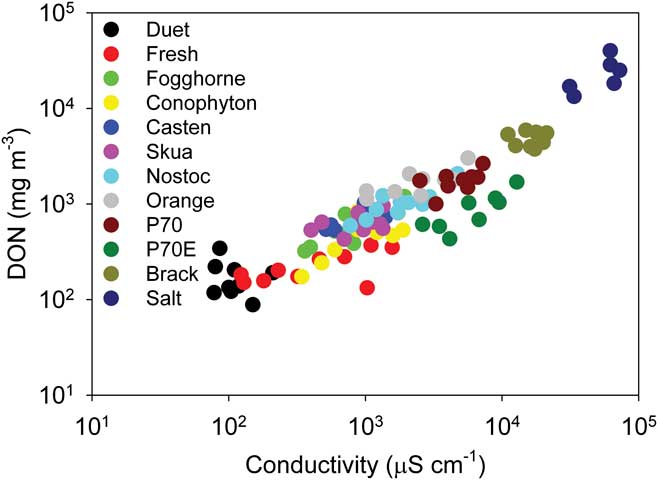
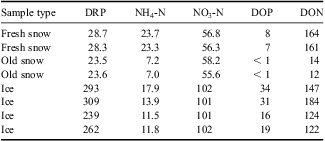
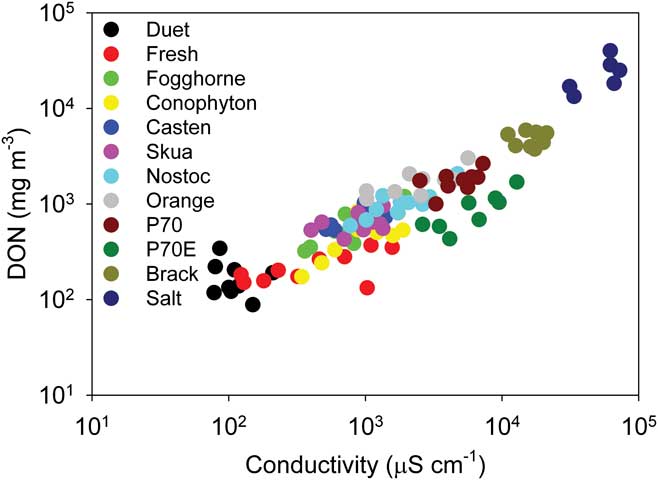
A feature of dissolved nutrients in Antarctic ponds is the unusually high abundance of organic forms, particularly of nitrogen (Howard-Williams & Hawes Reference Howard-Williams and Hawes2007, Hawes et al. Reference Hawes, Howard-Williams and Fountain2008, Reference Hawes, Safi, Webster-Brown, Sorrell and Arscott2011b). Collated data from this study confirms this, with a 12-pond average of 97 ± 3% of dissolved nitrogen in organic form. Phosphorus is also largely in organic form in many ponds, though to a lesser extreme, with a 12-pond average of 55 ± 30%. In most cases we found significant correlations between log-transformed conductivity and DON, and a weaker one with DOP (Table III, Fig. 5). These correlations, and the very high concentrations that can develop (maximum recorded in this study was 40 mg l-1 DON and 780 μg l-1 DOP), suggest that the organic fractions are acting as conservative variables and are largely refractory (Howard-Williams & Hawes Reference Howard-Williams and Hawes2007, Hawes et al. Reference Hawes, Safi, Webster-Brown, Sorrell and Arscott2011b). Indeed, plots of DON vs conductivity for all years show consistent correlations for each pond and also an overlying tendency for relationships between these variables to be similar across all ponds (Fig. 5). If DON and DOP are refractory in this set of ponds, concentrations of these (and conductivity) may reflect the age and history of water balance as much or more than in-pond processes. Because of the strong and consistent correlations of DON and conductivity across ponds, those that show coherent behaviour for conductivity also show it for DON, which we consider to reflect dominance of its dynamics by non-biological processes. Samples of both accumulated winter snow and ice shelf ice taken from below moraine in the Skua pond catchment, melted and analysed using the same techniques as used here for water samples, contained significant concentrations of organic N and P (Table IV), and it is possible that the conservative DON and DOP originates outside of the pond itself.
Proportions of total dissolved nitrogen and phosphorus in organic forms. Also shown is the result of correlation analysis between log-transformed concentrations of dissolved organic phosphorus (DOP) and dissolved organic nitrogen (DON) and conductivity. ‘NS’ indicates not significant at P < 0.05, otherwise the correlation coefficient is shown. n = 10.

The relationship between conductivity and dissolved organic nitrogen (DON) in twelve ponds on the McMurdo Ice Shelf over a 20 year period.
Concentrations of nutrients in melting ice and snow in the catchment of Skua pond in January 2000. All values are mg m-3.

DRP = dissolved reactive phosphorus, DOP = dissolved organic phosphorus, DON = dissolved organic nitrogen.
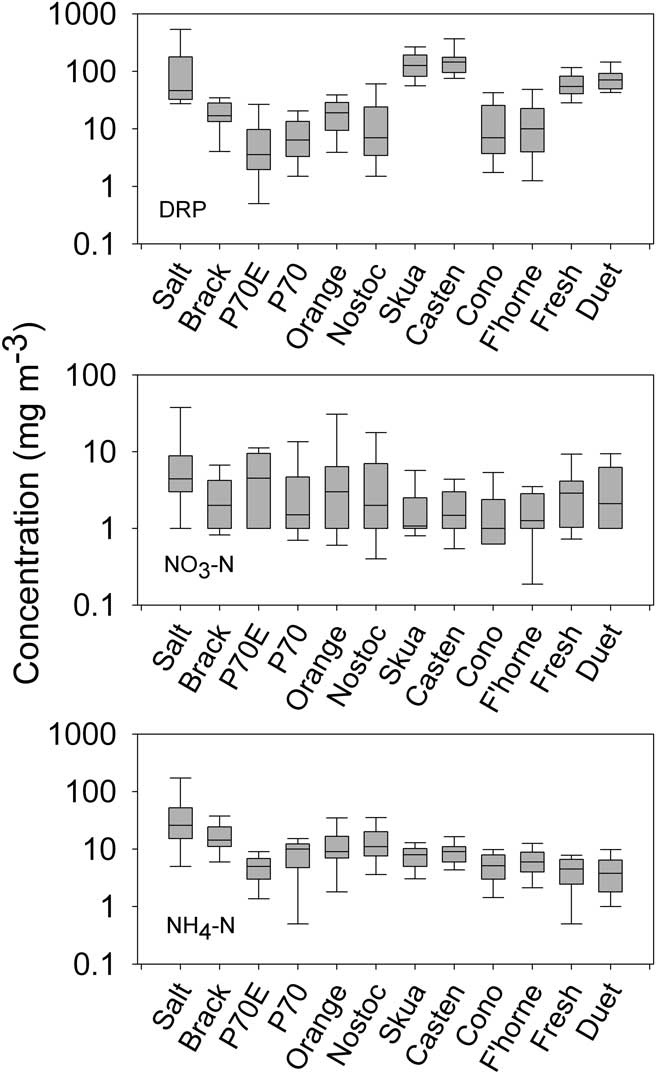
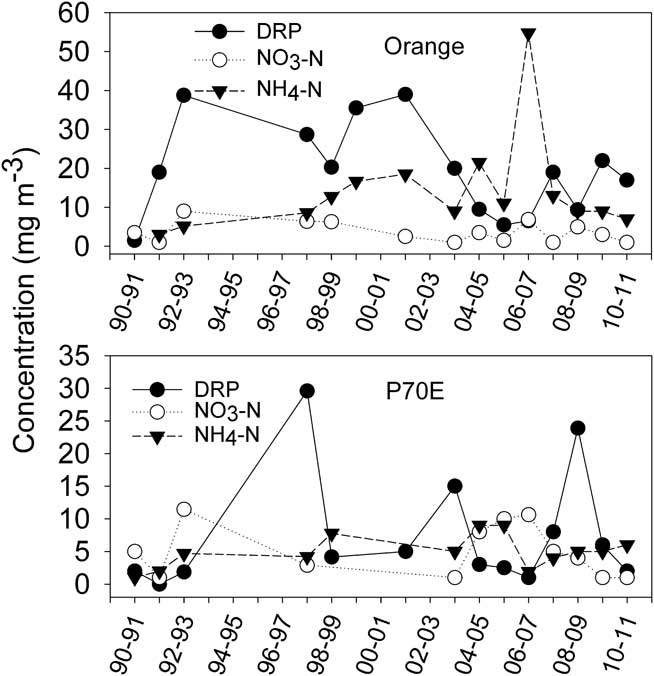
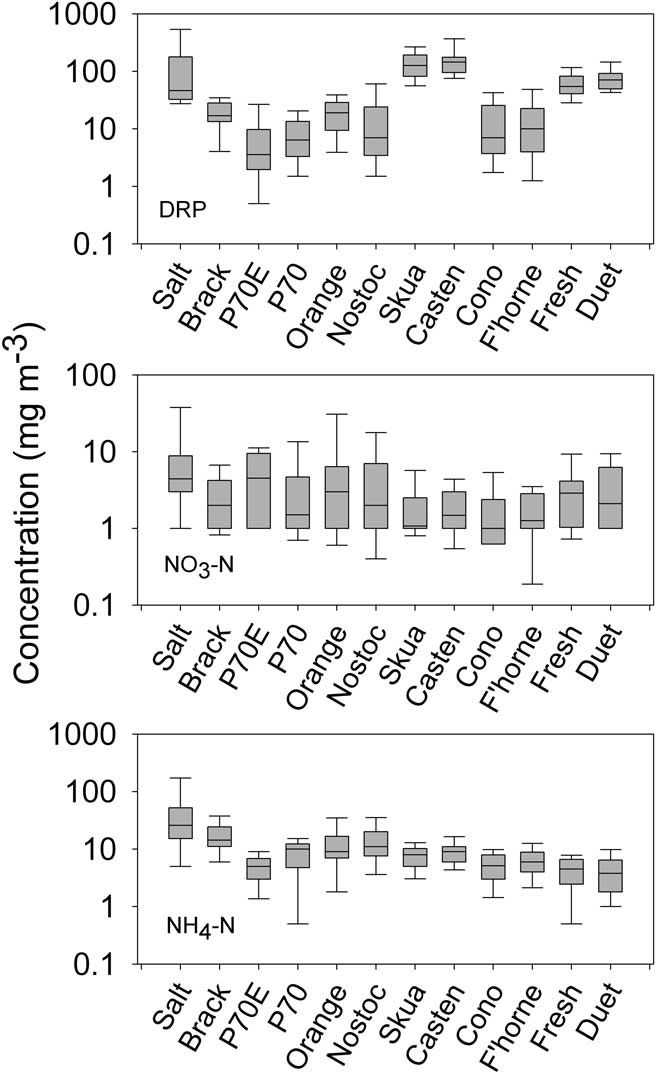
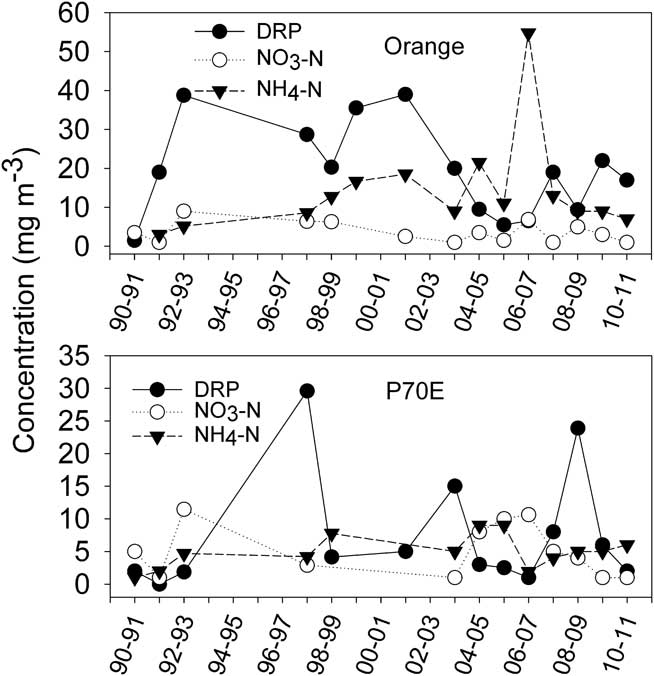
With respect to nutrients other than DON, ponds tended to behave consistently rather than coherently. In any one pond the concentrations of N and P forms tended to be rather constant across the sampling period. Table IV indicates that snow and ice in the catchments of ponds can have high concentrations of inorganic nutrients, particularly DRP which could exceed both NO3-N and NH4-N. In contrast, within all ponds, inorganic nutrients, particularly nitrate, are reduced to very low concentrations (Fig. 6). The low inorganic N:P ratios in snow and melting ice (Table IV) become even lower in all ponds as DRP remains high relative to NO3-N and NH4-N (Fig. 6). The tendency was for all nutrient concentrations to be stable over time, with occasional extreme high values (e.g. Fig. 7). NO3-N in particular showed little variation between years within any one pond, and there was also little variation between ponds - all ponds had median concentrations between 1 and 4 mg m-3 and overlapping quartiles (Fig. 6) - suggesting that in-pond capacity to remove nitrate was high. NH4-N and DRP were again rather consistent within any one pond, although here, consistent differences between ponds were evident. In particular, Skua, Casten, Fresh, Duet and Salt ponds all had very high DRP, and Salt and Brack ponds also high NH4-N. Low inorganic N:P ratios in these ponds suggests that if any nutrient is limiting it is likely to be N (cf. Klausmeier et al. Reference Klausmeier, Litchman, Daufresne and Levin2004) and this may explain why NO3-N was universally low and DRP more variable than either NO3-N or NH4-N. No coherent year-to-year variation was evident between any of the ponds that would suggest that an overarching variable is moderating pond nutrients, and there were no consistent temporal trends. We found no significant correlations between any inorganic nutrient, air temperature, irradiance or conductivity in any pond.
Median, quartile range and extreme concentrations of dissolved inorganic nutrients in twelve ponds on the McMurdo Ice Shelf over a 20 year period. n = 12–14. DRP = dissolved reactive phosphorus.
Temporal variation in the concentrations of dissolved inorganic nutrients in two example ponds on the McMurdo Ice Shelf.
pH
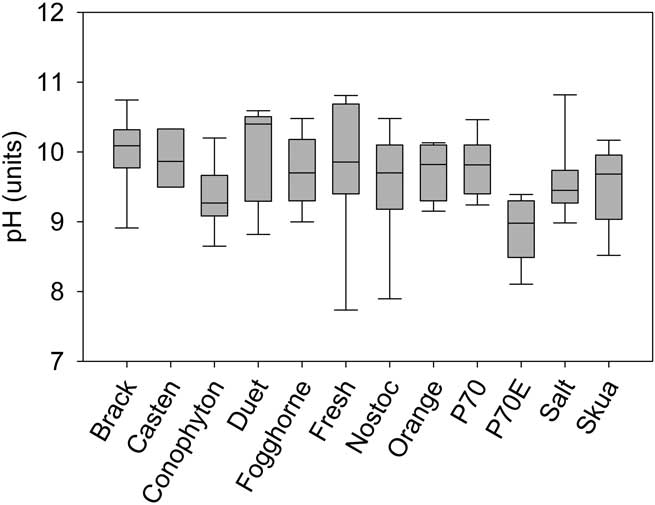
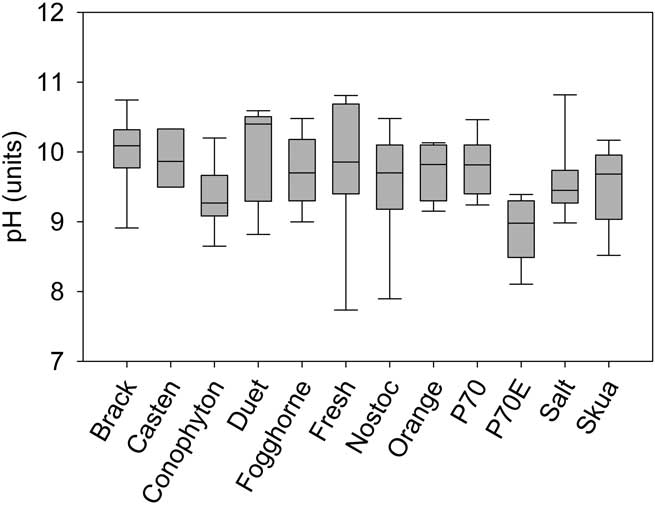
The pH of ponds was typically alkaline, with all showing a long-term median of between 9 and 11, typically with an inter-quartile range of 1 unit (Fig. 8). The exception was P70E which had a lower median of 8.9. Salt and Fogghorne ponds also tended to be consistently less alkaline than the others. We found no coherent behaviour between ponds with respect to pH variation, and no correlation with any other variables, either climatic or pond-specific. High pH is a consistent feature of Antarctic ponds, where it is thought to be related to bicarbonate depletion by the 24 hours of photosynthesis by the extensive photosynthetic mat communities (e.g. Hawes et al. Reference Hawes, Howard-Williams and Fountain2008, Reference Hawes, Safi, Webster-Brown, Sorrell and Arscott2011b, Webster-Brown et al. Reference Webster-Brown, Gall, Gibson, Wood and Hawes2010) and should therefore be considered a largely biologically mediated variable.
Median, quartile range and extreme pH in twelve ponds on the McMurdo Ice Shelf over a 20 year period. n = 12–14.
Planktonic chl a
The pattern of planktonic chl a, a proxy for phytoplankton biomass, was also one of low concentration, occasionally interrupted by unusually high or low values (Table V). As with nutrients, no coherent behaviour between ponds was evident in the timing of unusual concentrations and no consistent temporal trends and no relationship to climatic variables. Previously we have shown how chlorophyll dynamics can be dependent on episodic and short-duration releases of otherwise limiting nutrients from sediments (Hawes et al. Reference Hawes, Howard-Williams and Pridmore1993), and these individual stochastic events appear to overwhelm any other effects in driving planktonic chl a concentrations away from a long-term mean. Neither air temperature nor irradiance were correlated with planktonic chl a.
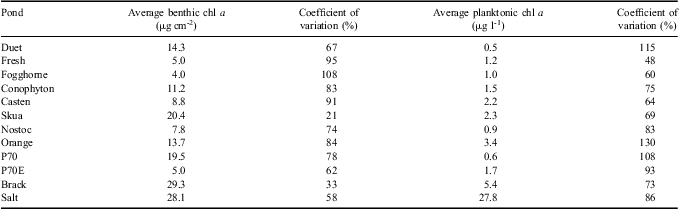
Mean and variability of biomass of benthic and planktonic algae in the twelve study ponds, as estimated from areal and volumetric chlorophyll a (chl a) concentrations.

Regression tree analysis using planktonic chl a as dependent variable, and using all pond/date combinations as input, resulted in limited further insight. The analysis lumped 85% of values, into a low conductance, low DON, low chl a group, with the remaining values divided evenly into two groups with conductance above 4 and 50 mS cm-1, with mean chl a concentrations of 5.5 (± 4.2) and 18.1 (± 15) mg m-3. This simply separated out Brack and Salt from the other ponds.
Benthic chl a
Benthic microbial mats are characteristic of Antarctic ponds, and are known to be perennial, accumulating over many years (Hawes et al. Reference Hawes, Howard-Williams and Pridmore1993, Quesada et al. Reference Quesada, Fernández-Valiente, Hawes and Howard-Williams2008). Unlike annual phytoplankton communities, we can expect them to integrate growth conditions over time rather than reflecting recent growth conditions.
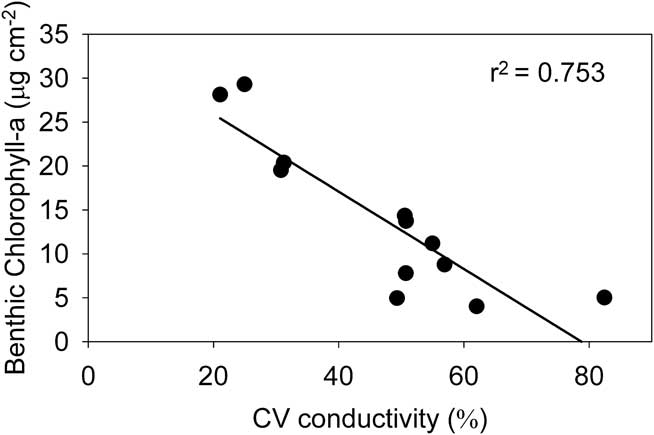
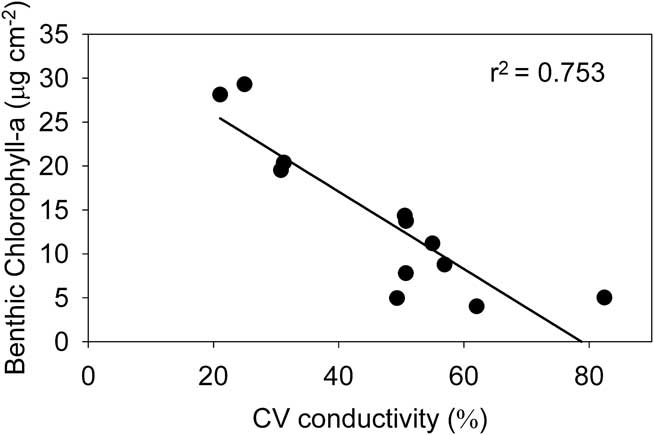
Benthic chl a concentrations were determined on only seven occasions, but these are spread through the sampling period. Results show some degree of consistency within individual ponds but no coherent patterns in the direction of change in any pairs of ponds over time could be seen in this small dataset. Benthic chl a concentration showed large coefficients of variation (Table V), which contradicts the expectation of constancy in a perennial community, and this variance decreased significantly with increasing time-averaged biomass (r 2 = 0.51, P < 0.01, n = 12 ). However, benthic samples are taken at the margins of ponds with fluctuating water levels, and variability is likely to at least in part reflect the exact level sampled, and the time that mats at this level have had to develop between periods of exposure and immersion (Hawes et al. Reference Hawes, Howard-Williams and Vincent1992). For example, an increase in water level between seasons may see an apparent decrease in benthic biomass, simply because mats are sampled from a level where colonization time has been short, whereas a decline in pond level may expose older mats with higher accumulated biomass and show an apparent increase. This explanation is supported by a strong inverse correlation between the variability of conductivity and mean benthic chl a (Fig. 9; r 2 = 0.71, P = 0.001). While the ponds with the highest conductivity also had high benthic biomass, there was no overall correlation between median conductivity and median benthic biomass. We interpret this as suggesting that ponds with the most stable water balance have the highest, and least variable, benthic biomass.
The relationship between variability of conductivity (as coefficient of variation) and mean benthic chlorophyll a concentration in twelve ponds from the McMurdo Ice Shelf. Means and variance are based on n = 10 samplings when both variables were measured.
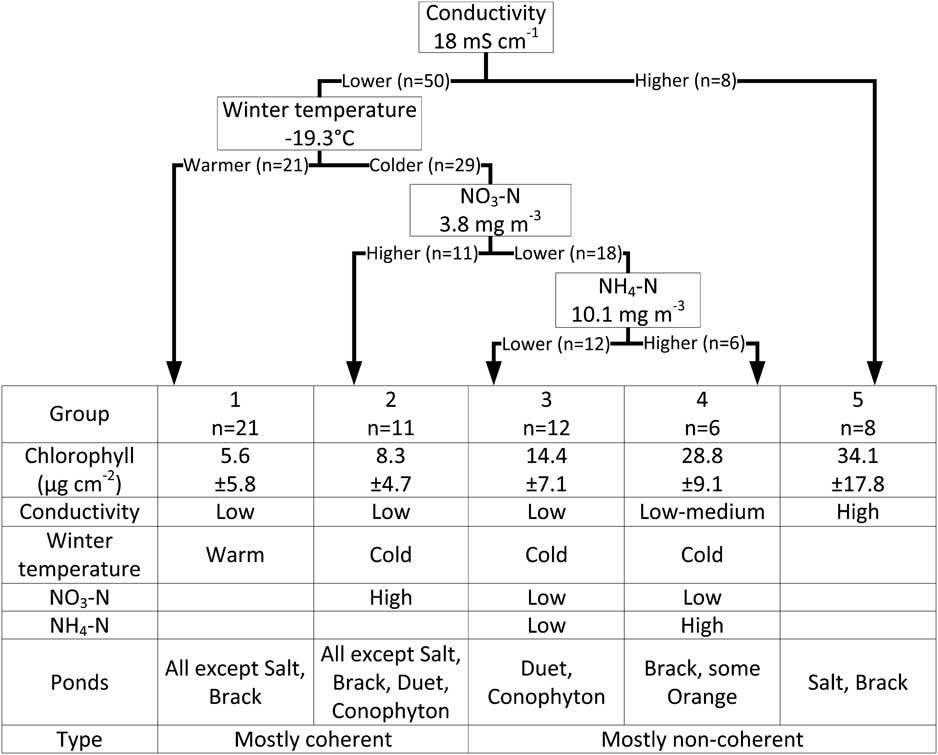
Regression tree analysis, using all time-pond combinations within the 20-year, 12-pond matrix when benthic biomass was measured allows us to consider in more detail interactions between temporal and spatial variation. It explained 60% of the variation in benthic chl a (Fig. 10). The model was well balanced with all of the divisions contributing similarly to explaining its variation and an even spread of data between five groups identified by the analysis. Regression tree analysis showed that the ponds with highest conductance (Salt and most of Brack ponds) fell into a single group, group 5 in Fig. 10 with very high benthic chl a: 34.1 (± 17.8) μg cm-2. The remaining four groups were defined by winter temperature and dissolved inorganic nitrogen species. Regression tree analysis suggests that warm winters, in all but the most saline ponds, were followed by relatively low benthic chlorophyll. Benthic biomass is unlikely to be affected directly by small differences in average winter temperature (when ponds are completely frozen). However, as discussed above, warm winters may be associated with high snow accumulation and may therefore result in rising water levels and this division may be supporting the observation of a correlation between water level variability and benthic biomass.
Regression tree model for benthic chlorophyll a. Critical values for variables associated with each branch are shown. The table below the tree summarizes the characteristics of each regression group.
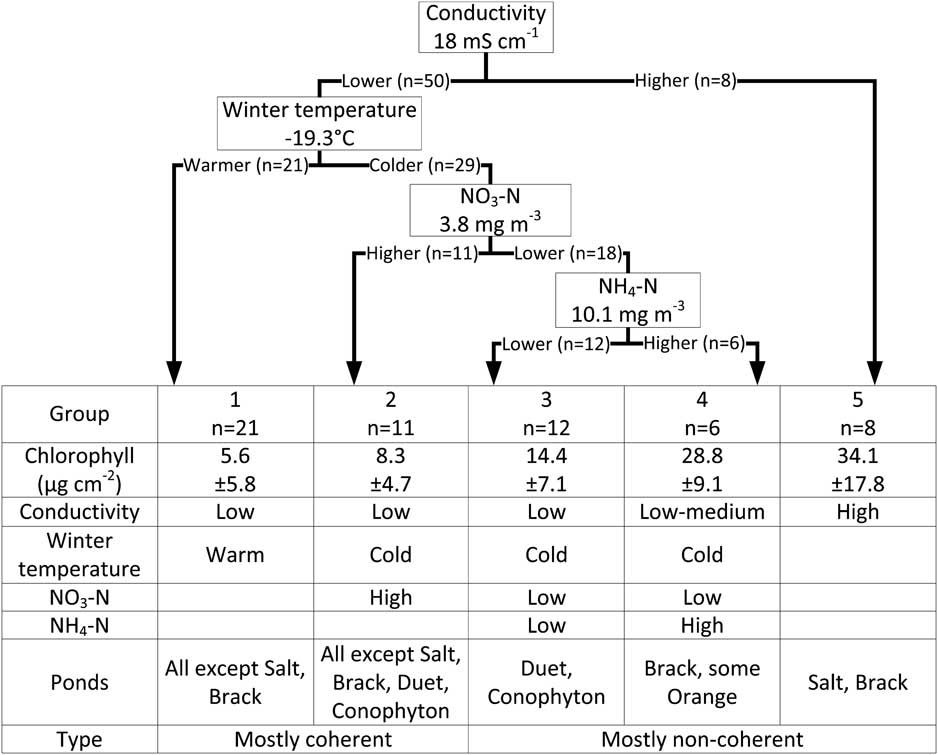
The remaining three groups were divided according to first nitrate then ammonia concentrations. Interpretation of nitrogen-biomass relationship is complicated by the possibility of interactions between nitrogen cycling and benthic biomass. Our data do not allow distinction of cause from effect. Highest benthic chlorophyll in these groups was associated with lowest nitrate and highest ammonium, whereas lowest benthic chl a was associated with higher nitrate. This may reflect the increasing proximity of anoxic conditions, and the attendant denitrification and ammonification, to the mat surface in well developed, high biomass mats (cf. Hawes et al. Reference Hawes, Howard-Williams and Pridmore1993).
Synthesis
The ponds of the MIS have received more attention than most pond systems in Antarctica (Howard-Williams & Hawes Reference Howard-Williams and Hawes2007, Hawes et al. Reference Hawes, Howard-Williams and Fountain2008). In some ways the ponds behave similarly to those on ice-free land, but they have distinct peculiarities because they sit on an ice shelf, which is moving slowly, undergoing topographic changes and cracking and the underlying ice is a source of meltwater. The thermal dynamics of ponds on ice may be different to those on land, and we have previously shown that the ice base represents a significant heat sink at least during autumn (Hawes et al. Reference Hawes, Safi, Sorrell, Webster-Brown and Arscott2011a). Previous studies of MIS ponds have focussed on state variables or on processes that occur over short periods. Here we addressed long-term variability and specifically looked for coherent behaviour between ponds that would indicate variables acting on broad spatial scales. Our expectation was that climate-related variability would be largely driven by water balance in closed-basin ponds, and we have assumed that differences in conductivity represent differences in the balance between water input from melting snow and ice, and water loss from ablation and evaporation. While coherent behaviour of groups of physically similar ponds suggested that an overarching control by climate was occurring, we were unable to identify specific effects from available climate variables. By inference, the ability to predict the effects of climate change on such systems will depend on the ability to predict changes at appropriately local spatial scales. The simplest explanation of our observations of limited and conditional coherence is that small-scale, catchment-specific effects overwhelm any overarching climate control.
The majority of our understanding of Antarctic pond ecosystems and their driving variables is more often based on single site visits (e.g. Sabbe et al. Reference Sabbe, Verleyen, Hodgson, Vanhoutte and Vyverman2003, Taton et al. Reference Taton, Grubisic, Balthasart, Hodgson, Laybourn-Parry and Wilmotte2006, Webster-Brown et al. Reference Webster-Brown, Gall, Gibson, Wood and Hawes2010) than on long-term data. While that approach is often dictated by the restricted opportunities to access remote locations in Antarctica, relationships between environmental and biotic variables that are established by single site visits must be viewed in the light of the knowledge of temporal variability that emerges from the multi-year and within-year sampling from the MIS. Ponds vary over time, coherence between ponds is patchy and we can identify no overarching effect of measured climate variables on pond dynamics. Even in apparently homogeneous areas such as the MIS, it is likely that many-fold variability in habitat characteristics at interannual and inter-decadal periods are not reflected in biotic or abiotic variables at any one time, and that the links between these and with climate may be weakly expressed.
Acknowledgements
This research was conducted over a long period and was dependent on field contributions from a wide range of people. In large part it was funded by the New Zealand Foundation for Research, Science and Technology through contracts CO1X0220, CO1605 and CO1X0306. We would like to acknowledge the ongoing logistic support of Antarctica New Zealand, the National Institute of Water and Atmospheric Research (NIWA) and the University of Canterbury and to thank all participants of the K081 event over many years of research. The manuscript was improved by the suggestions of the editor, one of the fathers of Antarctic limnology, Dr En Kaup, and an anonymous reviewer.