Bombay and Calcutta, two metropolitan port cities, experienced very different patterns of industrial investment in colonial India. One was the hub of Indian mercantile activity and the other the seat of British business. The industries that relied on the export market attracted investment from British business groups in the city of Calcutta. Bombay, on the other hand, became the center of the import substituting textile industry. Indian cotton traders from different communities moved from trade to production of cotton textiles. Few British entrepreneurs were present. British industrial interests exercised monopoly control over various industrial activities in Calcutta and the hinterland. British firms were set up in tea, jute, and coal and here the presence of Indians was minimal. The port cities of Bombay and Calcutta became the railway hub in the course of the nineteenth century as raw materials and industrial goods began to be traded out of these cities
Although geographical factors determined the location of these industries, who invested and why remain questions of interest. Cotton was grown in the hinterland of Bombay and tea and jute in the hinterland of Calcutta. History could matter too. Indian merchants in Bombay had a strong presence in internal as well in the Indian Ocean trade. The trade in raw jute around Calcutta was also in the hands of Indian traders, but these traders were not involved in the export trade. A puzzle is why did British and Indian investment stay separated? Why did British capital flow into some sectors and not to others?
The literature on early industrial development in India has emphasized the role played by British investment and entrepreneurship. Some scholars see it as a crucial factor in the development of an economy scarce in capital, technology, and entrepreneurial skills. (Buchanan Reference Buchanan1966; Anstey Reference Anstey1957) Max Weber claimed that Hinduism dampened the entrepreneurial spirit and led to India's economic backwardness (Weber, pp. 111–14). M. D. Morris criticized Weber, arguing that Indians did become industrial entrepreneurs when conditions were attractive (Morris Reference Morris1967). D. Tripathi sees exposure to western ideas and values rather than religion as a determinant of Indian entrepreneurship (Tripathi Reference Tripathi1971). Others have emphasized the negative impact British rule in circumscribing the sphere of operation for domestic capital (Bagchi Reference Bagchi1972; Ray Reference Ray and Ray1994). This literature emphasizes the discrimination faced by Indian business and the favors received by British entrepreneurs from the colonial state. These favors included subsidized land transfers to tea planters and legislations in support of contracts with indentured workers in these plantations. While this may explain the absence of Indian business interests in Calcutta, it does not explain their dominant presence in Bombay. More importantly in does not explain the small presence of British capital in the cotton textile industry.
This article offers an explanation for the segmented world of industrial investment by British and Indian capital. By matching the volumes of investment by industry type to the ethnicity of the investors, it argues that informational asymmetries can explain why entrepreneurship by ethnic groups was directed towards some activities and not others. Access to information about markets differed across social groups and gave an advantage to specific groups in specific markets. The role of social networks in long-distance trade in history is well researched. Less is known about its role in investment. This article explores the role of social networks in decisions to invest in industry. History plays a role too by providing certain “social amenities” for each social group in a given region. Conditional on the initial advantage, information flows within a network and advantages of “social amenities” led to a segregation of economic activity by social group and showed up in the different investment patterns in the cities of Calcutta and Bombay.
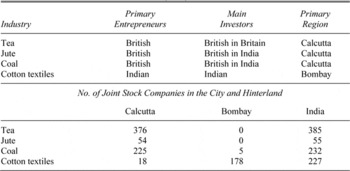
DOMINANT SOURCE OF CAPITAL AND ENTREPRENEURSHIP BY INDUSTRY (1914)

Sources:
Statistical Abstract of British India.
CAPITAL AND ENTREPRENEURSHIP: THE INDUSTRIAL DIVIDE
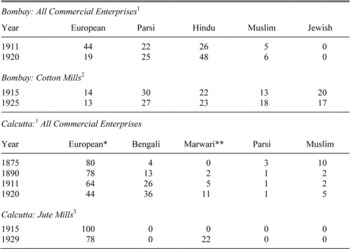
Table 1 summarizes colonial India's industrial divide. Industrial investment in Calcutta and Bombay followed divisions of capital and product markets and ethnicity. Table 2, shows the ethnic divide across the two cities in the first quarter of the twentieth century in commercial activity including its industrial subsector. The racial and regional divide is striking and suggests a chasm between the commercial worlds of the two cities. Was this caused by the history of the two cities or by the informational asymmetries enjoyed by different groups in the different industries? History vs. Information
The history of the two cities, Bombay and Calcutta, differed in terms of the interaction of British and Indian commercial interests. Both had seen the rise of British agency houses as the trading monopoly of the East India Company ended. While some of them ventured into new activities such as coal mining or shipping, their primary involvement was in trade and the China trade in cotton and opium was an important component (Tripathi Reference Tripathi2004, pp. 46–48). The presence of Indian merchants in the east was small. Indian partnerships with British business in joint stock companies such as Carr, Tagore and Company were short-lived (Tripathi Reference Tripathi2004, pp. 67–74). In contrast in Western India, the Indian merchants had a long history in the trading world, including overseas trade using connections of social networks. Their role in the illicit opium trade to China out of the ports in the West shaped their economic importance in the region (Tripathi Reference Tripathi2004, pp. 74–76). With the decline of the trade in opium and shipbuilding in the middle of the nineteenth century, the communities involved in these activities, such as the Parsis, began to look for alternative profitable opportunities (Bagchi Reference Bagchi1997, p. 100).
PERCENTAGE SHARES OF COMMUNITIES IN ENTERPRISES: BOMBAY AND CALCUTTA

* includes American and African firms.
** includes North Indians.
Note:
Shares in total number of enterprises.
Sources:
1Calculated from Bagchi (Reference Bagchi1997, pp. 98, 105); 2 Calculated from Rutnagur (1926, p. 54); 3Calculated from Goswami (1992, pp. 99–100,107).
In the West, Indians had been the brokersFootnote 1 for the East India Company and continued be act as the main brokers for the importers of cotton goods for distribution in local markets. For jute cloth, however, Indian brokers had a relatively small presence in internal trade until the First World War (Timberg Reference Timberg1978, p. 150). It could well be the case that Indian merchants had a special position in Bombay and were able to exploit industrial investment opportunities, which they could not in Calcutta. The history in the two cities had generated some “social amenities” for the groups in the two places in a lexicographic sense. This implies that for a British and Indian entrepreneur there was an advantage being located in a place where there were others of his ethnicity. Therefore Bombay held an advantage for the Indians and Calcutta for the British.
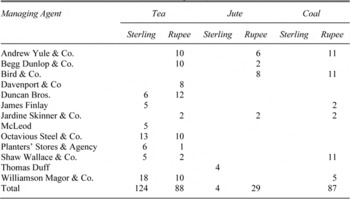
This article examines the informational advantages or disadvantages enjoyed by ethnicity in product and capital markets. Consider two channels of information flowing through social networks. First, potential entrepreneurs might have had information about industries depending on their ethnic group's knowledge of the product market. Second, potential investors, concerned with the risks associated with buying shares in different industries might have preferred entrepreneurs with whom they were socially connected. In the East, tea and jute were export commodities mainly and the British had a valuable informational advantage in these markets. Not surprisingly, the export trade in jute and tea was in the hands of British. Tea was yet to become a popular drink in India. Only 25 percent of jute output was sold in the domestic market. The story for coal is slightly different: demand for coal came from sectors that were dominated by British capital. Railways accounted for over 30 percent of total demand for coal (Buchanan Reference Buchanan1966, p. 264). The cost of transporting coal from Bengal to other region remained high in comparison to the price of imports and Indian industry used substantial amounts of imported coal. After 1900 the price of imported coal increased making Bengal coal competitive in the home market as well as in the nearby export markets (Rungta Reference Rungta1970, pp. 174–75). Indian-owned firms that were in the industry were small and produced poorer quality coal that was sold in the local market. If we turn to cotton textiles, the pattern reverses. The Indian market for cotton textiles was relatively unknown to the average British entrepreneur. Indian traders had long distributed the imports of Lancashire textiles and in doing so had gained knowledge of local markets. These traders became entrepreneurs when the opportunity arose. Moreover, the same traders controlled the sale of raw cotton in Western India and their large profits during the cotton famine provided them with the capital they would need. The cotton traders came from specific communities, such as the Parsis and the Bhatias, who had a long involvement in intra-regional as well as Indian Ocean trade. The importance of this local knowledge is underscored by the fact that of the two British textile producers in India, one had also been involved in the cotton trade and the other was set up by a British technician already working in the subcontinent (Tripathi Reference Tripathi2004, p. 117). From the mid-nineteenth century, changes in company law led to the formation of limited liability joint stock companies (Rungta Reference Rungta1970, pp. 43–45). Companies set up by British entrepreneurs raised their capital in Britain and in India. Firms were either floated on the London Stock Exchange as sterling companies or in India as rupee companies. The sterling companies raised capital in Britain and their shares traded in London. The rupee companies raised capital in India and their shares traded in Bombay and Calcutta. The Brokers’ Exchange, as it was known in Calcutta, was entirely European, while Indian brokers were dominant in the stock market in Bombay (Rungta Reference Rungta1970, pp. 207–08). The British firms were managed by managing agents secured by long- term contracts. These agents held shares in the companies they managed and were either London-based or the Indian counterparts of the British firms. The reputational value of the managing agents was important in the capital market. Even if a new firm was unknown to the British investor, the managing agent associated with it had a reputation (Chapman Reference Chapman1992, p. 123). The managing agency system may be seen as an institutional innovation, which addressed the problem of informational constraints in long-distance investment by providing a trustworthy name to the British investor. This system was universally adopted by British business in Asia. Table 3 shows the involvement of several leading managing agents in different industries. Companies could raise funds from diverse sources. Investors resident in Britain (or elsewhere out of India) invested mainly in railways and public utilities and in tea sterling companies. British expatriates in India (civil servants, army personnel, and business people) tended to invest in tea, jute, and coal rupee companies. Indian investors could only invest in rupee companies either British or Indian. All investors faced informational constraints which could be mitigated by social connection or the reputational value of the entrepreneur. Familiarity with products could also overcome informational constraints faced by the potential investors. An example of the importance of product-market familiarity comes from tea, where the product was present in the consumption basket of the average British consumer. As tea investors were familiar with the product, when tea companies were floated in London in the 1860s and 1870s, they attracted large volumes of sterling investment. On the other hand, jute was relatively unknown to the average British consumer and jute companies in Scotland might have might have been less risky. Only a handful of jute companies were registered in London. It was a product widely used in India for centuries and most of the capital was raised locally from British residents in India looking for profitable investment. While systematic quantitative evidence is scarce, case studies of individual managing agencies indicate that British investors accounted for bulk of the investment. For Bird and Company, nearly 90 percent of the investment in rupee companies in tea and jute came from British investors (Chapman Reference Chapman1992, p. 126). The Indian Industrial Commission of 1918 reported that the Indian shareholders held just over 15 percent of the shares of jute companies (Bagchi 1971, p. 193). The majority of coal firms were set up and managed by British managing agents in India and the investors were British expatriates living in India. Jardine Matheson, the managing agent, argued that it was better to issue shares in India where there was local knowledge (Chapman Reference Chapman1992, p. 124).
CONTROL BY THE TOP BRITISH MANAGING AGENTS IN 1911–1914 (no. of companies)

Note:
There were many smaller agents, some managing one company in any one sector and more in others, some concentrated in one particular sector.
Source:
Bagchi (Reference Bagchi1972, tables 6.5 and 6.6), based on Investors’ India Year Book 1911; and Tea Producing Companies 1914.
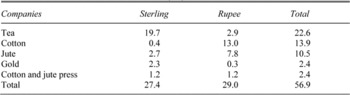
STERLING AND RUPEE INVESTMENT IN 1914–1915 (£m)

Source:
Chapman (Reference Chapman1992) based on Indian Industrial Commission, II, pp. 123, 854.
Indian entrepreneurs in the cotton textile industry relied on their friends and family for capital. The Parsis in Bombay subscribed large parts of the authorized capital of new companies and had the reputation to attract interest from the public (Rungta Reference Rungta1970, pp. 59–60). When Davar, a Parsi, floated the first cotton mill in 1854, fifty leading traders of Bombay provided the initial capital of 500,000 rupees. Most shareholders were also Parsis, but there were others from other Indian social groups as well as two Englishmen (Morris Reference Morris, Kumar and Desai1982, p. 574). Davar himself retained a large stake while other Parsis and Gujaratis subscribed one-third. (Tripathi Reference Tripathi2004, p. 97) Outside Bombay, raising capital by Indians proved more difficult. When Ranchhodlal set up the first cotton mill in Ahmedabad in 1858, most of the shares were bought by his friends and family after he failed to raise capital from the local traders (Tripathi and Mehta Reference Tripathi and Mehta1990, pp. 44–45; Rungta Reference Rungta1970, pp. 60–61). He did not have social connections with the trading communities. Similar situations can be found in the case of other textile entrepreneurs in Bombay, such as the Tata family or Bhatia merchants. When Tata offered shares to a member of another community, a Marwari trader, it was met with skepticism (Tripathi Reference Tripathi2004, p. 121). Members of the Bhatia community were the main shareholders in companies floated by Thackersey, Morarjee, and Khatau, all Bhatia merchants (Tripathi Reference Tripathi2004, p. 121). In Buckingham Mill, one of the few British cotton textile firms, Indian shareholders held only one-tenth of the shares (Bagchi Reference Bagchi1972, p. 193).
Estimates of Investment
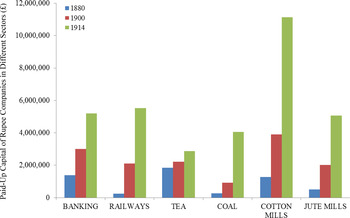
Table 4 shows the breakdown of investment in sterling and rupee companies in 1915. The two largest sectors of investment were tea, dominated by British companies followed by cotton textiles dominated by Indian companies. Data on paid-up capital allows us to track growth of rupee companies from 1880. Paid-up capital is likely to underestimate total investment as enterprises also raised loans from banks and machinery producers (Morris Reference Morris, Kumar and Desai1982, p. 579). British firms also found it relatively easy to borrow from banks in India (Ibid.). The omission creates a relative distortion if some sectors had better access to loans. A more serious problem is that paid-up capital in older firms would be further from real capital because of a longer stream of retained earnings. Our information is not detailed enough to correct for this. Figure 1 presents the relative position of different sectors in rupee investment. In 1880 tea had the largest share. By 1900 there was more investment in cotton textiles than in tea or banking and by 1914 cotton textiles was by far the largest sector of rupee investment.
RUPEE INVESTMENT IN DIFFERENT SECTORS, 1880–1914

Discrimination or Social Networks?
Discrimination against Indian business has been invoked to explain their absence in several major industries (Bagchi Reference Bagchi1972; Ray Reference Ray and Ray1994). Indian entrepreneurs were shut out of the higher echelons of British business in Calcutta. As late as 1911, less than 4 percent of tea company directors were Indians; in jute there were none (Chapman Reference Chapman1992, p. 122). Moreover, industrial associations for tea and jute were exclusive clubs for Europeans. The London Jute Association, for instance, did not accept Indians and therefore acted as a barrier to entry in the export market (Ray Reference Ray and Ray1994). A different view of discrimination is that British capital entered those sectors which were complementary to their domestic industrial interests (Sen Reference Sen and Ray1994). But if we take jute, this argument does not seem to carry much weight. Indian jute products were substitutes for those produced in Dundee and gained market share. If they were trying to enhance manufacturing at home, British entrepreneurs would not have tried to create a rival industry in Calcutta. In fact, British industrial interests were not a homogeneous group. The interest of Lancashire textile producers differed from those of machinery producers. There is much evidence to suggest a close cooperation between Indian textile entrepreneurs and British textile machinery manufacturers. Davar who set up the first textile firm in Bombay, for instance, was advised by Platt Bros. from Oldham on the type of machinery needed.Footnote 2 British machinery makers encouraged the development of foreign textile producers: they offered large commissions to promoters and accepted deferred payment. In the case of discrimination or barriers to entry, rates of return on investment must differ across sectors. The sector which had barriers to entry (British-dominated export industries) should have had higher rates of return. M. D. Morris suggests the opposite held: Indians focused on high rate of return sectors because traditional activities such as trade and commerce already had high returns. The average rate of return in money lending, internal trade, and real estate transactions was 9–10 percent (Tripathi Reference Tripathi2004, p. 80). Indians entered jute only after the jute cartel pushed up profits, consistent with view that Indian entrepreneurs required a high rate of profit (Morris Reference Morris and Ray1994, pp. 136–37). Similarly, efforts to raise capital for the railways in India had not succeeded. Out of over 50,000 British shareholders in 1870, only 368 were Indian (Morris Reference Morris1967). British investors were inured to modest returns. Risk adjusted returns on investment in the empire were a bit higher than for investment in domestic (English) securities (Edelstein Reference Edelstein1976). Thus it is no surprise that a guaranteed return of 5 percent from Indian railroads was attractive to British middle-class investors (Macpherson Reference Macpherson1955). Morris's argument, if correct, might explain why Indians did not invest in the industries dominated by the British. However, this view still does explain why British investors shunned Indian cotton textiles. Informational disadvantage could discourage entry despite other advantages enjoyed by British business groups. Morris was the first to recognize that familiarity with markets can explain why the spheres of investment were different for British and Indian capital (Morris Reference Morris1979). Informational differences gave each social group a different assessment of profitability of a sector. Morris argued that Europeans tended to get involved in markets that were export oriented or closely supported by the state (Morris Reference Morris, Kumar and Desai1982, p. 580). However his view that Indians were drawn only to sectors with higher returns contradicts the view that barriers to entry were enforced by privileges of colonial connection in the export sector and that there were no barrier to entry in the import substituting sector. Higher rates of return in Indian-dominated sectors could only persist if there were barrier to entry for British entrepreneurs or investors. There is no evidence of such a barrier in the cotton textile industry. The next section proposes an alternative framework, where the rates of return equalize across sectors, but entrepreneurship is segregated by ethnicity.
INFORMATIONAL CONSTRAINTS AND SOCIAL NETWORKS
Only a quarter of British capital went to the empire of which only 30 percent went to the colonies under British rule, with India receiving two-thirds, or 5 percent of the whole (Davis and Huttenback Reference Davis and Huttenback1985). R. E. Lucas, in his well-known article, argued that British capital flows to India were surprisingly low even during the colonial period when the threat of expropriation was low and returns were high (Lucas Reference Lucas1990). One explanation might be, as Lucas argued, the imperial power restricted the volume of investment to keep returns high. This was not the case in British India. On the contrary, London encouraged large inflows of capital into Indian railways by guaranteeing favorable rates of return (Thorner Reference Thorner1951).
A. L. Bovenberg and R. H. Gordon set out a model of asymmetric information to explain why capital flows do not equalize returns across countries. They consider a situation where domestic investors are better informed about the quality of the investment project than foreign investors. Foreigners fear being overcharged and hesitate to buy equity. Thus asymmetric information between foreign and domestic investors prevents capital from flowing to high return economies (Bovenberg and Gordon Reference Bovenberg and Gordon1996). Analyses of recent cross-country equity flows support these implications (Portes, Rey, and Oh Reference Portes, Rey and Oh2001). Portes, Rey, and Oh estimate a gravity model for capital flows and find that distance has a significant negative effect. The results suggest that local producers have better information about local markets and foreign firms are reluctant to undertake long-distance investment even when political risks are minimal.
Here, I assume information flows better within social groups than across groups. In this case, members of a community will make similar decisions. For instance, community members migrate en masse. There are many examples of this. Bhatia merchants moved as a group from Surat to Bombay as the city began to grow in the eighteenth century (Tripathi and Mehta Reference Tripathi and Mehta1990, p. 77). Marwari traders moved as a group from Northwestern India towards the East in search of new business opportunities (Timberg Reference Timberg1978, pp. 92–93). Before moving to the empirical evidence on the effect of social networks on investment and entrepreneurship, let us develops a simple framework of informational asymmetry and social network effects to structure the discussion.
Consider two sectors, the export industry and the import substituting industry and two ethnic groups: British and Indian. The British are favored by the colonial state, better connected to exporting firms, shipping companies, financial institutions, and have better knowledge of export markets. The Indians are worse in each of these matters but have better local connections and better knowledge of local markets. The distribution of information implies that British entrepreneurs favor export industries and Indians favor import-substituting industries.
In this setting, we consider two different scenarios: one where barriers to entry cause separation by ethnicity and a second where social networks offer additional advantages so that an individual strictly prefers locations with more members of his or her ethnic group.
Scenario 1: The privileged social group creates barriers to entry using political and social connections through say the use of state support or formation of industrial associations. In the context of colonial India, these barriers would affect the export sector but not the import- substituting sector. Indeed, Indian entrepreneurs did not have access to the export market or the London capital market. Moreover, British firms were favored in their access to new technology and by legislation had better access to product and factor markets, such as laws of indenture in the tea industry, export quotas to aid cartelization in tea, or subsidized allocation of land.
In this case, the export sector would only have British firms and the import-substituting sector would be ethnically mixed. Returns in the import-substituting industry will be less than or equal those of the export industry, as entry barriers operate in one direction. This may be defined as a “hard network,” where segregation in one sector operates through political or social entry barriers. This supports the discrimination view.
Scenario 2: Individuals derive utility from social or political amenities that have no direct business purpose. Instead, other aspects of life are valued, for instance clubs, religious organizations, or any non-business organization. History shapes preferences in such a way that the menu of desired amenities varies across (but not within) ethnic groups. History also produced conformity namely a preference for interactions within a social group (Bikchandani, Hirschleifer, and Welch Reference Bikchandani, Hirschleifer and Welch1998; Epstein Reference Epstein, Epstein and Gang2010). We may call these “soft networks.”Footnote 3 These arise not due to formal mechanisms of discrimination as in the case of “hard networks,” but due to advantages arising from interactions within a social group. Even then, we suppose that each individual always seeks out the sector with the highest rate of economic return and if the returns are equalized, only then, factors in the presence of amenities that cater to the ethnic group in question. In short, an individual uses economics first, and then extra-economic amenities surrounding a sector to decide which sector to invest in.Footnote 4
Consider the following simple model: say there are an infinite number of potential entrants in each of two ethnic groups. There are two sectors, A and B with a large number of specific profit opportunities (niches). An entrant in sector i, where i = A or B, will make profits given by Pi = fi (mi ), where mi is the mass of individuals already in sector i, and fi is a continuous function that decreases to 0 as mi goes to infinity.
Any initial entrant observes only imperfectly which niche is profitable. The pioneer can enter either industry and select a niche. The entrant will earn monopoly profits initially. The pioneer gets a signal high or low about each sector and the quality of the signal determines the probability that the sector is profitable. The pioneer's posterior probability that the sector is profitable is p if the signal is high and 1 – p if the signal is low (p > 0.5).
Followers face competition and congestion, from the initial entrants. Members of a community learn the profitability of a niche once another member has made a successful entry in that industry, thus entering an industry where another member is already present reduces their risk. On the other hand, an entrepreneur who enters an industry whose current producers are not from his group gets no informational benefits.
Assume for simplicity that in each industry, there are several niches, indexed by i ∊ {1,2 n}. Only one of these niches is profitable, and each of them has equal prior probability. Let L be the loss suffered by entering an unprofitable niche. Let Gi be the gain from entering a profitable niche in industry i, i {A,B}. We assume that Gi is a random variable that is independently and identically distributed according to density f on [G, G∘].
At each date t, one individual (drawn at random) chooses to enter a niche. The individual has a signal high or low depending on past experience. For the first entrant, the signal is given at p < 1. Assume that there are no sunk costs and that the expected profit from entry (without any additional information), is, pGi + (1 – p) L – c, where c is the cost of capital.Footnote 5
Let G∘ such that pG∘ + (1 – p) L – c = 0 is the threshold profit needed for entry. Once an individual enters, he finds out whether the niche is actually profitable (and he continues in the industry) or not and then he exits at the end of the period.
For followers, the quality of signal depends on who they would be competing with. If prior entrants are of their ethnicity, the signal is more accurate than if the prior entrants were not of the follower's ethnicity (p is high for the British in the export industries and high for the Indian in the import substituting industries). We make the sensible assumption that (1) if someone is producing in the industry, observers know that the industry is profitable. We also assume that if for prior entrants of the same ethnicity, the follower learns the specific niche the prior entrants have chosen and what profits are. Thus, he now believes that the probability that this niche is profitable is 1 rather than p. As in the models of herd behavior, the follower will ignore his own information and the signal he observes and follow the first entrant (Banerjee Reference Banerjee1992; Bikchandani, Hirschleifer, and Welch Reference Bikchandani, Hirschleifer and Welch1998).Footnote 6 However, in this case, he has to share profits with the current incumbent, and his payoff is GA (m) < GB .
More generally, let Gi (m) denote the profits when m firms are already in the market, which is assumed to be decreasing in m. Thus for any value of Gi , there exists m * (Gi ) such that at most m * firms can profitably enter. Note that this value of m * assumes that firms perfectly know which niche is profitable. Therefore, m * followers of the same ethnicity as the first entrant will be willing to enter. Now consider a member of the other community. Even if he receives a high signal, he will know with probability p < 1 that it is profitable and that he will not earn monopoly profits. Suppose he has received a high signal for both industries because he gets no inside information, he faces a choice between pGA (m) + (1 – p) L – c if he enters the industry of the other community and pGB + (1 – p) L – c if he pioneers the new industry. He will be a pioneer as long as GA (m) < GB . Suppose he has received a high signal for the industry of the other community and a low signal for the new industry. He then faces a choice between pGA (m) + (1 – p) L – c and (1 – p) GB + pL – c. If GB is sufficiently large relative to GA (m), he will be a pioneer in a new industry. Clearly then the most likely case for a mixed industry is if both ethnic groups enter early on.
If he has to choose to be a follower in both industries, then his choice is between pGA (mA ) +(1 – p) L – c and GB (mB ). In the absence of massive differences in entry rate, he will chose industry B where he is better informed. Under a wide range of conditions, thus, the followers prefer to enter industries where they are better informed. A key assumption here is that entry rates relative to market size are not significantly different across the different sectors. If British entry was slower, then the decline in rate of return in the British sectors would be slower encouraging outside firms to enter. This assumption is reasonable if early entrants invest in social network to build a viable group in the industry as in K. Munshi (Reference Munshi2011).
Thus consistent with the “soft network” view, industry A and industry B's entrepreneurs are likely to be segregated and if these entrepreneurs are located in distinct regions of the country industries will arise in different locations. If groups are large enough that entry drives profits down, in the long-run rates of return will equalize unless outside options are different.
The soft networks model generates complete segregation and also the equalization of the rates of return across sectors. A model of hard networks can also generate complete segregation, but there is no reason why the rates of return should be equalize across sectors. This is a testable hypothesis to be taken up in the following section. If economic returns are not systematically higher in the export sector, then the discrimination view represented by hard networks may be questioned and the effect of soft networks with informational asymmetry is more plausible.
The model assumes that the profitability of the industries is stationary over time and varies only with the number of entrants. This is a simplification and the model can be extended to allow for the profit opportunities to change over time across industries. It can be modeled by assuming that Gi (m) fluctuates. In this case, it may become unprofitable for a new follower to invest in his home industry even if perfectly informed. He may prefer to invest in the other industry even if he is less informed. Similarly rising profitability of an industry may induce members of the other community to enter even in the absence of full information. The logic applies both to entrepreneurs and to investors. Indeed high dividends could encourage “outsiders” to buy shares even if they were not socially connected to the entrepreneur. The size of the group of “outsiders” can increase though information flow within the social network and once the share ownership reaches a critical minimum, it can encourage entry into the industry from that social group. The jute industry is a case in point. Marwari Jute traders began to acquire shares in British firms during the First World War and entered as entrepreneurs in the 1920s. The Marwaris did not take over British firms, but set up new firms. As predicted by Munshi's framework (Reference Munshi2011), in this case too, several firms from a social network entered at the same time and became a viable group. With this framework in mind, I turn to the empirical exercise.
EMPIRICAL STRATEGY
Knowing that investment and entrepreneurship was segregated, I examine whether rates of return differed across export and import substituting sectors. I also try to rule out explanations that suggest barriers to entry. If discrimination against Indian capital or the privileges enjoyed by British capital explain the different spheres investment, then it should be possible to measure economic attributes that differ across export and import substituting industries.
Hard vs. Soft Network
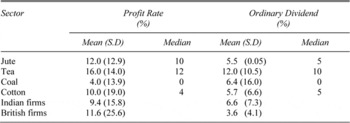
The first test addresses returns. With hard networks, rates of return will differ across industries, but they might equalize with soft networks. Further with hard networks, profit rates should be higher in the export (British) sector. Existing estimates suggest an average rate of profit of 9 percent in jute, an export industry and 10 percent in cotton textiles, an import substituting industry (Morris Reference Morris, Kumar and Desai1982, p. 572). In this article, profits rates in 1910 for four industries are constructed using firm-level data (see Table 5). There were no systematic differences in profits across export and import substituting sectors. Cotton and jute showed comparable mean profit rates, while tea had a higher return. Coal shows a much lower profit rate with the median firm making no profit. Higher dividends were paid in tea, but comparable rates were paid in jute and cotton, which are comparable industries. If lower median profit rate discouraged British business in cotton, this was clearly not the case in coal. Lastly, I examine profit rate and dividend rates for British and Indian firms in the cotton textiles industry. Indian firms show a lower profit rate compared to British firms, but paid out higher dividends. A T-test shows that these differences are not statistically significant.
PROFIT RATE AND DIVIDEND ACROSS SECTORS IN 1910

Notes:
Profit Rate is calculated as a ratio of net profit and paid-up capital.
Sources:
Investors’ India Year Books, 1911–1913.
Measuring Constraints
The next step is to ask if Indian entrepreneurs were prevented from entering certain industries. First, did the minimum efficient scale differ across sectors? If Indian entrepreneurs had a disadvantage in raising capital through the stock market or had limited access to credit from the formal British-owned banking sector, they would be more likely to enter industries where the initial capital outlay was lower. If scale economies did not matter then, in any given industry, firms started by Indians would tend to be smaller. Both propositions are tested using firm-level data.
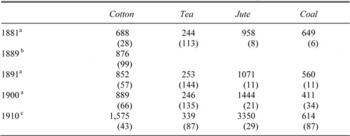
AVERAGE PAID-UP CAPITAL OF RUPEE COMPANIES, RUPEES ‘000

Note:
Figures in parentheses indicate the number of firms.
Sources:
a Based on Rungta's industry-level information (Reference Rungta1970, appendix 17).
b Based on firm-level information from Bombay Millowners Association Report, 1889.
c Based on firm-level information from Investors’ India Year Book for 1911.
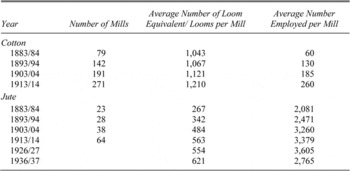
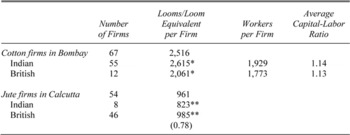
Table 6 presents comparative paid-up capital from different industries using both aggregate data from R. S. Rungta and firm-level information from various sources.Footnote 7 It shows that the average paid-up capital in cotton mills was lower than in an average jute mill from the 1880s to 1910. However, the average coal or tea firm was smaller than the average cotton firm. The absence of Indians in these sectors indicates a relatively minor role of a capital constraint. Table 7 focuses on the two comparable industries, cotton and jute, and provides measures of machinery used and employment. Although the machinery employed is not directly comparable across the two sectors, looms are required in both for weaving. Many cotton firms produced a large quantity of yarn as the finished product. Therefore cotton textile firms count both spindles and looms and aggregates them on the basis 30 spindles per loom equivalent. Although the loom equivalent is higher for cotton mills, jute firms employed significantly more labor. This seeming anomaly is partly due to the aggregation problem. About two hundred spindles could be operated by one worker whereas one worker attended to one loom. Both capital outlay and number of workers were higher in the jute firm. The firm size and the minimum efficient scale could have given Indian entrants a disadvantage if they were capital constrained. However, it has already been noted that such an argument cannot be used to explain the absence of Indian entrepreneurs in tea and coal.
LOOMS AND EMPLOYMENT IN COTTON AND JUTE TEXTILES

Source:
Loom Equivalent for Cotton has been calculated using data from Morris (Reference Morris, Kumar and Desai1982, p. 576). Jute is based on Morris (Reference Morris, Kumar and Desai1982, pp. 569, 615).
Notes:
For cotton, we aggregate looms and spindles into a loom-equivalent by multiplying spindles by 0.033, and adding the number of looms. See Gupta (Reference Gupta2011) for details of the estimation.
The second test for capital constraints is to see if there is difference in size between British and Indian firms, in industries where they coexist. If capital constraint was systematically greater for Indians then their firms would be smaller than British-owned ones. Firms are compared within the industries: cotton and jute. Note that Indians were the majority group in cotton, but a minority in jute and the opposite holds for the jute industry. This procedure has the advantage that it can use a physical measure of capital, the loom equivalent, rather than a value measure, since it only makes intra-industry comparisons. On the basis of the measure of loom equivalent and looms, comparisons can be made across firms according to ownership for the year 1924.Footnote 8 Table 8 shows that in each industry, the majority group always has the larger firms, although the difference is not statistically significant. In the cotton textile industry in Bombay, the Indian firms on average were larger than the British firms, while in the jute industry, British firms were larger. Thus the initial hypothesis, that Indians were uniformly more capital constrained, is not borne out. Instead, it appears that the minority group might have faced more difficulty in raising capital.Footnote 9 If capital had been a constraint for Indian firms, then British firms would tend to be larger in all sectors. I compute the capital-labor ratio in mills run by different communities in cotton textiles in Bombay to test for systematic differences. The ratio was similar across all other groups and the British firms were not more capital intensive (see Table 8).
AVERAGE MACHINERY AND EMPLOYMENT BY CATEGORY OF OWNER, 1924

* T-statistic for the difference between these numbers is 1.4 (not significant at the 5 percent level).
** T- statistic for the difference between these numbers is 0.8 (not significant at 5 percent level).
Notes:
For cotton, we aggregate looms and spindles into a loom-equivalent by multiplying spindles by 0.033, and adding the number of looms. See Gupta (Reference Gupta2011) for details of the estimation. The regional average in Table 5 is computed from the aggregate data. The group averages have been computed by regressing loom equivalent/loom on ownership, within each industry.
One reason for this lack of difference in the capital-labor ratio is that beyond the formal banking sector, Indian entrepreneurs could raise capital through indigenous networks that had grown wealthy in trade. Indian cotton textiles entrepreneurs had made money in trade in raw cotton, particularly during the cotton famine of the 1860s. The capital to set up the first cotton mills was raised by Parsi entrepreneurs from their own resources and contribution from family and friends. The Bhatia merchants, who were the first Hindu entrepreneurs, also raised their own finances (Rutnagur Reference Rutnagur1927, p. 46). At least 70 percent of the authorized capital was paid up soon after the firm was set up. Small firms tended to remain closely held and issue a small number of high-value shares. Large firms tended to float of low face-value shares to a larger number of investors (Rungta Reference Rungta1970, pp. 59–60). In 1854 raising capital for a cotton mill in Bombay did not prove difficult, Oriental Mills sold 500 shares of rupees 2,500 each, but it had to limit subscription to four share per person due to high demand (Morris Reference Morris, Kumar and Desai1982, p. 575). On the other hand, British firms in cotton textiles held little attraction in the Bombay capital market. Greaves, Cotton & Company, the largest European managing agent, controlled seven spinning mills but it was unable to raise capital to diversify into weaving (Morris Reference Morris, Kumar and Desai1982, p. 579). European capital was no more than 10–20 percent of total capital invested in cotton. In Calcutta, the average jute or tea firm did not face problems in mobilizing capital.
There is, thus, no evidence that Indian entrepreneurs were drawn to industries with particularly high rates of returns as suggested by Morris, or that export sectors had higher returns as predicted by the claim of barriers to entry, or that capital constraints alone determined the industrial divide between British and Indian capital.
Social Network Effects
The role of social networks in economic activity in Sub-Saharan Africa has been highlighted by M. Fafchamps when information about the market is limited and involves search costs (Fafchamps Reference Fafchamps2004, pp. 16–17). Traders in Madagascar depend on family ties when starting businesses, but in the long run they reduce themselves from such dependence (Fafchamps and Minten Reference Fafchamps and Minten1999). In contemporary India, the effect of social network in entry has been explored in the context of the diamond industry. Entry of a few members of a social group from outside the trade generated further entry by others from the same community (Munshi Reference Munshi2011). In nineteenth-century India too, community ties were important in decisions to enter into industrial activity. Caste and community networks had been important in Indian Ocean trade in the seventeenth and eighteenth centuries (Ray Reference Ray1985). These same ties formed the basis of industrial investment. Given the nonformal structure of dissemination of information about markets, the community was a relatively costless way to acquire information about new markets and opportunities. The cotton textile and jute industries provide suitable context to study the role of social networks in the early stages of India's industrialization. In cotton textiles, there were broadly five social networks: Parsis, Hindus, Muslims, Jews, and Europeans. The Hindu community was represented by specific trading castes, such as the Bhatias. The social diversity within the Indian firms allows us to identify common factors that might explain their entrepreneurial qualities.
Was the common factor greater contact with western society and higher level of human capital? Tripathi argues that the exposure to new ideas and values and a desire to learn western industrial practices was common to the pioneers from different communities (Tripathi Reference Tripathi1997, p. 108). Parsis were the first social group to become industrial entrepreneurs. As a community, the Parsis had fewer barriers to interacting with other groups and on foreign travel, which gave them greater contact with western society.Footnote 10 They were among the most educated in Indian society (White Reference White1995; Desai Reference Desai and Ray1994). The first Hindu textile entrepreneur in Bombay, Khatau Makanji, belonged to the Bhatia community; they had links with the Parsis and the community played an important role in the religious reform movement of the 1870s. Mulji Thackersey, one of the leaders, visited England and admired Western industrial values (Tripathi Reference Tripathi1997, p. 109). Ranchhodlal, who set up the first cotton mill in Ahmedabad, was educated in English and became a civil servant (Tripathi and Mehta Reference Tripathi and Mehta1990, p. 41). If education and western contact were the driving factors, then human capital should be the common factor among the pioneers rather than the social network. The first entrants were Parsis and as a community they enjoyed a higher level of human capital compared to other Indian caste and community groups. Yet, the success of the Parsi firms had little impact on the traditional Hindu business groups until 1875 (Morris Reference Morris, Kumar and Desai1982, pp. 580–81). Instead, after Khatau Makanji opened a cotton mill, others Hindus followed (Tripathi Reference Tripathi1997, p. 108). The majority of the Hindu mills in Bombay belonged to the Bhatia merchants. This was the second community to enter the industry.
The Parsis and the Bhatias shared a history of involvement in cotton trade. The Parsis had made their wealth in opium and cotton trade. The Bhatias came from Gujarat and traded in raw cotton, textiles, and grain. Ranchhodlal came from a different social background and entry into the cotton textile industry had a different outcome. His caste group, which did not have an involvement in cotton trade, did not follow. Cotton traders in the city of Ahmedabad from other social networks did not follow either. Jain cotton traders turned Ranchhodlal down when he approached them for funds. It took them and their traditional rivals, the Vaishnava Banias another couple of decades to move into this industry (Mehta Reference Mehta1991, p. 196).
Cotton and opium trade was also common history among the pioneers from other social groups. David Sassoon, a Jewish entrepreneur, had migrated from Baghdad to Bombay and prospered in the opium trade (Rutnagur Reference Rutnagur1927, p. 58). He was a pioneer in his community. One of the main British companies, Greaves & Cotton, was set up in 1863 by James Greaves, who had been involved in the cotton trade in Gujarat and had extensive knowledge of the local markets. George Cotton was an agent of the East India Company and was also involved in the cotton trade. Greaves & Cotton and Bradbury & Brady were the managing agents of twelve out of fifteen British enterprises in cotton (Morris Reference Morris, Kumar and Desai1982, p. 580). The development of railway lines, had made the internal trade in cotton, long dominated by Indian merchants, more accessible to the British companies (Vicziany Reference Vicziany1975, pp. 370–72). Currimbhoys were Muslim merchants in the Indian Ocean trade, although they did not act as agents of the English merchants (Ray Reference Ray and Ray1994, p. 43). The success of the Parsis and Gujarati communities in Bombay might have been a consequence of the less imposing presence of the British in the commercial sector rather than religion and Western education (Guha Reference Guha and Tripathi1984). This view does not contradict the idea of informational advantage arising from participation in economic activity.
Indians had far less business presence in Calcutta. The Marwaris in Eastern India traded in jute, rice, and other agricultural commodities. Although the Marwaris worked closely with British firms, they did not enter industrial activity before the First World War. Bengalis with western education did enter into partnerships with British businessmen in banking, insurance, and shipping in the early decades of the nineteenth century, but then they disappeared after the middle of the nineteenth century. It was then that the Marwaris emerged as the main brokers to the British companies. T. A. Timberg documents the rise of the Marwaris as moving from trades in futures market in opium, and specie, to trade in raw jute and jute products in Calcutta and finally to industry (Timberg Reference Timberg1978, pp. 161–66). After 1900 Marwaris organized large firms in the trade in raw jute, and then branched into industry two decades later (Goswami Reference Goswami1991, pp. 84–85). The Marwaris started to buy shares in British-owned jute firms registered in Calcutta that paid high dividends. They also gave loans to cash-strapped British firms in return for block shares. The entry of the Marwaris into British firms’ boardrooms reduced the British dominance of the industry (Goswami Reference Goswami1991, pp. 106–09). Birla and Hukumchand invested their wartime profits from jute trade in the first two Indian-owned jute mills in Calcutta and they were followed by several other Marwaris in the 1920s. In jute, Indian entry followed the same pattern as in cotton: social groups moving from trade to industry within a sector. All this highlights the role of market expertise in entrepreneurship and the role of social networks in information sharing.
ENTRY BY SOCIAL GROUP

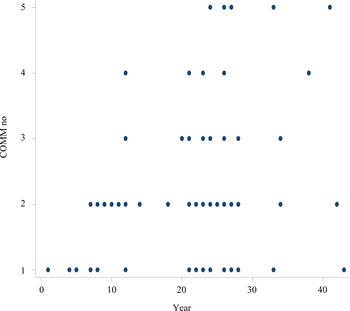
The information remains qualitative but the cotton textile industry does allow us to put some numbers on the role of the social network as a determinant of entry. Five different communities, including the British, were involved in cotton with Parsis and Hindus making the largest investments. The entry of different groups happened in clusters, suggesting strong network effects and is shown in Figure 2. The entry of 97 firms between 1850 and 1915 are used to test if there is an association between the presence of community members in the industry and entry. Table 9 presents the probability of entry. It shows an association between the cumulative presence of members of a community and entry. Total number of firms in the industry also increased the probability of entry, but the coefficient is smaller, confirming that social network effect mattered for decisions of entry. In the jute industry too, for the first fifty years, the British firms were the only social group.
PROBABILITY OF ENTRY (dependent variable: entry)

Notes:
The model is estimated as an unbalanced panel Probit, Social groups are numbered as follows: 1. Parsi, 2. Hindu, 3. English, 4. Jewish, and 5. Muslim. Standard errors are reported in parentheses. Cumulative group presence is the total number of firms from the social group.
Sources:
Bombay Cotton Mill's Association Reports, various years from 1889; Rungta 1929; and Rutnagur Reference Rutnagur1927.
Table 2 shows that all firms in 1915 were British. In 1929 over 20 percent of the firms were Indian-owned and they had all been set up by Marwari traders after 1916.
CONCLUSION
This article has argued that informational asymmetry contributed to the industrial divide between British and Indian business. Geographical factors can explain the location of tea, jute, and coal in the hinterland of Calcutta and the cotton textile industry in Bombay. Anecdotal evidence suggests that discrimination against Indian business reduced their access to capital and certain product markets. However discrimination cannot explain the overwhelming presence of the Indians in cotton textiles and the insignificant presence of British business in this sector when rates of return did not differ systematically between export and import substituting industries. The involvement of British entrepreneurs in the export-oriented industries and their limited presence in the main import- substituting industry is best explained by informational asymmetries and social network effects rather than discrimination. The article argues that this divide reflects the nature of the two product markets, local versus international, and highlights the importance of informational constraints in determining flows of entrepreneurship and capital. Conditional on the initial asymmetry, social networks effects produced segregation by economic activity.