





1. Introduction
Boiling has been proven to be one of the most efficient modes of heat transfer. Two widely accepted heat transfer mechanisms explain the enhanced heat transfer rates associated with nucleate boiling as micro-convection and microlayer evaporation. The growth of the vapour bubble disrupts the thermal boundary layer and induces micro-convection due to vigorous mixing of hot fluid with the colder liquid in the vicinity of the heated wall. Another mechanism is latent heat transfer through the evaporation of the microlayer. Snyder & Edwards (Reference Snyder and Edwards1956) postulated that, when a vapour bubble grows quickly on a solid heated substrate, it traps a thin layer of superheated liquid between the bubble base and the heated wall. This thin liquid layer evaporates by taking the thermal energy of the heated wall and feeds the vapour bubble for its further growth. The thickness of this thin liquid evaporative layer is of the order of micrometres and hence is termed as a ‘microlayer’. Several researchers have attempted to establish the existence of a microlayer through various experimental efforts, such as measuring the transient temperature at the bubble base, laser interferometry and the laser extinction method. Moore & Mesler (Reference Moore and Mesler1961) were the first to identify microlayer formation by measuring temperature fluctuations at the bubble base using a special thermocouple. Later, Hendricks & Sharp (Reference Hendricks and Sharp1964) correlated the wall temperature fluctuation with the bubble growth behaviour using high-speed visualization. Cooper & Lloyd (Reference Cooper and Lloyd1969) performed pool boiling experiments with toluene and isopropyl alcohol on glass and ceramic substrates and measured the transient surface temperature below the bubble base using thin-film thermometers. The authors applied boundary layer analysis and realized the wedge shape of the microlayer, characterized by a monotonic/linear increase in microlayer thickness from the nucleation site to the outer periphery.
Jawurek (Reference Jawurek1969) first employed the interferometric method to examine microlayer structure/geometry under macroscopic bubble dynamics using a mercury lamp during pool boiling of water on a glass substrate. The author reported a wedge-shaped profile of the microlayer. Laser interferometry was further employed along with high-speed photography by Voutsinos & Judd (Reference Voutsinos and Judd1975) to study microlayer growth and evaporation. The authors utilized a He–Ne laser as a light source to improve the data quality of the microlayer. Koffman & Plesset (Reference Koffman and Plesset1983) investigated microlayer behaviour using thin-film interferometry during pool boiling of water and ethanol. The authors performed a comparative study on the variation of the microlayer thickness during the growth of vapour bubbles in ethanol and water. Gao et al. (Reference Gao, Zhang, Cheng and Quan2012) adopted a similar experimental strategy to map the microlayer behaviour beneath a single vapour bubble for ethanol. Along with the microlayer structure, the authors also examined contact-line movement and changes in micro-contact angle.
Jung & Kim (Reference Jung and Kim2015) applied the principles of total reflection (TR) in thin-film interferometry to map the microlayer structure and an integrated infrared thermal camera to simultaneously record wall temperature history with bubble growth during subcooled pool boiling of water on a horizontal substrate. The evaporative heat flux from the microlayer was quantified from its rate of thinning, and heat transfer through the microlayer was estimated to be 17 % of the total heat transfer from the heated surface. Chen, Haginiwa & Utaka (Reference Chen, Haginiwa and Utaka2017) performed a pool boiling experiment with water and employed thin-film interferometry to map the microlayer structure during bubble growth. The authors observed two types of microlayer structure: (1) wedge shape of the microlayer during initial growth and (2) bent shape (curved shape), characterized by a slight decrease (kink) of the microlayer thickness after it achieves its maximum thickness. Utaka et al. (Reference Utaka, Hu, Chen and Morokuma2018) measured microlayer thickness and bubble volume simultaneously using laser interferometry and high-speed videography during nucleate pool boiling of water and ethanol. The ethanol microlayer contributed 39 % to the overall heat transfer, and for water the percentage contribution varied from 14 % to 44 %. In their later study, Chen et al. (Reference Chen, Hu, Hu, Utaka and Mori2020) studied the heat transfer characteristics of the microlayer for a wide range of heat fluxes. The authors observed that the bent shape of the microlayer did not appear for high heat flux conditions, and the initial microlayer thickness is independent of heat flux and expanding velocity of the microlayer edge.
Narayan L & Srivastava (Reference Narayan L and Srivastava2021a) performed pool boiling experiments to understand the intricate relation between heat transfer processes through the microlayer and superheated liquid layer and transient conduction by simultaneously capturing the microlayer formation and thermal field around a single vapour bubble using synchronized thin-film interferometry and rainbow schlieren deflectometry. In the context of flow boiling, Baltis & Van Der Geld (Reference Baltis and Van Der Geld2015) identified the presence of a microlayer and dry region by capturing the growth of a vapour bubble from top view using high-speed photography. More recently, Kossolapov, Phillips & Bucci (Reference Kossolapov, Phillips and Bucci2021) explored the application of light-emitting diodes (LEDs) for interferometric measurement of microlayer thickness under flow boiling conditions. The relatively low coherence length of LEDs eliminated the formation of spurious fringes in comparison to the standard laser-based interferometric measurement techniques (Koffman & Plesset Reference Koffman and Plesset1983; Jung & Kim Reference Jung and Kim2015; Chen et al. Reference Chen, Haginiwa and Utaka2017; Utaka et al. Reference Utaka, Hu, Chen and Morokuma2018). The authors (Kossolapov et al. Reference Kossolapov, Phillips and Bucci2021) employed a red LED to obtain microlayer thickness and a blue LED to capture the footprints of vapour bubble, microlayer and dryspot. They also configured infrared thermography to capture the influence of microlayer evaporation on the temperature field of the heated wall.
Detailed knowledge of microlayer features plays an essential role in the development of mechanistic models for bubble growth and heat transfer models. The recent mechanistic models proposed by various researchers (Yun, Splawski & Song Reference Yun, Splawski and Song2012; Colombo & Fairweather Reference Colombo and Fairweather2015; Raj, Pathak & Khan Reference Raj, Pathak and Khan2017, Reference Raj, Pathak and Khan2020) for modelling bubble growth require accurate information of the microlayer area, its thickness and growth behaviour. In addition, these mechanistic models are applied to estimate the bubble growth at the nucleation site, i.e. the authors assume that the microlayer vanishes once the vapour bubble departs from the nucleation site during the sliding phase. However, in a recent work, Yoo, Estrada-Perez & Hassan (Reference Yoo, Estrada-Perez and Hassan2018) proposed a mechanistic model for the growth of the vapour bubble during the sliding phase by considering microlayer evaporation at the bubble base. This suggests that a fundamental understanding of the underlying dynamics and quantitative investigation of microlayer characteristics is important in developing reliable and more generalized bubble growth and heat transfer models.
The majority of studies reported to date have focused on the investigation of microlayer behaviour and its contribution to the growth of the vapour bubble in the context of nucleate pool boiling. However, to the best of the authors’ knowledge, the literature on experimental works on microlayer characteristics and behaviour during bubble growth, sliding and detachment under the nucleate flow boiling regime is highly scarce, except one of the recent works by Kossolapov et al. (Reference Kossolapov, Phillips and Bucci2021). Since there is a considerable difference in bubble growth and detachment phenomena between pool boiling and flow boiling conditions (sliding, possible reattachment of vapour bubble with the heated surface in the downstream direction, etc.), significant differences in microlayer formation, its growth and evaporation rate are expected under flow boiling conditions.
The present work is an attempt to address the lacuna in the literature and reports experiments to understand the detailed features of microlayer dynamics during subcooled flow boiling of water in a vertical rectangular channel. Thin-film interferometry in conjunction with high-speed videography have been employed to capture the dynamic growth of the microlayer structure, movement of the three-phase contact line and thickness profile during the growth process of a single vapour bubble. Based on the instantaneous microlayer thickness data and bubble volume, the contribution of microlayer evaporation towards the overall bubble growth has been obtained. Initial microlayer thickness has been calculated and compared with empirical and theoretical models available in the literature. In addition to these parameters, the experimental observation of microlayer dynamics has been employed to elucidate the possible role(s) of various heat transfer mechanisms that contribute towards the overall bubble growth process under flow boiling conditions.
2. Experimental apparatus
A test channel has been designed and fabricated to perform flow boiling experiments. The test channel is built of stainless steel, having a rectangular cross-section of 5 × 10 mm2 and a length of 750 mm. Figure 1(a) shows a three-dimensional (3-D) model of the test channel. An indium tin oxide (ITO) heater of length 200 mm has been fixed on one wall of the test channel at a distance of 400 mm from the inlet section. The ITO heater is made of transparent boro-float glass with a thickness of 1.1 mm and a width of 10 mm. An electroconductive film of ITO has been deposited on one side of the glass heater, which leads to Joule heating when subjected to DC supply. The heater substrate is fixed on the channel in such a way that the ITO-coated region faces the outer side to avoid direct contact with the working fluid (deionized water). The ITO-coated glass heater is connected to a variable DC power supply unit (Aplab, India; range 0–32 V and 0–5 A) to control the applied heat flux during the boiling experiment. To enable optical access inside the test channel, three high-quality optical glasses of length 75 mm have been fixed on the remaining walls of the channel at a distance of 440 mm from the inlet section (figure 1b). A set of precalibrated K-type thermocouples have been inserted in the inlet and outlet section of the test channel to measure the respective temperatures.
(a) Isometric model of the test channel, (b) cross-sectional view of the test channel near the nucleation site, and (c) visualization domain with heater details.

In the present study, boiling experiments have been performed by creating a single nucleation site at a specified axial location (460 mm from the inlet section) over the entire heated area. To achieve this, some part of the ITO film has been partially etched out in a semicircular fashion, which resulted in the formation of a neck region of width 3 mm (as shown in figure 1c). When the ITO heater is connected to the electrical supply, local resistance to current flow increases in the neck region, which leads to a relative increase in the temperature compared to the other locations of the heater and helps to achieve the threshold temperature required for the onset of nucleation in the neck region. This arrangement of localized heating leads to the generation of a single vapour bubble at the pre-decided nucleation site (schematically shown by the red dot in figure 1c). Such an approach is suitable for microlayer imaging through techniques such as thin-film interferometry as it avoids any possible formation of unwanted/spurious (interferometric) fringes due to the presence of an artificially created cavity on the substrate surface.
A hydraulic flow loop has been developed to circulate the working fluid in the test channel at the required flow rate and temperature conditions under atmospheric pressure. The hydraulic flow loop consists of a constant-temperature water bath (Julabo F32, Germany), which acts as a pre-heater, where the working fluid can be heated to the required temperature with an accuracy level of ±0.1 °C. The water bath has a capacity of 10 l and has a provision to pump the working fluid through the channel. The flow rate of the working fluid was controlled by an in-line rotameter (CVG Technocraft, India), which is pre-calibrated in the operating temperature range at atmospheric pressure conditions. All these components (pump, rotameter, test channel, water bath) have been connected together with insulated Teflon pipes and watertight push-fit joints to eliminate any leakages during the experiment.
3. Optical layout
Figure 2 shows the schematic representation of the optical configuration of the thin-film interferometer for mapping the microlayer behaviour during nucleate flow boiling in a vertical rectangular channel. The microlayer is a thin evaporative liquid film formed at the base of the growing vapour bubble. Figure 2 schematically shows the top view of the thin-film interferometry optical configuration and the cross-section of the vertical test channel where the flow of the working fluid is normally outwards from the figure plane. The optical arrangement of thin-film interferometry includes a He–Ne laser (632.8 nm, power 12 mW) as a light source, a spatial filter and a beam splitter. The light emerging from the laser source has first been collimated using the spatial filter and collimating lens (achromatic lens of focal length 350 mm). The spatial filter assembly employed in the present work includes a microscopic objective (×4) and a circular aperture of 50 μm. The collimated light beam of size 20 mm thus obtained is allowed to pass through the beam splitter and then directed to fall exactly on the nucleation site from the back side of the heater surface as shown in figure 2. As the light beam passes through the bubble base, a part of the light beam gets reflected from the heater surface–liquid interface, while the remaining transmitted part of the light beam gets reflected at the liquid–vapour interface. These two reflected light waves interfere and travel back through the beam splitter, where they are reflected towards the camera screen.
Schematic representation of the optical arrangement for thin-film interferometry coupled with high-speed cinematography for simultaneous mapping of microlayer dynamics and bubble growth behaviour.

A high-speed complementary metal oxide semiconductor (CMOS) camera HSC1 (Phantom, VEO 410L) along with ×12 telecentric zoom lens (Navitar) with ×0.25 adapter and zoom extender system was configured with the interferometer to capture the microscopic dynamic behaviour of the microlayer during the growth and detachment process of the vapour bubble. The dynamic movement and structure of the microlayer have been recorded at the rate of 10 000 frames per second (f.p.s.) at a spatial resolution of 5.8 μm pixel−1. In order to avoid the effect of external disturbance/vibration, the whole optical arrangement is installed on a vibration isolation table (Holmarc, India).
Figure 3(a) shows the schematic diagram of the vapour bubble on a heated substrate. A zoomed view of the bubble base region has been shown in figure 3(b), where the dryout region represents the contact area of the vapour bubble with the heater surface and the microlayer represents the thin evaporative liquid layer trapped at the bubble base. A schematic representation of the working principle of the thin-film interferometer has been demonstrated in figure 3(b). The incoming laser beam towards the bubble base is indicated by 1. Upon incidence on the heated wall, some part of the laser beam is reflected by the solid–liquid interface as indicated by 1′ and remaining parts transmit through the liquid layer, which gets reflected back at the liquid–vapour interface as indicated by 2′. Hence, the interference is caused by the superimposition of the two reflected beams 1′ and 2′. Figure 3(c) shows a representative image of the microlayer profile in the form of circular and concentric interferometric fringes. One can notice a circular patch without fringes in the central region of the microlayer, which represents the dry region or contact area of the vapour bubble. Hence, the first inner fringe represents the inner edge of the microlayer and the last outer fringe denotes the outer edge of the microlayer.
Schematic representation of (a) microlayer at bubble base, (b) working principle of thin-film interferometer, and (c) interferometric image of microlayer.

As per the schematic shown in figure 3(b), the optical path difference (OPD) induced by the thin microlayer between the two reflected beams can be obtained. As reported by Gao et al. (Reference Gao, Zhang, Cheng and Quan2012), the OPD between the two beams of the interferometer denoted by fringe number map and the height of the microlayer at any pixel location of the image can be expressed by (3.1) and (3.2), respectively:
 \begin{equation}m = \frac{{\Delta \phi (x,y)}}{{2{\rm \pi} }};\end{equation}
at locations of bright fringes or sites of constructive interference,
 \begin{equation}{\delta _{ml}}(r,t) = \frac{{\lambda m}}{{2{n_l}}};\end{equation}
and at locations of dark fringes or destructive interference,
 \begin{equation}{\delta _{ml}}(r,t) = \frac{{\lambda (m + 1/2)}}{{2{n_l}}}.\end{equation}
Here, δml represents the microlayer thickness, λ is the wavelength of the laser source, nl is the refractive index of the working fluid at saturation temperature and  $m = 0,1,2,3, \ldots$ represents fringe order.
The above equations were employed to calculate the local microlayer thickness at any given radial distance and time. The quality of the formed fringe strongly depends on the alignment of the heated wall of the test channel with the incoming laser beam. The collimated laser beam must fall normally at the nucleation site of the heated wall. Slight misalignment could result in local weakening of signal and reduce the fringe clarity spatially. Furthermore, to avoid the formation of any parasitic fringes due to unwanted reflections, the top wall of the channel was painted black. Details of the data reduction algorithm to obtain the phase difference (Δϕ) have been provided in Appendix A. Calibration experiments were performed to validate the thin-film interferometry-based methodology for thickness measurements, the details of which have been included in Appendix B.
The high-speed cinematography arrangement was coupled with thin-film interferometry for simultaneous visualization of microlayer dynamics with bubble behaviour. An LED light source (GSVITEC Germany, 84 W) was employed for illuminating the field of interest and a high-speed camera (HSC2) was configured on the other side of the channel to capture the dynamics of the growing vapour bubble (figure 2). HSC2 (IDT Vision, NX8S1) was attached with a 7× zoom lens system (Navitar) to record the bubble motion at 5000 f.p.s. at an image resolution of 152 × 166 pixels, the physical dimension of each pixel being  ${\sim} 32.8\;\mathrm{\mu m}\;\textrm{pixe}{\textrm{l}^{ - 1}}$. For simultaneous visualization of microlayer dynamics with bubble growth, HSC1 was triggered using a software trigger signal from HSC2. As an additional precautionary step, the frame rate and the recording duration of both cameras were set to similar values to ensure a one-on-one match between the image frames.
4. Results and discussion
Subcooled flow boiling experiments have been performed in a vertically oriented rectangular channel with upward flow of water. A series of boiling experiments have been conducted for a range of Reynolds numbers at constant liquid subcooling levels and applied heat flux conditions. Both bubble growth dynamics and microlayer behaviour have been captured simultaneously using two different optical configurations operating in tandem: (i) high-speed photography from the side view of the vapour bubble and (ii) thin-film interferometry to image the region beneath the vapour bubble. Figure 4 shows a representative photographic image of the vapour bubble and the corresponding image of the microlayer fringe pattern. For ready reference, the necessary nomenclature of some of the important features of the microlayer region have also been indicated in figure 4.
(a) Representative image of vapour bubble (pictorial side view) and (b) corresponding microlayer fringes captured from the bottom side.

Thin-film interferometric fringes represent the region of the microlayer. The outer yellow dashed line represents the outer edge of the microlayer, and it also represents the outline of the bubble base diameter. The central region, where concentric fringes are absent, indicates the dry region (dryspot). The circumference of this dry region represents the triple-point contact line (liquid–vapour–solid interface), also termed the ‘inner edge’ of the microlayer. The maximum radial extent from the inner edge of the microlayer to the periphery of the concentric circular fringes is termed the ‘inner core region’ of the microlayer. The deformed/stretched fringe outside the inner core region of the microlayer is termed the ‘convective region’ of the microlayer. The region outside the microlayer is known as the ‘wet region’. Thick dark bands seen in the background and the central region (inside the dry region) represent the background fringes, which get formed due to the heating of the ITO (substrate) surface. To enhance the clarity and contrast of microlayer fringes, background (fringes) have been subtracted from the microlayer images for further analysis.
4.1. Dynamics of microlayer and vapour bubble
Figure 5 shows the time evolution of the microlayer in the form of interferometric fringes recorded at the bubble base along with the corresponding side-view images of the growing vapour bubble for Re = 3600 and ΔTsub = 5 K. The centre of concentric fringes represents the location of the single nucleation site. Videography images shown in figure 5(a–d) represent the initial growth of the vapour bubble wherein the bubble acquires an apparent hemispherical shape, and figure 5(a′–d′) demonstrate the corresponding microlayer growth with time. It is evident from the figure that the microlayer forms with the inception of the vapour bubble. The appearance of circular, concentric and almost equally spaced interferometric fringes signifies a linear/monotonic growth of the microlayer during the initial stages of the bubble growth process, which suggests a wedge-shaped structure of the microlayer. For the given flow rate (Re = 3600), the dryspot appeared at t ~ 0.4 ms.
Transients associated with the growth of a vapour bubble and the corresponding thin-film interferograms of the microlayer for Re = 3600 at ΔTsub = 5 K.

It is noticeable that the outer edge of the microlayer expands quite rapidly during the initial growth period of the vapour bubble as compared to the expansion rate of the inner edge (triple contact line). A rapidly expanding microlayer is indicative of the rapid growth of the vapour bubble during its initial growth phase, while a relatively slow expansion of the contact line can be attributed to the gradual evaporation at the inner edge of the microlayer. Similar behaviour of microlayer and contact-line expansion has also been reported in the case of pool boiling (Jung & Kim Reference Jung and Kim2015). The observed similarity in microlayer and contact-line expansion behaviour between the pool and flow boiling regimes can be attributed to the rapid growth of the vapour bubble in the initial stages, during which the effect of bulk flow inertia is quite negligible due to the small size of the vapour bubble. This aspect has been further explained on the basis of figure 10 in the later sections of the paper.
As the microlayer continues to expand radially with the growth of the vapour bubble, the outermost fringe was observed to deform. It is evident that, for t > 0.6 ms, the outermost fringe expands (moves away from the inner core region) with a certain degree of eccentricity before getting merged with the expanding inner fringe. This sequence of phenomena was seen to be different in the upstream and downstream sides of the microlayer. A sequence of images has been shown in figure 6 to demonstrate the deformation of the fringes in the outermost region of the microlayer. On the upstream (bottom) side, the outermost fringe is observed to deform, stretch (get thickened) and then re-emerge slightly away from the inner core region. This can be seen in the form of an increasing number of fringes in the upstream side, slightly away from the inner core region. On the downstream side, the outermost fringes are initially seen to disappear after slight stretching. However, in the later stages of bubble growth (t = 2.2 ms), fringes can be seen around the outer edge on the downstream side. Chen et al. (Reference Chen, Haginiwa and Utaka2017) have reported a similar fringe behaviour at the outer periphery during pool boiling and inferred a convex/bent-shaped liquid–vapour interface in the outer region of the microlayer. Despite the local fluctuations in the outer convective region, the change in the radius of the inner core region is observed to be negligible. Figure 6 shows that the radial extent of the inner core region remains almost invariant for a considerable duration while the radius of the outer microlayer edge increases quite rapidly. A slight change in the number of fringes and fringe spacing is noticeable in the inner core region, which can be attributed to the varying microlayer thickness.
Time evolution of microlayer fringes showing fringe deformation in its peripheral (outer) region.

As the vapour bubble continues to grow, fringes in the upstream side disappear with time. Figure 5(g′–j′) clearly illustrate the disappearance of microlayer fringes in the upstream side as well as along the sides of the vapour bubble in the lateral direction. The disappearance of microlayer fringes along the upstream outer periphery can be related to the asymmetric deformation of bubble shape under the influence of bulk flow, which can be clearly seen in figure 5(g–j) in the form of relative straightening of the upstream interface (increase in apparent contact angle), while the downstream interface remains almost round in shape. The observed deformation of the vapour bubble can be attributed to the external pressure acting on the upstream liquid–vapour interface due to bulk flow. This pressure, which varies along the interface, gets compensated via dynamic stress conditions at each and every point of the interface, and thus no interface breaking was observed.
For better insight, the locus of bubble shape at different time instants has been shown in figure 7(a), along with the corresponding microlayer images. Although the side view of the vapour bubble indicates its departure/displacement from the nucleation site over a time duration of t = 2 to 4.5 ms, the corresponding microlayer images show negligible movement of the dryspot centroid. This implies that the vapour bubble remains attached to the heated substrate (nucleation site), while experiencing continuous deformation in its shape. The resultant deformation of the vapour bubble results in decreasing contact of the vapour bubble on the upstream side (increasing upstream contact angle) and increases the bubble contact in the downstream region (decreasing contact angle on the downstream side). Figure 7(b) schematically shows the effect of bubble deformation on the liquid–vapour interface in the micro-region, wherein the spread of microlayer on the upstream side can be seen to decrease with time while the microlayer expands in the downstream side.
Schematic representation of the effect of bubble deformation/tilt on microlayer structure.

The observed asymmetry in the microlayer profile may be explained through the dynamic changes in the shape of the vapour bubble. After the initial growth period, the vapour bubble changes its shape from hemispherical to round (Sinha, Mahimkar & Srivastava Reference Sinha, Mahimkar and Srivastava2019; Sinha & Srivastava Reference Sinha and Srivastava2019). In the context of the present experiments, bubble shape and upstream microlayer radius have been plotted in figure 8. At any given time, the shape of the vapour bubble is characterized by its aspect ratio (AR), obtained by fitting an ellipse to the bubble shape and calculating the ratio of the minor axis to its major axis (as per the procedure discussed in Appendix C). Following this, the hemispherical (oblate) shape of the vapour bubble corresponds to AR = 0.5, and AR values close to 1 represent spherical shape. Figure 8 shows the time variation of AR along with the upstream microlayer radius for three different bubble ebullition cycles. For Re = 3600 (figure 8a), it is noted that the aspect ratio of vapour bubble is almost constant at AR ~ 0.58 until t ≃ 2.2 ms, which signifies a nearly hemispherical shape of the vapour bubble. After t ≃ 2.2 ms, the bubble AR shows an increasing trend. On the other hand, the upstream microlayer radius increases quite rapidly during the initial growth period, becomes constant for a while, and decreases after t ≃ 2.2 ms. Thus, it can be inferred that asymmetric deformation of the vapour bubble begins at t = 2.2 ms as it undergoes shape change from hemispherical to round. Similar behaviour was also observed for Re = 6000; however, it occurs slightly earlier at t ~ 1 ms. This early/rapid shape change of the vapour bubble at relatively high flow rates can be attributed to the coupled effects of the increased strength of the external pressure field along the bubble interface and surface tension effects (due to the formation of smaller-sized bubbles) causing near-spherical shape.
Time variation of bubble aspect ratio and upstream microlayer radius for (a) Re = 3600 and (b) Re = 6000.

Figure 5(d′–i′) show that the dryspot expands radially with the growth of the vapour bubble to its maximum size before it begins to shrink from the upstream side as the upstream microlayer gets completely depleted. At this instant, the upstream contact line comes into direct contact with the bulk liquid (figure 5i′). As the vapour bubble continues to grow, it elongates in the direction normal to the heated wall. Vertical elongation of the vapour bubble leads to shrinking of the dryspot from the upstream side, and continuous deformation (due to increasing bubble size) further deteriorates the microlayer from the lateral side (figure 5i′–j′). In the initial stages of bubble growth, the dryspot grows radially (circular shape), deforms to an oval shape during microlayer depletion in the upstream region, and then shrinks gradually until the vapour bubble detaches from the heated wall, as shown in figure 5(d′–k′). The dryspot appears oval in shape due to the localized disturbances induced in the apex (downstream) region of the dryspot, which amplifies with time and penetrates into the core region of the microlayer on the downstream side. Figure 5(i′) shows the localized expansion of the contact line in the downstream core region at t = 4.4–6.1 ms. The local expansion of the contact line was observed to decrease with an increase in the bulk flow rate, which is likely to be due to the reduced growth time of the vapour bubble with increasing flow rate.
Figure 9 shows the growth of the dryspot in terms of the time variation of the equivalent root diameter. The maximum size of the dryspot for Re = 3600 was significantly larger than that observed for Re = 6000. Reduction in maximum root diameter at relatively high flow rates is to be attributed to the formation of smaller-sized vapour bubbles at high flow rates. Smaller root diameter leads to a reduction in surface tension force (majorly responsible for keeping the vapour bubble attached to the heater surface), which results in an early lift-off of the vapour bubble at increased flow rates. Furthermore, it was observed that, irrespective of the flow rate of the bulk fluid, the dryspot size was maximum in the normalized time range of t/td = 0.65–0.75. Here, td represents the bubble detachment time (the instant at which the dryspot vanishes) for the given flow rate. A similar range of normalized time for maximum dryspot size has also been reported by Jung & Kim (Reference Jung and Kim2015) for the case of pool boiling.
Time rate of growth of the dryspot in terms of root diameter.

Figure 9 shows an almost linear and uniform growth of the dryspot with time as a function of Reynolds number. It is seen that the growth rate of the dryspot is a weak function of the Reynolds number. This is expected since the dryspot appears in the region of microlayer wherein convective effects are quite weak due to the dominance of viscous effects (in the close vicinity of the heated wall). This inference can be explained further by comparing the convective time scale (due to bulk flow) and the time scale of bubble expansion. The convective time scale can be estimated as Dbubble/Vliquid, where Vliquid is determined at the bubble height. In the present analysis, the velocity field (Vliquid) was obtained through particle image velocimetry (PIV) experiments for varying Reynolds numbers (Appendix D). The convective time scales at different stages of the bubble growth were then quantified by using the absolute velocity at a height corresponding to the diameter of the vapour bubble from the heated substrate.
With reference to figure 10, during the initial growth phase, the time scale corresponding to the bulk convective velocity can be seen to be significantly higher (by an order of magnitude) in comparison to the bubble expansion time scale. This suggests that, during the initial rapid expansion stage of the bubble growth process, the convective effects do not play any significant role and the bubble growth process is expected to be similar to that under pool boiling conditions (this inference also finds support in the form of nearly symmetric growth of the microlayer and the bubble during its initial growth stages, figure 5). After the initial rapid growth phase, the convective time scales and bubble expansion time scales become comparable with each other. As a result, the convective bulk flow begins to influence the shape and size of the vapour bubble, leading to an asymmetry in both the bubble shape as well in the microlayer geometry. This transition occurs at a time instant when both the time scale parameters intersect with each other in figure 10. The transition time instant matches with that at which the asymmetry in the microlayer first appears, i.e. at t = 2 ms for Re = 3600 and t = 1 ms for Re = 6000, respectively. These observations reveal that the asymmetry in the microlayer is primarily because of the shape change of the vapour bubble caused due to the relative dominance of convective flows.
Variation of time scales associated with convective effects and bubble expansion.

After the dryspot attains its maximum size, it begins to shrink from the upstream side while expanding in the downstream region, which results in the displacement of the dryspot centroid. The dryspot displacement suggests the departure of the vapour bubble from the nucleation site and its sliding on the heated wall. Gradually the size of the dryspot decreases and, after a few milliseconds, it vanishes completely, as seen in figure 5(i′–l′). The complete disappearance of the dryspot in the microlayer images is identified as the actual detachment of the vapour bubble from the heated wall (figure 5l′). However, the corresponding videographic image from the side view gives an impression that the vapour bubble is still attached to the heated wall (figure 5l). Bubble detachment observed from the side view is the apparent lift-off of the vapour bubble.
For better clarity, the growth–time history of the vapour bubble has been plotted in figure 11(a) to illustrate the detachment phenomena based on the experimentally recorded data. The equivalent diameter of the vapour bubble was obtained through image processing of the videographic images (recorded from the side view) by following the method discussed in Appendix C. The experimental uncertainties associated with the quantification of various bubble dynamic parameters as well as the microlayer thickness have been discussed in Appendix E. The apparent bubble lift-off time has been identified based on the photographic image of the vapour bubble, while the time instants of actual bubble lift-off and disappearance of microlayer fringes were obtained from the microlayer images. For Re = 3600, the actual and apparent lift-off were observed at t = 8.5 ms and t = 11.3 ms, respectively. After the actual lift-off, the microlayer fringes could still be seen until t = 9.5 ms, implying that the vapour bubble moves/hovers in the close vicinity of the heated wall for a while. The gap between the vapour bubble and heater surface can be expected to be of the order of a few micrometres. This suggests that the bottom dome of the vapour bubble remains in contact with the adjacent superheated liquid layer for a while.
(a) Bubble growth with time. (b) Representative microlayer images showing sliding of the vapour bubble in terms of the displacement of the dryspot (first row) and sliding by moving over the heated wall after detachment (second row).

It is noticeable that the size of the vapour bubble is almost invariant (constant) from t = 8.5 ms to t = 11.3 ms (as shown in figure 11a), which can be attributed to the comparable rates of evaporation of the superheated liquid layer scavenged from the heated wall during bubble lift-off and condensation from the top portion of the vapour bubble. Evidence of scavenging phenomena of the superheated liquid layer during bubble lift-off has been reported in the authors' previous works (Narayan, Srivastava & Singh Reference Narayan, Srivastava and Singh2018; Kangude & Srivastava Reference Kangude and Srivastava2019; Sinha et al. Reference Sinha, Mahimkar and Srivastava2019).
Similarly, for Re = 6000, the actual lift-off of the vapour bubble was observed at t = 3.6 ms, while the apparent lift-off was found to occur at t = 5.2 ms. This shows a significant difference between the instants of actual lift-off and apparent lift-off of the vapour bubble. For any given Reynolds number, the actual lift-off was observed when the vapour bubble achieves its maximum size, and apparent lift-off was seen when the size of the vapour bubble begins to reduce from its maximum size.
Based on these observations, the overall bubble behaviour can be divided into two parts (figure 11b), namely: (i) sliding of the vapour bubble while being in contact with the heated wall (from the instant of bubble departure to actual lift-off, as shown in figure 5i′–k′), and (ii) sliding over the heated wall after its actual detachment from the heated surface. Different heat transfer mechanisms are expected to prevail during these two possible movements of the vapour bubble. In particular, after the initial growth period, the subsequent deformation of the vapour bubble tends to re-form the microlayer in the downstream region (the re-formed portion of the microlayer can be seen as deformed fringes in figure 15(d) in the later sections of the paper). During this time period, the liquid layer entrapped pushes the vapour bubble upwards and enables the vapour bubble to hover over the heated substrate, as observed after the detachment of the vapour bubble in figure 11(b). Similar observations have also been reported in one of the recent works by Sawaguchi et al. (Reference Sawaguchi, Matsuda, Hama, Saito and Tagawa2019) in the context of the levitation of a droplet through an air film on a moving wall.
The microlayer continues to expand and entraps additional liquid in the downstream side. However, it is to be noted that the increased downstream spread has a negligible impact on the area of the downstream core region. The fringe density in the downstream convective region is quite sparse and deformed due to the local residual flow within the microlayer and inherent fluctuations in the bulk fluid. Figure 12 shows microlayer images for four different bubble ebullition cycles wherein significant variations in fringe patterns can be observed in the downstream convective region. As mentioned earlier, each fringe (bright or dark) represents the locus of constant microlayer thickness. Hence, as per the fringe profile observed in the downstream convective region, negligible variation in the microlayer thickness is to be expected, which, in turn, indicates a nearly flat structure of the microlayer in the downstream convective region.
Varying microlayer pattern in the downstream convective region for different bubble ebullition cycles at Re = 3600 at ΔTsub = 5 K.

4.2. Radial variation of microlayer thickness
Microlayer fringe patterns have been quantitatively analysed to obtain the radial profile of microlayer thickness using the wavelet-based algorithm discussed in Appendix A. The radial distribution of microlayer thickness at different time instants for an average bubble cycle has been shown in figure 13 for (a) Re = 3600 and (b) Re = 6000. These profiles correspond to the central vertical axis of the microlayer region, as indicated in the inset of figure 13(a). In the abscissa, r = 0 mm is the nucleation site, negative values represent the radial expansion of the microlayer in the upstream region and data plotted along the positive abscissa show microlayer expansion in the downstream area. It is worth mentioning here that the thickness profiles shown in figure 13 represent the relative thickness of the microlayer, assuming zero thickness of the central dry region. (With reference to the thin-film interferometric images of the microlayer region shown in figure 5, the appearance of a dryspot can be identified as the centrally located bright region. Since no distinct fringes are to be seen in the dryspot region and the minimum thickness of microlayer that is required to form a distinct fringe can be estimated to be equal to 238 nm (through principles of fringe formation in interferometry), the microlayer thickness inside the dryspot can well be expected to be much less than 238 nm. Thus, the thickness of the dryspot region can reasonably be expected to be in the range of 0–238 nm. Hence, for the data reduction methodology employed in the present study, the reference height at the periphery of the dryspot has been taken to be equal to 0 nm. This approach finds support in similar interferometric studies reported in the literature (Koffman & Plesset Reference Koffman and Plesset1983; Gao et al. Reference Gao, Zhang, Cheng and Quan2012; Narayan L & Srivastava Reference Narayan L and Srivastava2021b).)
Radial distribution of microlayer thickness at different time instants plotted along the direction of flow (shown by the red vertical line in (a)) for (a) Re = 3600 and (b) Re = 6000.

The data plotted in figure 13 show that the microlayer thickness increases as one moves radially outwards from the nucleation site and attains its maximum near the apparent bubble periphery. During the early stages of bubble growth, the microlayer grows radially without any change in its thickness. One can clearly see that, for Re = 3600, the data plotted at t = 0.2 and 0.4 ms almost overlap with each other. Similar behaviour was also observed at Re = 6000 until t = 0.3 ms (with slight inconsistency, likely to be due to increased turbulence and inherent flow fluctuations). As the microlayer approaches its maximum thickness, further expansion of the microlayer was observed with its uniform thinning in the core region and bent shape at the outer periphery. The observed change in microlayer thickness can be attributed to the coupled effects of liquid evaporation and residual flow caused by the bubble growth. Some of the classic works in the literature discussed the possibility of inflow of liquid into the microlayer region due to curvature effects as well as liquid outflow as a result of surface tension gradients (Wayner, Kao & LaCroix Reference Wayner, Kao and LaCroix1976, Reference Wayner, Tung, Tirumala and Yang1985; Stephan & Hammer Reference Stephan and Hammer1994). Furthermore, a recent study by Jung & Kim (Reference Jung and Kim2018) reported an outflow of microlayer liquid due to rapid expansion of the vapour bubble during the initial growth phase. In view of these observations and the inherent experimental complexities in accurately capturing the net flow (inflow and/or outflow) of liquid within the narrow microlayer region, it is difficult to conclusively attribute the observed changes in the microlayer thickness solely to the phenomena of microlayer evaporation. For these reasons, variations observed in the thickness of the microlayer in the context of the present experiments can best be attributed to the coupled effects of liquid evaporation and residual flow due to bubble growth.
For any given flow rate, the microlayer thickness profile shows identical structure in the upstream (figure 13) and lateral sides (figure 14), i.e. initial monotonic increase (a wedge shape) until its thickness reaches maximum values followed by a slight reduction of microlayer thickness indicating a bent shape. In contrast, the microlayer thickness in the downstream region first increases to its maximum value and then decreases via an intermediate plateau region. For Re = 3600, the maximum microlayer thickness of δ ~ 3.5 μm was observed at t = 0.7 ms, having acquired an almost wedge shape with a radial spread of 0.72 mm in the lateral direction of the microlayer, as shown in figure 14(a). Similarly, for Re = 6000, the maximum microlayer thickness of δ ~ 2.5 μm was observed at t = 0.4 ms.
Radial distribution of microlayer thickness at different time instants plotted along the transverse direction of flow (shown by the red horizontal line in (a)) for (a) Re = 3600 and (b) Re = 6000.

Further growth and subsequent deformation of the vapour bubble cause depletion of the microlayer in the upstream region. Once the upstream microlayer is depleted completely (instant of bubble departure), a relatively higher reduction in microlayer thickness can be seen in the downstream region (for t > 4.9 ms in figure 13a and t > 1.7 ms in figure 13b). The increased reduction in microlayer thickness after the bubble departure can be attributed to the increasing bubble deformation due to increasing impact of buoyancy and drag force with continuous bubble growth. As the upstream microlayer vanishes, the vapour bubble tends to elongate faster in the direction opposite to the heated wall. The shear lift force acting on the vapour bubble tends to push the vapour bubble towards the heated wall (Zeng, Klausner & Mei Reference Zeng, Klausner and Mei1993), which leads to further deformation, leading to the thinning of the downstream liquid layer. This thinning of the microlayer could further increase the evaporation rate depending on the available thermal energy of the heated wall in that region.
Figure 14 shows the radial distribution of microlayer thickness with time in the lateral direction (along the central horizontal axis) for (a) Re = 3600 and (b) Re = 6000. The radial expansion of the microlayer is seen to be almost similar on the left and right sides of the nucleation site. However, at any given time instant, the maximum microlayer thickness is relatively higher on the right side compared to the left side. Such dynamical and asymmetric behaviour of microlayer formation under practical conditions limits the prediction capabilities of mechanistic boiling heat transfer models wherein symmetric growth of the microlayer is a major assumption (Raj et al. Reference Raj, Pathak and Khan2020). In addition, the predictive capacities of such models are also limited due to some of the inherent assumptions under which these models are generally employed. These assumptions include their applicability only during the initial stage of the bubble growth process, no liquid flow during the initial growth phase, the vapour bubble does not slide/move along the heater surface prior to its departure, etc. Moreover, the wall contact diameter that appears in the surface tension and body force terms is mostly assumed as constant in such models.
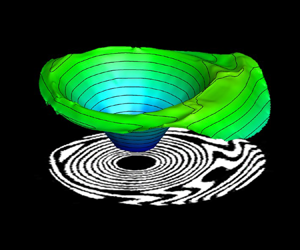
To obtain further insights into the microlayer structure, 3-D contour plots of microlayer structure have been obtained and shown in figure 15. The contour surface represents the structure of the liquid–vapour interface below the growing vapour bubble. The linear growth of the microlayer during the initial growth period is evident in the form of an inverted conical shape of the microlayer, as seen in figure 15(a). As discussed earlier, the presence of deformed fringes along the outer periphery of the microlayer indicates a bent shape of the microlayer. A similar inference can be drawn from the 3-D contour of microlayer profile shown in figure 15(b–d), which clearly illustrates a bent/deformed structure of the liquid–vapour interface along the outer edge of the microlayer. Further growth of the vapour bubble results in the deformation of the vapour bubble in the direction of bulk flow, which can be directly seen as a reduction in the upstream microlayer thickness and expansion in the downstream region (figure 15c,d).
Time evolution of 3-D structure of the microlayer thickness profile below a growing vapour bubble at Re = 3600.

4.3. Initial microlayer thickness
Figure 16 shows the radial distribution of the initial microlayer thickness for an average bubble ebullition cycle for Re = 3600 and 6000. Here, the initial microlayer thickness has been defined as the thickness of the outer edge of the microlayer at any given time instant (Utaka, Kashiwabara & Ozaki Reference Utaka, Kashiwabara and Ozaki2013; Yabuki & Nakabeppu Reference Yabuki and Nakabeppu2014). To demonstrate the asymmetric development of the microlayer, the initial microlayer thickness data have been considered in the upstream, downstream as well as lateral directions (along the red lines shown in the inset of figure 16). Figure 16 clearly shows that, for any given Reynolds number and measurement direction, the initial microlayer thickness first increases along the radial direction (starting from the nucleation site) and then decreases after reaching its maximum value, which indicates a bent shape of the microlayer for the given bubble cycles in all directions (upstream, downstream and lateral sides). A similar trend of initial microlayer thickness has also been reported in some previous studies (Chen et al. Reference Chen, Haginiwa and Utaka2017; Jung & Kim Reference Jung and Kim2018). Increasing Reynolds number results in a reduction in the maximum initial microlayer thickness as well as in the radial expansion, primarily due to the reduction in the surface thermal energy available for bubble growth at increased flow rates.
Radial distribution of initial microlayer thickness and its comparison with empirical models available in the literature.

A select group of researchers have reported measurements of initial microlayer thickness using different measurement techniques and have reported empirical correlations for the prediction of initial microlayer thickness during nucleate boiling with water under atmospheric pressure conditions (Koffman Reference Koffman1983; Utaka et al. Reference Utaka, Kashiwabara and Ozaki2013; Yabuki & Nakabeppu Reference Yabuki and Nakabeppu2014). The details of their experimental conditions, measurement techniques and proposed empirical correlations for initial microlayer thickness have been summarized in table 1.
Empirical correlations proposed in some of the previous studies.

Figure 16 compares the initial microlayer thickness obtained in the present work with the prediction plots obtained from empirical correlations of some of these previous studies. The correlation plot for Koffman (Reference Koffman1983) and Yabuki & Nakabeppu (Reference Yabuki and Nakabeppu2014) shows the bent shape of the initial microlayer thickness variation, while the correlation prediction plot by Utaka et al. (Reference Utaka, Kashiwabara and Ozaki2013) shows a wedge shape. All three correlations show a reasonably good agreement with the present experimental data up to the point of maximum microlayer thickness. However, the correlations overpredict the values in comparison to the present experimental data in the bent region. The reduction in the initial microlayer thickness values in the bent region (region beyond the maximum thickness) points towards possible evaporation of the microlayer, an aspect that is generally considered to be quite negligible in the previous empirical correlations (Koffman & Plesset Reference Koffman and Plesset1983; Utaka et al. Reference Utaka, Kashiwabara and Ozaki2013; Yabuki & Nakabeppu Reference Yabuki and Nakabeppu2014). However, the resulting difference is not that significant for Re = 6000, which suggests reduced evaporation of the microlayer periphery during the initial stages of bubble growth, probably due to a decrease in the surface thermal energy at high flow rates. This observation implies that the present experimental data pertaining to flow boiling is in good agreement with the empirical correlations of pool boiling and hence represents the initial microlayer thickness.
Apart from empirical models, several theoretical models have also been proposed in the open literature for predicting initial microlayer thickness. Cooper & Lloyd (Reference Cooper and Lloyd1969) measured base temperature during the bubble growth and performed a thermal boundary layer analysis to estimate the initial microlayer thickness using the following correlation:
 \begin{equation}{\delta _o}({R_b},t) = {C_o}\sqrt {vt} .\end{equation}
Here δo represents the maximum initial microlayer thickness at time t and corresponding radius Rb, ν is the kinematic viscosity of the working fluid and Co is a constant. Many researchers have determined the value of Co for the case of pool boiling using different approaches, as summarized in table 2.
Values of Co for corresponding approach followed by different researchers.

In one of the recent works, Jung & Kim (Reference Jung and Kim2018) modified the hydrodynamic model of Smirnov (Reference Smirnov1975) by including the effects of surface tension, the non-hemispherical shape of the vapour bubble and residual flow inside the microlayer. The modified model obtained by Jung & Kim (Reference Jung and Kim2018) for the estimation of initial microlayer thickness is given by
 \begin{equation}{\delta _0} = 0.53 \times \sqrt {\frac{{2\nu t}}{{\left( {\frac{8}{{{a^3}}} + 1} \right)({1 - n} )+ \frac{2}{{{a^3}}}\left( {\frac{1}{n} - 1} \right)(n - 2) + {a^2}0.66n + \frac{{4\sigma }}{{{a^3}\rho {C^4}{n^2}{t^{4n - 3}}}}}}} .\end{equation}
Here, the coefficient 0.53 accounts for the residual flow, a is the ratio of microlayer radius to the bubble base radius (a = Rm/Rb), a parameter that accounts for the shape of the vapour bubble, C and n are the growth parameters of the vapour bubble as R(t) = Ct n, and σ is the surface tension of the working fluid. It is to be mentioned that the modified model by Jung & Kim (Reference Jung and Kim2018) works well when the bubble growth follows R(t) ∝ t 0.5. In the context of the present work involving flow boiling configuration, the growth exponent (n) has been found to be in the range of 0.3–0.4. This range of growth exponent (n) values is well within the range reported by Thorncroft, Klausner & Mei (Reference Thorncroft, Klausner and Mei1998) for the case of upward flow boiling. Following this, to compare the present experimental data with Jung's (Reference Zeng, Klausner and Mei2018) model, the growth exponent has been chosen to be 0.5. The corresponding growth constant C has been obtained as the slope of the plot between the bubble radius (in the ordinate) and t 0.5 (in the abscissa). The difference between growth parameters using different fitting approaches and the corresponding R 2 values is shown in figure 17 for Re = 3600 and 6000. Figure 17 clearly shows that the choice of the value of growth exponent as 0.5 results in larger fitting errors, which can be noticed in terms of the reduced R 2 values.
Bubble growth curve and the corresponding fit equation during the rapid initial growth phase: (a) curve fit and (b) linear fit with fix exponent of 0.5.

Figure 18 compares different analytical models for the initial microlayer thickness with the experimental data of the present work. Following Jung & Kim (Reference Jung and Kim2018), the theoretical data plot was obtained by considering the growth exponent n to be 0.5 for both Reynolds numbers. The theoretical models reported by Olander & Watts (Reference Olander and Watts1969), Van Ouwerkerk (Reference Van Ouwerkerk1971) and Smirnov (Reference Smirnov1975) overpredict the values of the initial microlayer thickness in comparison to the present experimental data. The solid line represents the prediction plot proposed by Jung & Kim (Reference Jung and Kim2018), which is in close agreement with the present experimental data (till the maximum microlayer thickness) for both flow rates. Irrespective of the flow rates, the prediction plot for a = 0.6 (suggested value by Jung & Kim (Reference Jung and Kim2018)) overpredicts the present experimental data and a = 0.5 slightly underestimates the present measurement. This implies that the factor a plays an important role in the accurate prediction of the initial microlayer thickness. Thus, the prediction error can be reduced significantly by choosing a more accurate value of the factor a. In the present experiments, the average value of a was obtained to be 0.8 for Re = 3600 and 0.7 for Re = 6000 during the initial growth period. However, higher values of this factor (higher than the one suggested by Jung & Kim (Reference Jung and Kim2018), a = 0.6) result in the overprediction of the present experimental data. Nevertheless, it is to be noted that accurate measurement of the microlayer radius and bubble base radius is very challenging due to low signal-to-noise ratio while identifying the outer edge of the microlayer and high refraction effects due to the presence of strong temperature gradients near the bubble base.
Radial distribution of the initial microlayer thickness and its comparison with the available theoretical models for (a) Re = 3600 and (b) Re = 6000.

4.4. Role of microlayer evaporation towards bubble growth
To understand the role of the various heat transfer mechanisms that contribute towards the bubble growth process, the experimentally obtained bubble growth curves (shown earlier in figure 11) have been compared with the well-established theoretical bubble growth model by Mikic, Rohsenow & Griffith (Reference Mikic, Rohsenow and Griffith1970). The analytical model given by Mikic et al. (Reference Mikic, Rohsenow and Griffith1970) for bubble growth in a uniformly superheated liquid is expressed as
 \begin{equation}{R^ + } = {\textstyle{2 \over 3}}[{({t^ + } + 1)^{3/2}} - {({t^ + })^{3/2}} - 1],\end{equation}
where
 \begin{gather}{R^ + } = \frac{R}{{{B^2}/A}},\quad {t^ + } = \frac{t}{{{B^2}/{A^2}}},\end{gather}
 \begin{gather}A = {\left[ {b\frac{{\Delta T{h_{fg}}{\rho_v}}}{{{T_{sat}}{\rho_l}}}} \right]^{1/2}},\quad B = {\left[ {\frac{{12}}{{\rm \pi} }J{a^2}{\alpha_l}} \right]^{1/2}},\quad Ja = \frac{{{\rho _l}{C_{pl}}({T_{sup}} - {T_{sat}})}}{{{\rho _v}{h_{fg}}}}.\end{gather}
This model broadly categorizes the bubble growth process into two regimes, namely: (a) inertia-driven growth for  ${t^ + } \ll 1$, and (b) diffusion-controlled growth for
 ${t^ + } \gg 1$. In general, the early stage of bubble growth (immediately after bubble inception) is governed by the dominance of the Laplace pressure difference (p − p ∞ = 2σ/R) existing across the liquid–vapour interface. As the vapour bubble radius increases, the pressure difference across the liquid–vapour interface decreases, subsequently reducing bubble growth rates. After the initial inertia-driven bubble growth process, the growth of the vapour bubble occurs primarily due to thermal energy diffusion across the bubble interface. This phase is generally termed ‘diffusion-driven bubble growth’ (Collier & Thome Reference Collier and Thome1994; Carey Reference Carey2008). Even though it is widely believed that the inertia-driven growth of the vapour bubble exists for a very small duration (~0.1 ms), followed by heat transfer through the evaporation of the superheated liquid layer at the liquid–vapour interface, to the best of our knowledge, direct experimental evidence for this phenomenon is not available in the open literature.
To elucidate on the various heat transfer mechanisms and to understand the role of the microlayer evaporation process, the experimentally obtained bubble growth curves of the present work have been compared with Mikic et al.'s (Reference Mikic, Rohsenow and Griffith1970) bubble growth model. It is to be mentioned here that the growth curve from experimental data has been generated for ΔTsup = 10 K (Ja = 30), which is the typical average wall superheat level observed for similar experimental conditions (Sinha & Srivastava Reference Sinha and Srivastava2020a). With reference to the model by Mikic et al. (Reference Mikic, Rohsenow and Griffith1970), for 0.1 < t + < 10, the bubble growth process is influenced by contributions from both inertial effects and thermal energy diffusion from the superheated fluid enveloping the vapour bubble; meanwhile, for  ${t^ + } \gg 1$ (t + > 10), inertial effects become negligible and the bubble growth process can be considered to be purely diffusion driven.
Initiation of microlayer formation has been observed with the inception of the vapour bubble (figure 5). Initially, the microlayer forms and grows at the bubble base and absorbs thermal energy from the heated wall. One can see from figures 13 and 14 that, for any given Reynolds number and angular direction, the reduction in the microlayer thickness during the early growth stage (t  $\lesssim$ 0.3 ms) is quite negligible, which can be seen in the form of overlapping thickness plots in the initial stages. This suggests that the microlayer does not play any significant role in the initial growth of the vapour bubble. Thus, the initial growth of the vapour bubble, for t
 $\lesssim$ 0.3 ms, is predominantly governed by the pressure difference (inertia-driven) and evaporation of the superheated liquid layer enveloping the nucleating vapour bubble (diffusion-controlled growth). Experimental evidence of a superheated liquid layer enveloping (Representative schlieren images, corresponding to the three growth phases of the vapour bubble, have been provided in figure 19. The red background of the images represents the uniform subcooled bulk fluid conditions and the appearance of colour contrast/redistribution in the vicinity of the heated wall indicates the extent of the thermal boundary layer. The vapour bubble, in its initial growth phase, can be seen to be completely enveloped by the layer of superheated fluid in the first schlieren image shown. A bubble protruding out of the thermal boundary layer and subsequent scavenging phenomenon as a result of its lift-off from the heated wall can be observed in the second and third schlieren images, respectively.) the vapour bubble during the initial growth phase has been reported in one of our previous works (Sinha & Srivastava Reference Sinha and Srivastava2020b). Hence, the combined effect of inertia growth and faster evaporation of the enveloping superheated liquid layer leads to an initial rapid growth of the vapour bubble. However, as the bubble grows in size, the relative contribution of the superheated liquid layer reduces as the top portion of the vapour bubble protrudes out of the thermal boundary layer (as shown in inset (2) of figure 19). This results in a decreasing growth rate of vapour bubble after t > 0.3 ms.
Comparison of bubble growth behaviour with Mikic's (Reference Mikic, Rohsenow and Griffith1970) growth model.

For t > 0.3 ms (which is t + > 10 in figure 19), the bubble growth phenomenon observed in the present work falls in the transition region between the purely inertia-driven and diffusion-driven regimes with decreasing growth rate. In this region, microlayer evaporation plays a major role in the growth of the vapour bubble, which is evident from figures 13 and 14, wherein a significant reduction in the microlayer thickness is to be seen. For a certain time duration, the bubble growth rates (slope of the experimentally obtained data points) is seen to be nearly similar to the slope of the bubble growth curve by Mikic's model, and then the bubble growth curve deviates from the prediction of Mikic's model, indicating a significant reduction in the bubble growth rate. Interestingly, the instant from which the bubble growth curve shows deviation from Mikic's model has been observed to be t ≃ 1.1 ms (t + > 10) for Re = 6000 and t ≃ 2.2 ms for Re = 3600. These time instants also correspond to the maximum spread of the microlayer in the upstream side for the respective Reynolds numbers. One can also notice that, at these time instants, the size of the vapour bubble nearly approaches its maximum size. Thus, it can be inferred that the bulk of the vapour bubble growth occurs till the microlayer achieves its maximum spread in the upstream side under flow boiling conditions.
As the vapour bubble continues to grow with time, it changes its shape from hemispherical to round and subsequently deforms due to the influence of bulk flow, which results in shrinkage of the microlayer region from the upstream side (as observed in figure 5h′–l′). This, in turn, reduces the effective heat transfer area available for microlayer evaporation. The effect of bubble deformation was first seen in the form of a reduction in the upstream microlayer at t ≃ 2.2 ms for Re = 3600 and t ≃ 1.1 ms for Re = 6000. This shape change/deformation causes the bulk fluid to flow towards the bubble base region (Okawa et al. Reference Okawa, Ishida, Kataoka and Mori2005). The incoming liquid could lead to reduction in the temperature of the upstream superheated liquid layer at the bubble base (experimentally observed and reported in Cao et al. (Reference Cao, Kawara, Yokomine and Kunugi2016) and Sinha & Srivastava (Reference Sinha and Srivastava2020a)). A similar reduction in the liquid temperature in the downstream base region is realized due to the vigorous mixing in the bubble wake area. Moreover, as the bubble grows in size, the condensation from the bubble top portion increases, which further reduces the effective growth of the vapour bubble. Thus, the coupled effect of decreasing microlayer area (due to shape change), decreasing superheat level of the liquid at the bubble base and condensation through the top portion of the vapour bubble exposed to the bulk fluid significantly reduces the bubble growth rate, which provides a plausible explanation for the observed deviation of the bubble growth curves from Mikic's growth model (figure 19).
5. Conclusions
The present experimental work reports on the bubble behaviour and microlayer dynamics simultaneously during the growth process of a single vapour bubble in a vertical channel under subcooled flow boiling conditions. Experiments have been carried out with water at atmospheric pressure conditions for varying Reynolds numbers at constant bulk subcooling and supplied heating power. The primary findings of the present experiment are summarized as follows:
(1) A microlayer forms with the inception of the vapour bubble and grows rapidly during the initial growth period. The microlayer grows symmetrically during the early growth stage (t < 0.3 ms); thereafter, it expands asymmetrically in both the longitudinal and lateral directions. Initially, the microlayer grows almost in a linear fashion, giving it a wedge-shaped profile, before it deforms at its outer periphery as a curve/bent shape. In the later stages of the bubble growth, the microlayer begins to vanish from the upstream side and radially expands in the downstream region due to the deformation of the vapour bubble under the influence of bulk flow. This bubble deformation results in the formation of a plateau region at the outer edge of the microlayer in the downstream side.
(2) A dryspot was found to appear after the early growth stage. The radial growth rate of the dryspot was found to be smaller than the expansion rate of the outer edge of the microlayer. The dryspot grows radially (circular shape) in the initial growth period, then deforms to an oval shape during microlayer depletion in the upstream region, followed by a reduction in its size till bubble detachment. The oval shape of the dryspot was found to be the result of the local disturbances induced in the top region of the dryspot (downstream side), which further amplifies with time and penetrates the downstream core region of the microlayer.
(3) A significant difference was observed between the actual lift-off (disappearance of the dryspot) and apparent lift-off (detachment observed from the side view) of the vapour bubble. The overall sliding of the vapour bubble can be divided into two parts: (a) sliding on the heated wall (displacement of the dryspot), and (b) sliding after lift-off by moving very close to the heated wall. Different sliding patterns of the vapour bubble resulted in different heat transfer mechanisms.
(4) Both the microlayer thickness and its radial spread were seen to reduce quite significantly with increasing Reynolds number. For Re = 3600, the maximum microlayer thickness of δ ~ 3.5 μm was observed for the vapour bubble of diameter 1.6 mm at t = 0.7 ms, having almost a wedge shape. Similarly, for Re = 6000, the maximum microlayer thickness of δ ~ 2.5 μm was obtained for the vapour bubble of diameter 1.1 mm at t = 0.4 ms.
(5) The initial microlayer thickness data obtained in the present flow boiling experiments showed good agreement with the available empirical and theoretical models of initial microlayer thickness for pool boiling conditions.
(6) While the initial phase of the bubble growth in nucleate flow boiling was observed to be almost similar to that under pool boiling conditions, distinct differences in the two configurations were observed during the diffusion-dominated growth regime. In contrast to the symmetric growth and depletion of the microlayer under pool boiling conditions, experiments performed under the flow boiling regime showed that the microlayer rapidly deteriorated in the upstream region and elongated on the downstream side (due to bubble deformation caused by bulk flow). Also, while the microlayer completely depletes in the case of pool boiling, it continues to exist even after the vapour bubble gets detached from the heated wall under the flow boiling configuration.
Funding
The authors acknowledge the support received from the Department of Science and Technology (DST), India (Grant ID RD/0119-DST0000-007).
Declaration of interests
The authors report no conflict of interest.
Appendix A. Analysis of thin-film interferograms
Following the principles of interferometry, the intensity field of a typical fringe pattern formed can be expressed by
 \begin{equation}I(x,y) = A(x,y) + B(x,y)\,\textrm{cos}[\Delta \phi (x,y)].\end{equation}
Here I(x, y) represents the intensity field, A(x, y) is the background intensity, B(x, y) is the fringe amplitude and Δϕ(x, y) represents the desired phase difference of two reflected beams. The primary objective of the quantitative analysis of fringe patterns is to determine the phase distribution field. In this direction, several phase-detection strategies based on (a) Fourier phase shift (Naylor & Duarte Reference Naylor and Duarte1999; Newport, Sobhan & Garvey Reference Newport, Sobhan and Garvey2008), (b) Hilbert transform (Onodera, Watanabe & Ishii Reference Onodera, Watanabe and Ishii2005; Kumar, Mohan & Kothiyal Reference Kumar, Mohan and Kothiyal2010; Wang et al. Reference Wang, Xue, Lai and Li2013), and (c) one- and two-dimensional (2-D) wavelet-based algorithms (Abid et al. Reference Abid, Gdeisat, Burton, Lalor and Lilley2007; Tay et al. Reference Tay, Quan, Sun and He2007; Ma et al. Reference Ma, Wang, Pan, Hoang, Vo and Luu2011) have been proposed in the literature to determine the phase difference map from the intensity distribution.
In the present study, such standard techniques cannot be applied directly due to various factors associated with the fringe complexities, such as varying fringe density, degree of fringe deformation, lack of carrier frequency, increased noise levels, etc. Hence, for the quantification of such complex interferograms, most works in the literature employ optimization-based fringe demodulation strategies (Servin, Marroquin & Cuevas Reference Servin, Marroquin and Cuevas1997, Reference Servin, Marroquin and Cuevas2001; Kai & Kemao Reference Kai and Kemao2013). Such algorithms are generally computationally intensive and require minimization of many experimental parameters.
Recently, Kai & Kemao (Reference Kai and Kemao2010) proposed a modified fast version (FFSD) of the well-established frequency-guided sequential demodulation (FSD) (Kemao & Hock Soon Reference Kemao and Hock Soon2007) phase determination methodology, which is much faster for processing multiple images. In this methodology, the first step is to remove the background intensity of images using a low-pass filter. In the present analysis, in addition to the use of a low-pass filter, the non-uniform intensity variation in the images was removed using a bi-dimensional empirical mode decomposition method (Sasikanth 2021). The intensity field after the normalization of the fringe amplitude (Quiroga, Gómez-Pedrero & García-Botella Reference Quiroga, Gómez-Pedrero and García-Botella2001; Servin et al. Reference Servin, Marroquin and Cuevas2001) is given by
 \begin{equation}{I_n}(x,y) \approx \cos [\Delta \phi (x,y)].\end{equation}
With the background intensity removed, the first estimate of phase difference map can then be determined from the normalized intensity map as
 \begin{equation}\Delta {\phi _0}(x,y) = co{s^{ - 1}}[{I_n}(x,y)].\end{equation}
Owing to the sign scheme of the cosine function (positive in the first and fourth quadrants), direct inversion to retrieve the phase map from (A3) results in an ambiguity in sign in the phase map. As a result, the phase difference map thus estimated through (A3) contains a sign ambiguity, i.e. Δϕ(x, y) = ±Δϕ o(x, y).
In order to correct the sign of the wrapped phase map, a sign determination scheme summarized through (A4) has been applied. The sign of the phase values determined through (A3) can be found by applying the gradient operation on (A2) and dot product with  $\boldsymbol{\nabla }[\Delta \phi (x,y)]$:
 \begin{equation}\boldsymbol{\nabla }{I_n}(x,y)\boldsymbol{\cdot }\boldsymbol{\nabla }[\Delta \phi (x,y)] ={-} \sin [\Delta \phi (x,y)]\,{|{\boldsymbol{\nabla }[\Delta \phi (x,y)]} |^2}.\end{equation}
Here ∇I(x, y) = [Ix(x, y), Iy(x, y)] represents the intensity gradient and ∇[Δϕ(x, y)] = [ωx(x, y), ωy(x, y)] represents the local frequency or carrier frequency. Given that  ${|{\boldsymbol{\nabla }\phi (x,y)} |^2} \ge 0$, and for
 $\mathrm{\Delta }\phi (x,y) \in ( - {\rm \pi},{\rm \pi} ]$, we can write that
 $\textrm{sign}[\sin \{ \phi (x,y)\} ] = \textrm{sign}[\phi (x,y)]$, then the sign of the phase difference map is then given by
 \begin{equation}\textrm{sign}[\Delta \phi (x,y)] ={-} \textrm{sign}[\boldsymbol{\nabla }I(x,y)\boldsymbol{\cdot }\boldsymbol{\nabla }\{ \Delta \phi (x,y)\} ].\end{equation}
To ensure a smooth and continuous phase map, the intensity and the phase gradient in (A3) are smoothed in a small window 5 × 5. The smoothing operation is given by
 \begin{gather}\Delta {\phi _{0\,x}}(x,y) + \textrm{j}\Delta {\phi _{0\,y}}(x,y) = \omega (x,y)\,{\textrm{e}^{\theta (x,y)}},\end{gather}
 \begin{gather}{\tilde{\omega }^2}(x,y)\,{\textrm{e}^{\textrm{j}2\tilde{\theta }(x,y)}} = \frac{1}{N}\sum\limits_{(\varepsilon ,\eta ) \in {N_{xy}}} {{\omega ^2}(\varepsilon ,\eta )} \,{\textrm{e}^{\textrm{j}2\theta (x,y)}}.\end{gather}
With the smoothed intensity and phase gradient map known ((A4)–(A5)), the sign of the phase map at any given pixel can be corrected through
 \begin{equation}\boldsymbol{\nabla
}[\Delta \phi ({x_a},{y_a})] = \begin{cases}
{\boldsymbol{\nabla }[\Delta {{\tilde{\phi
}}_0}({x_a},{y_a})]}&{\textrm{if}\;\boldsymbol{\nabla
}[\Delta \phi ({x_s},{y_s})]\boldsymbol{\cdot
}\boldsymbol{\nabla }[\Delta {{\tilde{\phi
}}_0}({x_a},{y_a})] \ge 0,}\\ { - \boldsymbol{\nabla
}[\Delta {{\tilde{\phi
}}_0}({x_a},{y_a})]}&\textrm{if}\;\boldsymbol{\nabla
}[\Delta \phi ({x_s},{y_s})]\boldsymbol{\cdot
}\boldsymbol{\nabla }[\Delta {{\tilde{\phi
}}_0}({x_a},{y_a})] < 0.
\end{cases}\end{equation}
The selected pixel is represented by (xs, ys), and (xa, ya) represents one of the adjacent pixels. Thus, the sign-corrected phase is determined using (A8), and is then wrapped between –π and π. This discontinuous phase map is to be unwrapped using a 2-D phase unwrapping methodology (Kemao, Gao & Wang Reference Kemao, Gao and Wang2008; Xia et al. Reference Xia, Montresor, Guo, Li, Yan, Cheng and Picart2016). The unwrapped phase map with continuous values is then related to the OPD between the two reflected beams using
 \begin{equation}\textrm{OPD} = \frac{\lambda }{{2{\rm \pi} }}\Delta \phi (x,y).\end{equation}
In the presence of the microlayer, the optical path difference in a laser thin-film interferometer is given by (A9). Thus, the microlayer thickness at any radial location below the vapour bubble is then given by
 \begin{equation}2{n_l}{\delta _{ml}} = \textrm{OPD} = \frac{\lambda }{{2{\rm \pi} }}\Delta \phi (x,y),\end{equation}
where nl represents the refractive index of the microlayer liquid and δml represents the thickness of the microlayer at any given spatial location.
Appendix B. Calibration of thin-film interferometer
A calibration exercise was carried out to validate the optical alignment of the thin-film interferometer for thickness measurements of the order of a micrometre. The calibration experiments pertained to the estimation of size (and profile) of the air gap between a plano-convex lens with a focal length f = 250 mm (diameter of lens = 50 mm) and an optical flat (material BK-7, flatness λ/6). The values of the thickness of the air gap determined from the lased-based thin-film interferometer, as employed in the present work, and that using the standard Newton's ring set-up (Holmarc) are compared with each other. Figure 20 shows the thin-film interferograms of the air gap recorded using laser sources of different wavelengths: (a) λ = 632.8 nm (He–Ne laser), (b) λ = 458 nm (Ar-ion laser) and (c) λ = 589 nm (sodium vapour lamp used as the light source in Newton's ring experiments). The recorded interferograms were quantitatively analysed to estimate the thickness of the air gap using the following relations:
 \begin{gather}t = \left( {m + \frac{1}{2}} \right)\frac{\lambda }{{2n}}\textrm{,}\quad m = 0,1,2,3 \ldots ,\end{gather}
 \begin{gather}t = m\frac{\lambda }{{2n}}\textrm{,}\quad m = 0,1,2,3 \ldots .\end{gather}
Thin-film interferograms with lasers of wavelength λ = 632.8 nm (a) and 489 nm (b), and Newton's ring experiment with sodium lamp (λ = 589 nm) (c); and comparison of the thickness (air gap) retrieved from the three different methods (d).

Here, m indicates the sequence number of dark fringes from the centre and t is the corresponding thickness of the air gap. Following this, the thickness variation has been retrieved as a function of radial distance from the centre. The thickness profile obtained from thin-film interferometry (using (B1)) has been compared with the thickness profile retrieved from Newton's ring experiment (B2) for the same optical flat–lens arrangement. Figure 20(d) shows the profile of the air gap obtained from these two methods (laser-based thin-film interferometer and Newton's ring apparatus). The radial distribution of air-film thickness obtained using both configurations shows a reasonable agreement with each other, which, in turn, validates the optical arrangement of the thin-film interferometer employed in the present study for the estimation of microlayer thickness.
Appendix C. Measurement of bubble dynamic parameters
The size of the vapour bubble has been expressed in terms of spherical equivalent diameter (Deq). The bubble equivalent diameter has been obtained through a methodology in which the volume of the vapour bubble is represented by the sum of discretized volume of discs from bubble base to its apex. This is estimated from the binary mask generated from the time-lapsed videographic images recorded from the side. Figure 21 summarizes the methodology employed. The reasonable assumption of a stack of discs of varying diameter (Dk) and thickness equal to one pixel has been employed for the estimation of bubble volume. Subsequently, the equivalent bubble diameter has been determined as follows (application of this methodology can also be seen in some of the works reported in the literature, for instance Yabuki & Nakabeppu (Reference Yabuki and Nakabeppu2014)):
 \begin{equation}\left.\begin{aligned} V &= \displaystyle\sum_{k = bubble\;base}^{k = bubble\;apex} \dfrac{{\rm \pi} D_k^2 \times \textrm{pixel size}}{4},\\ D_{equivalent} &= \sqrt{\dfrac{{6V}}{{\rm \pi} }} .\end{aligned}\right\}\end{equation}
(a) Recorded videographic image of vapour bubble, (b) binary image with nomenclature and (c) schematic representations of ellipse fits to the actual bubble shapes at different stages of bubble growth for AR calculation.

Similarly, the bubble aspect ratio (AR) has been expressed as the ratio of minor to major axis of the fitted ellipse at any given time instant (figure 21).
Appendix D. Measurement of convective time scale
Quantification of convective time scales Dbubble/Vliquid requires measurement of the velocity field around the growing vapour bubble. In this direction, the PIV technique (Lavision, Germany) was integrated with the test channel to measure the instantaneous bulk velocity field. In the context of the present experiments, since the formation of a (single) vapour bubble is highly localized (to only one nucleation site over the entire length of the heater), it can reasonably be expected that the presence of a single vapour bubble would have a negligible influence on the upstream bulk flow conditions. In view of this, an ensemble average of the single-phase (bulk liquid under subcooled conditions) velocity field has been estimated and the corresponding convective time scales at different stages of the bubble growth process have been quantified by measuring the absolute fluid velocity at a height that corresponds to the diameter of the vapour bubble (apex of the vapour bubble). As part of the validation exercise of the present PIV measurements, the velocity fields obtained for Re = 3600, 4800 and 6000 (at constant subcooling level of ΔTsub = 5 K) have been compared with standard correlations of channel flows. Furthermore, in order to avoid any discrepancy between single-phase and two-phase velocity fields, the bulk fluid velocity field in the presence of growing vapour bubble (during boiling experiment) has also been determined under similar operating conditions. The velocity data thus obtained have been found to be in reasonably good agreement with the obtained single-phase velocity field at different heights of the growing vapour bubble. The convective time scales D(t)/V(t) obtained from the PIV-based velocity values at a height corresponding to the bubble diameter are compared with the time scales for bubble expansion (growth rate of vapour bubble dR(t)/dt). The results of the comparison have been presented in figure 10.
Appendix E. Errors and uncertainty analysis
Errors in the calculation of the microlayer thickness arise from the challenges in accurately identifying the fringe order. In order to quantify these errors, the thickness values obtained from (3.2) at the first and eighth fringes have been compared with the average thickness obtained using (A10) at different angular locations of these fringes. A maximum error of ~53 % was obtained for the first fringe near the contact-line region, whereas the maximum error in the calculation of the microlayer thickness at the location of the eighth fringe was limited to ~15 %. Relatively large errors in the microlayer thickness near the contact-line region are expected due to the inherent difficulties in correctly identifying the boundary of the contact line (over which the microlayer thickness has been assumed to be zero).
Uncertainties in the measurement of microlayer radius arise from the procedure followed to identify the inner and outer edges of the microlayer fringes. A maximum uncertainty of ≃3 pixels, which corresponds to ≃17.4 μm, was found in the measurement of the microlayer radius. Similarly, the uncertainty in the measurement of the equivalent bubble diameter was found to be ≃94.4 μm. These uncertainties represent the maximum standard deviation of the values obtained by repeating the masking procedure (six or seven times) of bubble periphery and microlayer region at any given time instant.


 Open access

