Introduction
The acquisition of sibilant fricatives by typically developing children has been reported across languages to continue well past the third year of life. According to a recent overview by McLeod and Crowe (Reference McLeod and Crowe2018), based on 27 different languages, exact figures differ depending on the language and specific phonemes. In English, 90% of children acquire /s/ and /ʃ/ phonemes after 4;0 [years;months], while only between 75% and 85% of children acquire these two phonemes during the third year. Physical growth of the vocal tract and the developing control of articulators play a role in the process of sibilant fricative acquisition, particularly since the production of these sounds involves strict and complex requirements on the tongue. Partly due to these factors, and partly due to the effect of the listeners’ native language constraints, children's productions during the acquisition process are more accurately characterised using instrumental data than auditory-based transcription (cf. Munson, Edwards, Schellinger, Beckman & Meyer, Reference Munson, Edwards, Schellinger, Beckman and Meyer2010). Acoustic correlates of lingual constriction parameters have been reported in a number of studies investigating the development of the alveolar and postalveolar fricative opposition, across languages (e.g., Nittrouer, Studdert-Kennedy & McGowan, Reference Nittrouer, Studdert-Kennedy and McGowan1989; Nittrouer, Reference Nittrouer1995; Li, Edwards & Beckman, Reference Li, Edwards and Beckman2009; Holliday, Reidy, Beckman & Edwards, Reference Holliday, Reidy, Beckman and Edwards2015; Reidy, Reference Reidy2015). Fine differences in the lingual configuration may have important perceptual consequences for sibilant fricatives, since the tongue position and shape are crucial for creating the required acoustic output. Direct articulatory data can provide valuable information on the development of the sibilant fricative contrast, and yet, to the author's knowledge, no systematic articulatory studies have addressed this question to date. The present study describes the development of the English voiceless sibilant fricative contrast during the third year of life, using synchronised ultrasound imaging data on tongue movements and acoustic data.
Between the ages of three and four years, typically developing children may have a range of productions for target sibilant fricatives. Perceptually correct and relatively prototypical productions would be expected for many children, but noticeable phonetic distortions and phonemic substitutions are also likely. In English, fricative realisations of /s/ can be perceived as dental, and various distorted realisations may sound closer to an alveolar sibilant or to a non-sibilant dental fricative (cf. Smit, Reference Smit1993; Edwards & Beckman, Reference Edwards and Beckman2008). The postalveolar fricative target in English may be perceptually confused with the alveolar fricative, and it can also have a variety of phonetically distorted fricative productions falling between alveolar and postalveolar in auditory characteristics. Instrumental data make it possible to assess the acoustic and articulatory characteristics of the two members of the fricative contrast, and to provide explanations for some of the variability in adult perceptions of children's fricatives. In the present study, instrumental measurements were complemented by perceptual analyses, in order to determine to what extent any perceptual inaccuracies in the children's productions were matched by immature acoustic and articulatory characteristics, and whether instrumental data showed evidence of phonemic contrast that was not reflected in perceptual data. This approach is comparable to that adopted in previous instrumental studies of young children's sibilant fricative production, which combined auditory-based categorical judgements with acoustic measurements (e.g., Li et al., Reference Li, Edwards and Beckman2009; Holliday et al., Reference Holliday, Reidy, Beckman and Edwards2015).
The acoustic measurement of the contrast that has most often been used in the description of the acquisition of /s/ and /ʃ/ in English is the fricative spectral centroid (e.g., Nittrouer et al., Reference Nittrouer, Studdert-Kennedy and McGowan1989; Nittrouer, Reference Nittrouer1995; Li et al., Reference Li, Edwards and Beckman2009; Holliday et al., Reference Holliday, Reidy, Beckman and Edwards2015). Psychoacoustic spectral measurements have also been used: in particular, the most prominent psychoacoustic frequency, or peak ERBN-number (e.g., Reidy, Reference Reidy2015). In adult productions, as well as in perceptually correct productions by children which are differentiated on frequency measures, /s/ has higher values on these measures than /ʃ/, due to the shorter front cavity for the former consonant. Additionally, when frequency is measured at several intervals over the duration of the consonant, adult productions of both /s/ and /ʃ/ are characterised by a concave frequency trajectory. The overall concave shape is a result of the narrowing of the vocal tract for the formation of the consonant constriction, followed by a vocal tract opening after the constriction. The alveolar consonant has a relatively larger difference between the centre and the periphery of the consonant than the postalveolar, and this difference has been explained by a proportionately greater displacement of the jaw for the alveolar fricative (Zharkova, Hardcastle & Gibbon, Reference Zharkova, Hardcastle and Gibbon2018; see also Iskarous, Shadle & Proctor, Reference Iskarous, Shadle and Proctor2011). The extent of differentiation between /s/ and /ʃ/ on the fricative centroid was shown by Zharkova et al. (Reference Zharkova, Hardcastle and Gibbon2018) to increase towards mid-consonant in adults, as well as in children aged between seven and thirteen years.
Acoustic studies of the acquisition of the voiceless sibilant fricative opposition in English demonstrate that, when measuring correctly perceived productions, the contrast becomes more pronounced with increasing age. For two-year-olds, no differentiation on the peak ERBN-number was shown between /s/ and /ʃ/ by Reidy (Reference Reidy2015). Three-year-old children were reported by Li et al. (Reference Li, Edwards and Beckman2009) to differentiate between the two fricatives on the centroid, measured during a 40 ms window centered at mid-consonant. Reidy (Reference Reidy2015) found that three-year-old children had a significantly higher peak ERBN-number for /s/ than for /ʃ/, although there was no significant difference between the two fricatives on the dynamics of the frequency change during the consonant in three-year-olds. In the same study, four- and five-year-old children were shown to differentiate between /s/ and /ʃ/ on overall frequency as well as on the dynamic pattern, in the direction reported for adults. The extent of separation between the two fricatives on acoustic parameters has been shown to be smaller in children between three and seven years old than in adults (e.g., Nittrouer et al., Reference Nittrouer, Studdert-Kennedy and McGowan1989; Nittrouer, Reference Nittrouer1995; Li et al., Reference Li, Edwards and Beckman2009; Holliday et al., Reference Holliday, Reidy, Beckman and Edwards2015). The most prominent frequency for /ʃ/ was demonstrated in several studies to decrease between the ages of two and seven years old, thus leading to an increased separation of the two fricatives (e.g., Reidy, Reference Reidy2015; see also Nittrouer, Reference Nittrouer1995; Nissen & Fox, Reference Nissen and Fox2005). In the present study, we may expect that correctly produced fricatives would be differentiated on the fricative centroid, and that the difference between /s/ and /ʃ/ would be clearer for overall centroid values than for the dynamic trajectory of the centroid during the fricative.
A number of acoustic studies of fricatives in English have reported that contrasts may develop gradually, and include a stage where the contrast in production is not yet matched by a contrast perceived by adult listeners (e.g., Li et al., Reference Li, Edwards and Beckman2009; Munson et al., Reference Munson, Edwards, Schellinger, Beckman and Meyer2010). This type of opposition, neutralised in perception and yet present in production, is referred to as “covert contrast”, and it has been described to occur for various phonemic contrasts at an early stage in the acquisition process, as well as in disordered speech (e.g., Macken & Barton, Reference Macken and Barton1980; Hewlett, Reference Hewlett1988; Scobbie, Gibbon, Hardcastle & Fletcher, Reference Scobbie, Gibbon, Hardcastle, Fletcher, Broe and Pierrehumbert2000; Li et al., Reference Li, Edwards and Beckman2009; see also Gibbon & Lee, Reference Gibbon and Lee2017, for a recent review). Such contrasts can actually be detected by listeners when asked to assess them on a continuous scale (e.g., Munson et al., Reference Munson, Edwards, Schellinger, Beckman and Meyer2010; Munson, Schellinger & Urberg-Carlson, Reference Munson, Schellinger and Urberg-Carlson2012), although instrumental data are required in order to identify the nature of the difference. Covert contrasts between /s/ and /ʃ/ on several acoustic parameters, including the fricative centroid, were reported for four-to-five-year-old children with speech sound disorder, with /s/ characterised by higher centroid values (Roepke & Brosseau-Lapré, Reference Roepke and Brosseau-Lapré2019). A covert contrast between /s/ and /ʃ/, which were both produced as a lateral fricative by a nine-year-old girl with disordered speech, was demonstrated using electropalatography, with more posterior articulations for the target postalveolar fricative (Gibbon, Hardcastle & Dent, Reference Gibbon, Hardcastle and Dent1995). In two- and three-year-old typically developing English speaking children, covert contrasts for the alveolar-postalveolar fricative opposition in the adult direction were shown on the fricative centroid, by Li et al. (Reference Li, Edwards and Beckman2009). In the present study, covert contrasts might be observed in any perceptual neutralisations of the two fricatives. This study, unlike previous instrumental studies focussing on the sibilant fricative opposition in children, had the advantage of using complementary acoustic and tongue movement data, and therefore the opportunity to make more accurate conclusions, potentially disambiguating the acoustic patterns which could combine information on the tongue, the lips (e.g., the rounding for /ʃ/), and the jaw.
Previous ultrasound tongue imaging studies of the sibilant fricative opposition in English have demonstrated that preadolescents and adults have differences in the dynamics of tongue movement during the fricative (Zharkova, Reference Zharkova2016), and that seven-year-old children have less tongue shape differentiation between alveolar and postalveolar fricatives than adults (Zharkova et al., Reference Zharkova, Hardcastle and Gibbon2018). In the latter study, which focussed on fricative differentiation in adults, as well as children aged seven, nine, eleven and thirteen years, Zharkova et al. (Reference Zharkova, Hardcastle and Gibbon2018) showed for all age groups that the tongue shape for /s/ was the most different from that for /ʃ/ towards the middle of the consonant, as opposed to its periphery. There is a growing number of ultrasound studies of speech by children under the age of five years (e.g., Song, Demuth, Shattuck-Hufnagel & Ménard, Reference Song, Demuth, Shattuck-Hufnagel and Ménard2013; Lin & Demuth, Reference Lin and Demuth2015; Zharkova, Reference Zharkova2018; Noiray, Abakarova, Rubertus, Krüger & Tiede, Reference Noiray, Abakarova, Rubertus, Krüger and Tiede2018; Barbier, Perrier, Payan, Tiede, Gerber, Perkell & Ménard, Reference Barbier, Perrier, Payan, Tiede, Gerber, Perkell and Ménard2020), although none of these studies has focussed on the realisation of the sibilant fricative opposition. In a recent ultrasound and acoustic study of the alveolar-velar stop opposition, including four children, a covert contrast in tongue shape was demonstrated in the productions of one child (McAllister Byun, Buchwald & Mizoguchi, Reference McAllister Byun, Buchwald and Mizoguchi2016a). The present work is, to the author's knowledge, the first systematic study of the sibilant fricative contrast using synchronised ultrasound and acoustic data, focussed on the age range that is likely to display covert contrasts for this phonemic opposition.
Due to the nature of ultrasound recordings of young children's tongue movements, it is a challenging task to reliably quantify differences in tongue shape. One potential complication is that the proportion of the tongue curve of interest in the investigation, such as the stretch between the shadow of the hyoid bone and the shadow of the chin, may not always be consistently imaged across repetitions and speakers, and some of the curve may be missing from the ultrasound image (see Zharkova, Gibbon & Lee, Reference Zharkova, Gibbon and Lee2017, for a more detailed discussion of this problem). Articulatory measurements should take this into account, in order to enable reliable comparisons across speakers, as well as comparisons across time points during a speech segment. In a recent study, Zharkova (Reference Zharkova2019) identified combinations of articulatory indices of tongue shape, which were more efficient in distinguishing between alveolar and postalveolar fricative tongue shapes than any one index on its own, producing robust results when the length of the tongue curve was manipulated, to simulate possible variation in real life. Such combinations can be used to reduce the sensitivity of individual indices to the variation in the imaged curve lengths, which is likely to be present in young children's tongue movement data. The current study used the combinations of indices from Zharkova (Reference Zharkova2019), and a detailed description is provided in the Method section below.
The present study used information from the fricative centroid frequency and articulatory indices of tongue shape, with the aim to investigate the production of the sibilant fricative opposition by three-year-old children. The dataset analysed in the study includes productions by ten children learning English. Since between the third and fourth birthday children are clearly in the process of acquisition of the /s/-/ʃ/ contrast, we can expect to observe different stages of this process, even with a relatively modest cohort of ten speakers. The members of the pair would likely be differentiated on acoustic and tongue shape measurements by most children, although noticeable variability is also to be expected, since not all speakers in this age group would be producing auditorily adult-like sibilant fricatives. Based on previously published acoustic findings, we would expect that any differentiation between the two fricatives on the dynamic trajectory of the centroid and the tongue shape change would be less prominent than the mean differentiation measured over the duration of the consonant. Finally, we may expect to observe covert contrasts for any realisations where the two target fricatives are neutralised in perception.
Method
Participants and recording procedure
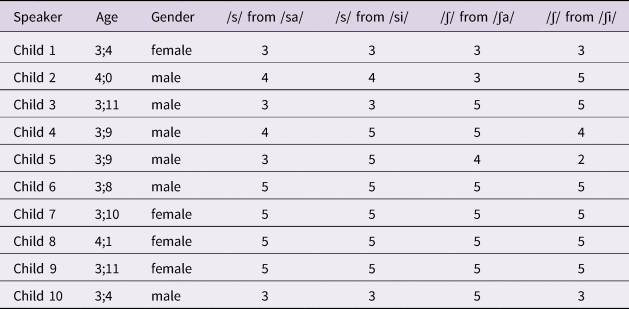
The ten speakers were typically developing children, aged between 3;4 [years;months] and 4;1 (mean age 3;9, standard deviation 0;3), all native speakers of Scottish Standard English. None of the participants had any known hearing or speech disorders, as determined by parental report. All the parents or carers were female, and all spoke English as their native language. Further information on the participants is available in Table 1. The materials were the syllables /ʃi/, /ʃa/, /si/ and /sa/, in the carrier phrase “It's a …, Pam”. The children repeated the phrase after their parent or carer, and the aim was to obtain five repetitions of every target. Repetition was used in this study, as opposed to other means of data elicitation (such as spontaneous production) in order to maximise the chances of eliciting the required material in a relatively short amount of time, to keep the participants concentrated on the task throughout the relatively cumbersome ultrasound recording procedure. During the recording, the children sat in front of a computer display, in their carer's lap. The stimuli were presented to the participants in English orthography, accompanied by images corresponding to the target CV syllables. The target syllables were spelled as “she”, “shah”, “sea” and “Sah”. The first three syllables were real words (“shah” was presented to the participants as the word used to refer to a king of a distant land), and the last syllable, which was the only nonsense word, was presented as the name of an imaginary creature. Real and nonsense words were combined in order to achieve consistency in the segmental context for the target consonants. Participants were familiarised with the target syllables before the recording began. The data were a part of a larger dataset, and more details on that dataset are available in Zharkova (Reference Zharkova2018).
Details of participants and the number of target fricative tokens analysed.

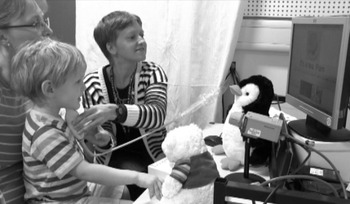
Tongue movements in the midsagittal plane were recorded using an Ultrasonix Sonix RP ultrasound scanner with a C9-5/10 microconvex transducer, and Articulate Assistant Advanced software (Articulate Instruments Ltd, 2012). The ultrasound frame rate was 100 Hz. The acoustic signal, synchronized with the ultrasound signal, was recorded at 22050 Hz using an Audiotechnica AT803d microphone, clipped to the participant's clothing. The ultrasound transducer was hand-held by the experimenter. The data collection session for each participant was simultaneously recorded on two video cameras, to guide the token selection for the analysis. The recording setup is illustrated in Figure 1.
The setup for participant recordings. The ultrasound transducer is hand-held by the experimenter, and the microphone cable is visible just underneath the transducer. A video camera facing the participant is one of the two cameras that were used; the other video camera, not pictured here, recorded the participant in profile.

Selection of tokens and perceptual analyses
Information from the video cameras was used to establish that the token to be analysed had stable positioning of the ultrasound transducer throughout the target CV syllable, and that the shadow of the mandible and the shadow of the hyoid bone were both visible on the screen, with the midsagittal tongue curve located between the two shadows. Table 1 has the details on the fricative realisations produced by each child that satisfied these criteria. All the tokens referred to in the table were subjected to an auditory and visual analysis by the author to assess if they were correct realisations of the target fricatives (i.e., categorised perceptually as belonging to the relevant phonemic category), and to make a phonetic transcription of the tokens using the International Phonetic Alphabet. For coding productions that were intermediate in quality between two different sounds (e.g., [s] and [θ]), the study used the approach described by Beckman, Plummer, Munson, and Reidy (Reference Beckman, Plummer, Munson and Reidy2017), with a two-symbol notation, where the first symbol represented the sound perceptually closer to the token (e.g., [s:θ]).
One child (C10) perceptually neutralised the two fricatives in both vowel contexts, consistently producing a glottal fricative at the onset of all four target CV syllables. The other nine children had an audible contrast between the two fricatives in at least one vowel context. Of those nine children, six speakers (C2, C3, C6, C7, C8, C9) produced all fricative tokens correctly, and another two speakers (C4 and C5) produced all tokens of /ʃ/ correctly. Phonetically, correctly produced tokens were characterised either as prototypical productions or as relatively marginal realisations still clearly falling within the relevant phonemic category. C1 had two realisations of /ʃ/ from /ʃi/ perceived as [s]. Productions of /s/ by three children (C1, C4 and C5) were shown on the face video as dental/interdental in varying degrees. C1 produced one repetition of /s/ from /sa/ as an audibly dental non-sibilant fricative, and the face video data confirmed that impression by showing an interdental production. For the other /s/ tokens by this child, the tongue was visible on the video recording during the constriction interval. These tokens were perceived as [s], except one token of /s/ from /si/, which was heard as a somewhat distorted realisation of /s/, closer to [s] than to [θ]. The video camera data showed interdental productions of the target /s/ in both vowel contexts for C4 and C5, particularly noticeable for the latter child. Productions by C4 were heard as fricatives closer in quality to [s] than to [θ], while productions by C5 were perceptually closer to [θ] than to [s].
For a reliability check of the auditory analysis, another phonetician independently transcribed 25% of the data, without accessing face video or ultrasound video information, and otherwise adhering to the same criteria as the main transcriber. The selection included tokens produced by each participant, with over a third of these tokens taken from the two youngest participants, C1 and C10. Interrater agreement on whether a given production was phonemically correct was 95% overall, and 89% when averaged over the productions of the two youngest children. For every token included in the reliability check, the two raters agreed on whether the chosen phonetic symbol (or the first symbol in two-symbol combinations like [s:θ]) was a sibilant fricative.
Articulatory and acoustic analyses
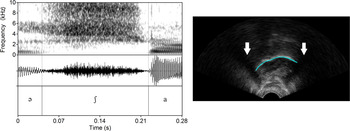
For annotation, tongue curve fitting and normalisation for time within Articulate Assistant Advanced, the same procedure was used as that described in Zharkova et al. (Reference Zharkova, Hardcastle and Gibbon2018). The onset of the frication noise in the acoustic signal was taken as the consonant onset. Seven of the children produced between one and eight preaspirated fricative tokens (in total, 14% of the tokens). In those tokens, the preaspiration interval was not included in the consonant annotation. For every fricative token, the onset of the periodic signal following the consonant was taken as the consonant offset. In each token, tongue curves were traced for every ultrasound frame (i.e., every 10 ms) between frication onset and offset. The tongue curve tracing was carried out automatically for each consonant token, and manual correction was applied where required. The normalisation for time consisted in exporting, for each fricative token, xy coordinates for the tongue curves at nine equally spaced time points, with the first and the last point corresponding to the consonant onset and offset, respectively. Figure 2 shows an example waveform and spectrogram of a token of /ʃ/ produced by one of the speakers, as well as an ultrasound image corresponding to the onset of the consonant.
The left panel shows an acoustic record of a typical token of /ʃ/ from /ʃa/ produced by participant C7, including the annotation for the consonant (parts of the surrounding vowels from the phrase “It's a shah, Pam” are also shown). The right panel displays an ultrasound frame corresponding to the consonant onset for this token. The front of the tongue is on the right, both in this figure and in Figure 3. A thick curve superimposed on the ultrasound image illustrates the tracing of the tongue edge. On the left and on the right of the tongue curve, there are dark areas indicated by arrows, which correspond to the shadows of the hyoid bone and of the mandible, respectively.

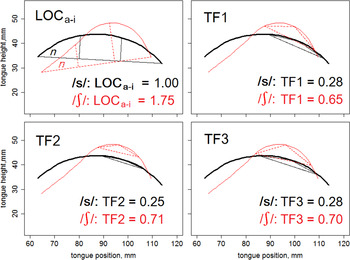
For quantifying articulatory differences between the two fricative consonants, the present study adopted the method developed in Zharkova (Reference Zharkova2019). That study identified combinations of articulatory measures as optimal for distinguishing between tongue shapes for /s/ and /ʃ/, and those combinations were used in the analyses for the present paper. One of the measures was LOCa-i index originally described by Zharkova, Gibbon, and Hardcastle (Reference Zharkova, Gibbon and Hardcastle2015). The index was developed to capture changes in the relative location of tongue excursion along the midsagittal dimension. The other measures, first described by Zharkova (Reference Zharkova2019), were TF1, TF2 and TF3 (“TF” refers to “tongue front”). All four indices were calculated in R (R Development Core Team, 2017) for every fricative token at each of the nine time points, using the scripts written by the author. The indices are briefly described below, and their calculations are illustrated in Figure 3, using example tongue curves for the two fricative consonants.
Illustrations of the calculation of four articulatory indices. The two curves shown in each of the panels are taken from the temporal midpoint of the same two tokens produced by participant C9. The thick curve represents /s/ from /sa/, with thin solid lines illustrating the calculations for this curve; the thin curve represents /ʃ/ from /ʃa/, with thin dashed lines for the associated calculations.

LOCa-i quantifies the relative location of the most excursed part of the tongue, compared with the rest of the tongue curve. A straight line is traced between the two ends of the tongue curve (line n in the top left panel of Figure 3), and perpendiculars are traced to the curve from two points, located at one third and two thirds of line n. A ratio of these two perpendiculars is then taken, and this value is LOCa-i index. TF1, TF2 and TF3 indices quantify the shape of the front half to two thirds of the tongue contour, by assessing the degree of the tongue curvature from three selected points along the tongue surface. The locations of these points are specified in the three remaining panels of Figure 3, with triangles superimposed on the tongue curves connecting the points together. To calculate each index, the inverse of the radius of the circle passing through the three points is computed, and this value multiplied by ten produces the index value. TF1 is centred more anteriorly along the tongue curve than TF2 and TF3 (TF1 at 72.5% of the curve, and the other two indices at two thirds of the curve, starting from the left), and the difference between the latter two indices is that TF3 captures a wider region of the curve than TF2. For all four indices, in typical adult productions /ʃ/ has higher values than /s/, as a consequence of the generally greater extent of bunching of the front of the tongue, which is required to achieve a sublingual space for the postalveolar fricative. The combinations of indices used for the statistical comparisons of the two fricatives were as described by Zharkova (Reference Zharkova2019): TF1, TF3 and LOCa-i for the context of /a/, and TF2, TF1 and LOCa-i for the context of /i/.
Acoustic analysis was carried out in Praat (Boersma & Weenink, Reference Boersma and Weenink2016) and in R (R Development Core Team, 2017). The following procedure was applied to the data from all speakers except one child who replaced word-initial target sibilants with a glottal fricative (C10), one child whose recordings consistently showed a noise band partly overlapping with the high frequency fricative noise band, due to a technical issue (C9), and the productions of /s/ from /si/ by C3, since two of the three available tokens overlapped with external noise. Audio files containing the fricative tokens were band-pass filtered, with the low cut-off frequency of 300 Hz and the high cut-off frequency of 20000 Hz. Further acoustic analyses were performed in R, using the scripts developed by Reidy (Reference Reidy2013) and adapted by Romeo, Hazan, and Pettinato (Reference Romeo, Hazan and Pettinato2013). Multitaper spectra (Blacklock, Reference Blacklock2004) were calculated for the band-pass filtered fricative tokens, at each of eight equal intervals between the consonant onset and offset. There were eight orthogonal tapers (time-bandwidth parameter value NW = 4). No preemphasis was applied. Using the multitaper spectra, the fricative centroid was calculated for each token.
Statistical analyses
R (R Development Core Team, 2017) was used for the statistical analyses. General additive mixed models (GAMMs; Wood, Reference Wood2006; van Rij, Wieling, Baayen & van Rijn, Reference Van Rij, Wieling, Baayen and van Rijn2017) were carried out in order to analyse dynamic patterns of tongue shape and of the spectral centroid during the consonant. An ordered factor predictor was used, accompanied by a reference smooth, as well as an intercept term for the factor Consonant, i.e., a parametric coefficient representing the constant difference between the levels of the factor. The smooth with the ordered factor reflected the non-linear difference in trend over the course of the consonant between the two fricatives. In each model, the intercept difference between the two levels of the factor was used to establish the presence of overall mean differences. In order to conclude that the comparison groups had different trends over time, the smooth with the ordered factor needed to be significantly different from zero. For the comparison of dynamic articulatory and acoustic patterns across the two fricative consonants, GAMMs were carried out on the dependent variables (articulatory indices and the fricative centroid) in each vowel context, separately for each speaker. Each model included a random smooth for change over time by consonant within repetition, in order to account for differences in dynamic patterns across repetitions.
For each dependent variable, a Bonferroni adjustment was applied, based on twenty models focussed on the cross-consonant difference, i.e., two vowel contexts and ten speakers. Therefore, a given result was considered significant at the 0.05 level if its p value in the model was smaller than 0.0025. In the articulatory analyses, which included a combination of quantitative indices for each vowel context, the presence of a significant difference between the fricatives on at least two of the three different indices was taken as an indication that the child consistently differentiated between tongue shapes across the fricatives. Participant C5 produced only two tokens of /ʃ/ from /ʃi/, so the fricative pair in this vowel context for C5 was excluded from the inferential statistical analyses (for visualisation purposes only, the data for /ʃ/ from /ʃi/ for this speaker are included in Figures 5 and 7).
Results
Articulatory results
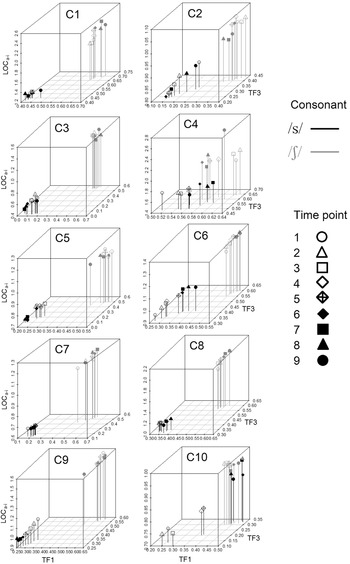
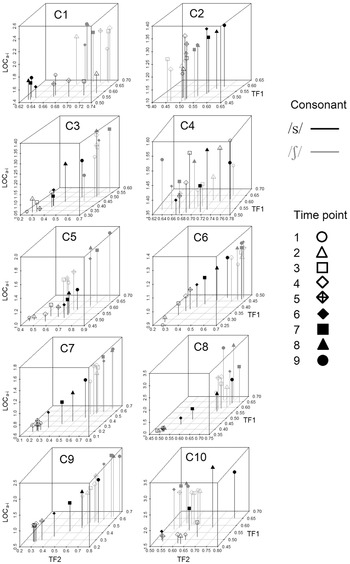
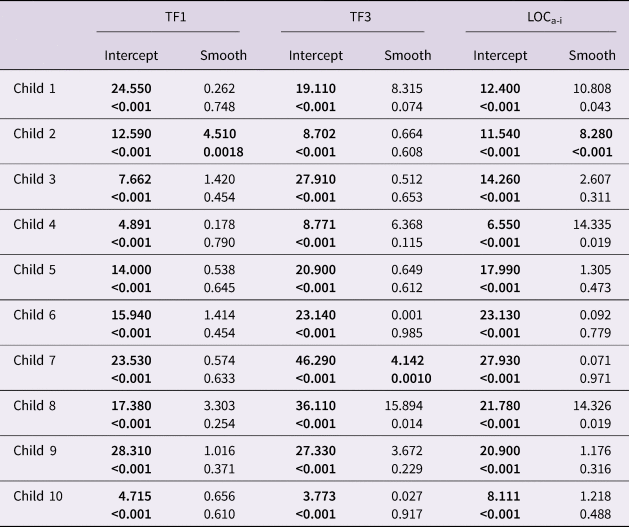
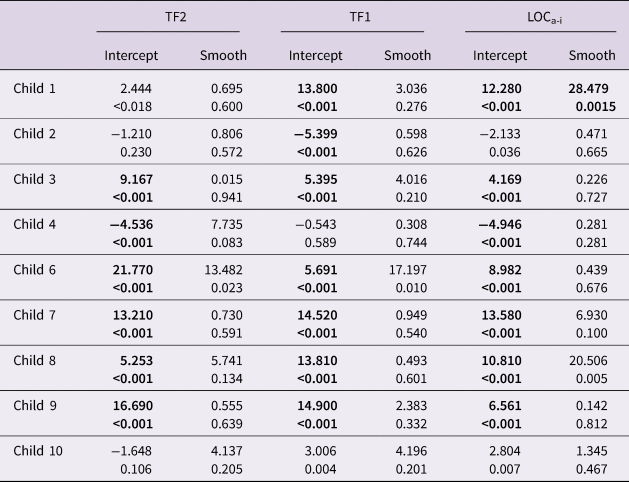
Figures 4 and 5 present the articulatory indices’ values for each of the speakers, in the context of /a/ and /i/, respectively. It is clear from the graphs that in general the extent of the two fricatives’ differentiation in tongue shape is more noticeable in the context of /a/, with all speakers having on average higher values of all three indices for the postalveolar fricative. This visual observation is confirmed by the statistical results presented in Table 2. All ten speakers differentiated between the two fricatives on the intercept in the low vowel context, on all three articulatory indices. Regarding the high vowel context, Table 3 shows that six speakers had consistently greater index values for the postalveolar consonant, reaching the criterion of having a significant cross-consonant difference on at least two indices. One child had significant across-consonant differences between /s/ from /si/ and /ʃ/ from /ʃi/ on two indices in the opposite direction to that in the other speakers, and two children did not consistently differentiate the tongue shapes for the two fricatives in the context of /i/. One speaker, C2, had significant cross-consonant differences on the smooth term for LOCa-i and TF1 in the context of /a/, reflecting the decrease in both indices’ values over the duration of /ʃ/. Otherwise, the two consonants did not differ from each other on the dynamics of tongue shape change.
Mean values of three articulatory indices used to differentiate between the two fricatives in the context of /a/, plotted for the nine time points during the fricative, separately for each speaker. The scales are different across speakers in this figure and in Figure 5, in order to facilitate visualisation.

Mean values of three articulatory indices used to differentiate between the two fricatives in the context of /i/.

The results of GAMMs on the articulatory indices in the context of /a/ for individual speakers, across consonants. Significant results are in bold font. For each result, the coefficient value is above the p value. In this table and in Table 3, positive coefficient values for the intercept mean that average values for a given index were larger for /ʃ/ than for /s/, while negative values represent the opposite scenario.

The results of GAMMs on the articulatory indices in the context of /i/ for individual speakers, across consonants. Significant results are in bold font. For each result, the coefficient value is above the p value.

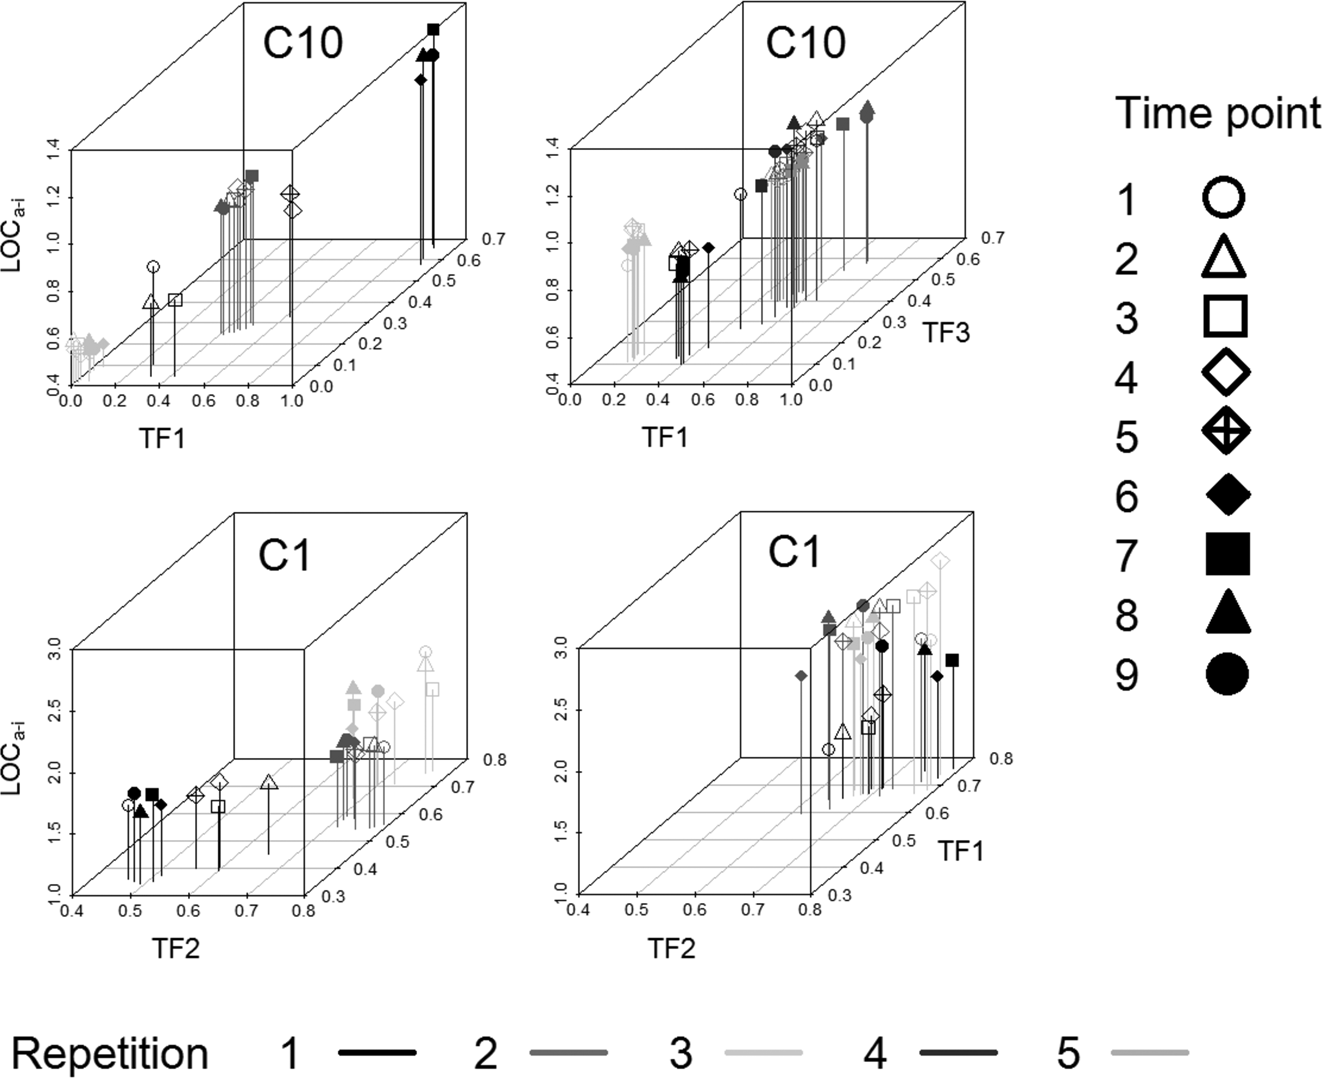
Participant C10, who had no audible contrast between the two fricatives in the target syllables, nevertheless exhibited a cross-consonant difference in tongue shape in the context of /a/ in the same direction as that in the other speakers. As shown in Figure 4, this difference was due to the fact that during the first half of target /s/ tokens the mean values of all three indices were consistently lower than the mean values for target /ʃ/ productions. Figure 6 (top row) shows articulatory indices for individual tokens produced by this participant in the context of /a/. The values for /s/ (left panel) are visibly more dispersed than the values for /ʃ/ (right panel). In particular, /s/ shows both the lowest and the highest individual values for all indices, when the data for both consonants are considered together. The only values for /s/ that are noticeably greater than any of the /ʃ/ values belong to the second half of one repetition, while the values for the first three time points of this token of /s/ are generally lower than those for the comparable time points of /ʃ/ productions.
Articulatory indices for individual repetitions for C10's productions of /s/ from /sa/ (top left panel) and /ʃ/ from /ʃa/ (top right panel), and for C1's productions of /s/ from /si/ (bottom left panel) and /ʃ/ from /ʃi/ (bottom right panel).

Participant C1 had a significant difference between the fricatives in the context of /i/, despite the fact that two out of three /ʃ/ tokens were perceptually neutralised with /s/ realisations. In Figure 6 (bottom row), the articulatory data for C1 in the high vowel context are presented separately for the two consonants (/s/ in the left panel, and /ʃ/ in the right panel), broken down by repetition. The data points for the two tokens of /ʃ/ that were perceived as [s] are marked by two shades of grey in the bottom right panel. Interestingly, the data for these two repetitions stand out from the data for the /s/ tokens, particularly on LOCa-i. The repetition of /ʃ/ perceived as [ʃ] (black data points in the bottom right panel) has generally closer values to those of /s/ targets, with LOCa-i showing a gradual increase throughout the fricative.
Acoustic results
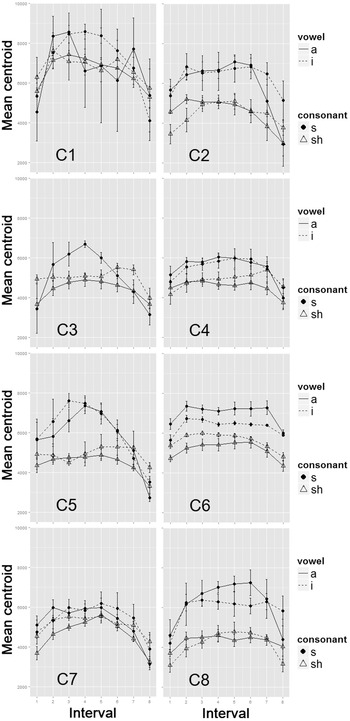
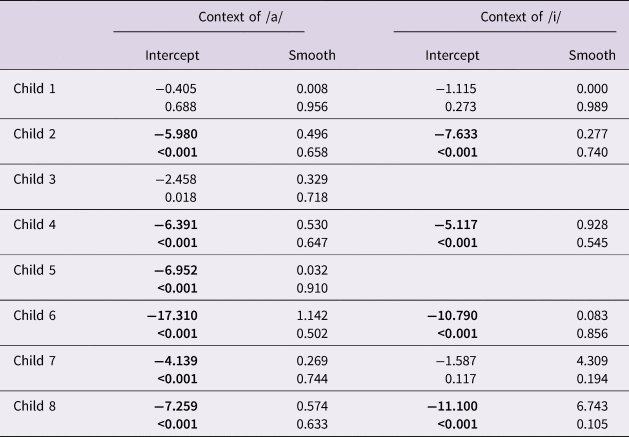
Figure 7 presents the fricative centroid values for individual speakers, separately for each consonant in the two vowel contexts. Some of the speakers show more visually noticeable cross-consonant differences than other speakers. Where cross-consonant differences can be discerned in the figure, they are generally in the direction previously reported for adults and children, with larger centroid values for /s/ than for /ʃ/ (participant C2 is a clear example of such a pattern). Table 4 shows statistical results from GAMMs on the fricative centroid. Six speakers differentiated between the fricatives on the intercept in the context of /a/, and four speakers had a significant difference on the intercept in the context of /i/. There were no significant cross-consonant differences in the dynamics of the centroid during the fricative, as shown by the smooth term results.
Mean centroid values during the fricative for individual speakers, by consonant and vowel context (error bars represent standard errors).

The results of GAMMs on the fricative centroid in each of the vowel contexts for individual speakers, across consonants. Significant results are in bold font. For each result, the coefficient value is above the p value. Negative coefficient values for the intercept mean that average centroid values were larger for /s/ than for /ʃ/.

Four speakers had significant cross-consonant differences in both vowel contexts: C2, C4, C6 and C8. Two of those speakers – namely, C6 and C8 – also had consistent differences in tongue shape across the two consonants in the direction reported for older children and adults, as shown in Tables 2 and 3. For speakers C2 and C4, significant differences on the centroid were matched by the articulatory measures in the context of /a/, but not in the context of /i/. Speakers C1, C3 and C7 had some non-significant acoustic results where significant differences were observed on the articulatory measures. In particular, there were no significant acoustic differences for C3 in the context of /a/, for C7 in the context of /i/, and for C1 in either vowel context, while the corresponding articulatory differences were significant, and they were in the direction reported for most other children.
Discussion
This study reported tongue shape and acoustic characteristics of voiceless sibilant fricatives produced by ten children speaking Scottish Standard English. The results show that children who produced an audible contrast between the target fricatives generally had an articulatory and acoustic contrast in the adult direction. In particular, the postalveolar consonant was characterised by more bunching of the front of the tongue than the alveolar consonant, corresponding to lower values of the fricative centroid. These findings are in agreement with previous acoustic studies (e.g., Nittrouer et al., Reference Nittrouer, Studdert-Kennedy and McGowan1989; Nittrouer, Reference Nittrouer1995; Reidy, Reference Reidy2015; Holliday et al., Reference Holliday, Reidy, Beckman and Edwards2015), as well as articulatory studies focussed on older children and adults (e.g., Zharkova, Reference Zharkova2016; Zharkova et al., Reference Zharkova, Hardcastle and Gibbon2018). The participants in this study had a more pronounced difference between the two fricatives before /a/ than before /i/, with fewer speakers reported to have significant cross-consonant differences in the high vowel context, on both articulatory and acoustic measures. The reduced scope for the realisation of the consonant contrast in the context of /i/ is largely due to the effect of the high vowel on the tongue position of the preceding consonant, particularly of /s/ (cf. Recasens & Espinosa, Reference Recasens and Espinosa2009; Zharkova, Reference Zharkova2016). A smaller vowel-related difference between /s/ and /ʃ/ in the context of /i/ than in the context of /a/ has been reported for English speaking children aged between seven and thirteen years old, as well as for adults, by Zharkova et al. (Reference Zharkova, Hardcastle and Gibbon2018).
No consistent cross-consonant differences were reported in the trajectory of either articulatory or acoustic measures during the course of the fricative, since most of the speakers had no significant effects on the smooth term in cross-consonant comparisons. The acoustic results agree with findings based on psychoacoustic frequency measurements reported by Reidy (Reference Reidy2015), where three-year-old English speaking children did not have a significant difference in the frequency dynamics between /s/ and /ʃ/. Reidy (Reference Reidy2015) observed significant differences in the consonant dynamics in four- and five-year-olds, and similar cross-consonant acoustic differences were reported by Zharkova et al. (Reference Zharkova, Hardcastle and Gibbon2018) for adults and children aged seven years and older, with a larger curvature for the centroid during /s/ than during /ʃ/. All age groups in the latter study also had different dynamic patterns of tongue shape change during the consonant for /s/ and /ʃ/. In the present study, the lack of cross-consonant differences in the dynamics of the articulatory indices suggests that three-year-old children may not yet be able to quickly change the tongue shape for the target fricative consonants in order to accommodate the fine adjustments imposed by neighbouring segments. These articulatory results are in agreement with previously reported findings on the lack of dynamic differentiation in tongue shape during /t/ from /ti/ in this cohort of three-year-old children (Zharkova, Reference Zharkova2018).
Articulatory and acoustic findings provided some converging information, such as cross-consonant differences in the direction previously reported for adults and older children, while also showing some complementary information. In particular, significant differences in tongue shape did not always correspond to significant differences in the fricative centroid, and vice versa. There was noticeable variability across children in how the articulatory and acoustic parameters were used in the realisation of the consonant opposition. For example, in articulatory analyses, all children differentiated between the two fricatives in the context of /a/ (on the intercept term), but only six out of eight children had a corresponding level of differentiation for the fricative centroid. In the context of /i/, out of six speakers whose productions were analysed using both articulatory and acoustic measures, two children had a significant cross-consonant difference on the articulatory indices but not on the centroid, and one child had a significant difference on the centroid but not on the tongue shape measures. For two of the children who had instances of perceptually neutralised /s/ and /ʃ/, instrumental evidence of the presence of a contrast in production was provided by articulatory indices. Participant C1, who perceptually neutralised the fricative opposition in the high vowel context some of the time, was shown to have a measurable contrast between /s/ and /ʃ/ on the tongue shape indices. For participant C10, who produced both target consonants as glottal fricatives in both vowel contexts, a significant difference between the two consonants also emerged on articulatory indices, when measured in the open vowel context. Thus, the results of this study suggest that the method of analysis, as well as the phonetic context, may affect the conclusion on whether a given child has acquired the phonemic contrast under investigation. In the present study, both C1 and C10 would be considered to have not acquired the /s/-/ʃ/ opposition on the basis of only auditory and acoustic analyses. However, if articulatory data are taken into account, both these children display evidence of being more advanced in the process of acquisition than judged from auditory and acoustic data alone. Ultrasound data on tongue shape for this and other lingual contrasts are also likely to be helpful in taking clinical decisions about disordered speech, since contrasts in production have previously been shown to lead to quicker progress in therapy (Tyler, Figurski & Langsdale, Reference Tyler, Figurski and Langsdale1993).
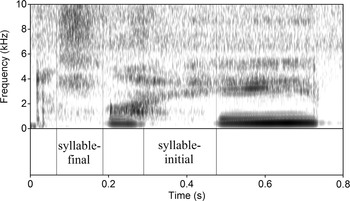
Participant C10 deserves some additional discussion, because of further interesting aspects of this child's productions. Although not a focus of this study, the exploratory findings outlined below shed further light on this participant's phonological acquisition. This participant, while consistently producing a glottal fricative at the onset of the target syllables, had some accurate realisations of the alveolar fricative in “It's” at the beginning of the carrier phrase. The syllable-final alveolar fricative target was variably perceived as dental, alveolar, or alveolar lateral fricative, and occasionally as a glottal fricative. Figure 8 shows a spectrogram of a production of the syllable-initial /s/ from /si/, which is preceded by a realisation of /s/ from “It's” that was perceived as a somewhat distorted alveolar sibilant fricative. The spectrogram illustrates the difference in the frequency patterns, with the syllable-initial consonant showing a formant transition from the preceding to the following vowel, typical of a glottal fricative, and the syllable-final /s/ characterised by a high frequency noise suggesting that an oral constriction is the cause of frication. This phonological distribution – namely, a consistent realisation of target sibilants as glottal fricatives at the onset of the target syllables, accompanied by inconsistent realisations at the offset of “It's” – suggests that the child was able to make a tongue-to-palate constriction leading to the perception of a coronal fricative, but that he chose to not make it syllable initially. This could be explained by referring to the different gestural timing requirements for consonant-vowel combinations when the consonant is syllable-initial versus syllable-final, with tighter coordination between articulators required in the former case (cf. McAllister Byun, Inkelas & Rose, Reference McAllister Byun, Inkelas and Rose2016b). The positional neutralisation of the sibilant fricative contrast, along with the presence of a covert contrast in the context of /a/ and variability in tongue shape for /s/ productions in the syllable onset (cf. Figure 6), suggests that at the moment recorded in this study the child was in the process of acquiring the fricative opposition, still strongly affected by the developmental constraints on lingual motor control.
A spectrogram showing speaker C10's production of “It's a sea” from “It's a sea, Pam” (including the closure onset for /p/). The target fricative from “sea” is labelled “syllable-initial”, while the interval including the high-frequency noise during /s/ from “It's” is labelled “syllable-final”.

A number of previous acoustic studies has demonstrated that children of the age ranges compatible with that reported in the present study contrast the two members of the sibilant fricative opposition in English to a smaller extent than adults (e.g., Nittrouer et al., Reference Nittrouer, Studdert-Kennedy and McGowan1989; Nittrouer, Reference Nittrouer1995; Nissen & Fox, Reference Nissen and Fox2005; Holliday et al., Reference Holliday, Reidy, Beckman and Edwards2015). Similar findings, i.e., less differentiation in children than in adults, have also been reported for older English-speaking children, using acoustic measurements (e.g., Romeo et al., Reference Romeo, Hazan and Pettinato2013; Maas & Mailend, Reference Maas and Mailend2017) and ultrasound tongue movement measurements (e.g., Zharkova et al., Reference Zharkova, Hardcastle and Gibbon2018). The present study was largely focussed on speaker-by-speaker analyses, since there was much variability across participants. Despite this large across-speaker variability, a number of children did produce perceptually correct fricatives in one or more vowel contexts, and it is interesting to attempt to compare the extent of discriminability of the two target consonants with previously published results on older children and adults. Discriminability of the two fricatives was measured by Zharkova et al. (Reference Zharkova, Hardcastle and Gibbon2018) for several age groups of children, between the ages of seven and thirteen years old, and adults, using ultrasound and acoustic data. Specifically, on LOCa-i and the fricative centroid, discriminability was measured within speaker by dividing the difference between mean index values for /s/ and /ʃ/ by the square root of the mean of the variances for the two consonants. Zharkova et al. (Reference Zharkova, Hardcastle and Gibbon2018) used the same carrier phrase and target syllables as those in the current study, so some comparison can be undertaken, although inferential analyses would not be applicable, since too few children from this study produced sufficient numbers of repetitions. However, if we select only six children who consistently produced both target consonants correctly, and calculate discriminability using that method, the mean values at every measurement time throughout the consonant are smaller for the three-year-old group than for each of the older age groups, on both LOCa-i and the fricative centroid. This observation is in line with previous findings, and it also agrees with results reported from other languages on the development of sibilant fricatives (e.g., German: Kleber, Reference Kleber2015; Japanese: Li et al., Reference Li, Edwards and Beckman2009; Mandarin Chinese: Li & Munson, Reference Li and Munson2016).
Previous studies have noted that the smaller extent of differentiation between the two fricatives in English may be due to a noticeable reduction in the centroid values for /ʃ/ with increasing age. The centroid has been reported to reduce for /ʃ/ between three years old and later childhood (e.g., Nittrouer, Reference Nittrouer1995; Holliday et al., Reference Holliday, Reidy, Beckman and Edwards2015; see also Nissen & Fox, Reference Nissen and Fox2005). Relatively large centroid values for /ʃ/ in young children have previously been explained by a possible lack of sublingual space for this consonant (Nittrouer, Reference Nittrouer1995). Since eight participants in the present study consistently produced the postalveolar fricative target correctly (every child except C1 and C10), the amount of data was sufficient for a comparison to the data reported in Zharkova et al. (Reference Zharkova, Hardcastle and Gibbon2018) for older child age groups and adults. For each vowel context, mean group centroid values for /ʃ/ at every time interval for the participants in this study were higher than mean group values for the same interval in each of the older age groups: namely, seven-, nine-, eleven-, thirteen-year-old children, and adults. It was also possible to carry out inferential analyses comparing the three-year-old group of eight participants with older age groups analysed in Zharkova et al. (Reference Zharkova, Hardcastle and Gibbon2018). GAMMs comparing the youngest children's group with each of the older age groups on the fricative centroid were run separately in each vowel context (including a Bonferroni adjustment for ten tests, i.e., five group pairs and two vowel contexts). The intercept term representing a difference between mean values of the centroid was significantly greater in the youngest group than in each of the other age groups, and the smooth term was also significant in most comparisons, reflecting a generally larger curvature for the centroid trajectory during the fricative for the three-year-olds than for older speakers. When GAMMs were run in a similar fashion on LOCa-i, generally no significant differences emerged between the three-year-olds and any of the older groups. Any conclusions from these analyses can be made with caution, since there were substantially fewer data points for the youngest group than for any other age group. However, the observed pattern fits in with the findings reported in previous studies. In particular, our observations are compatible with the suggestion by Nittrouer (Reference Nittrouer1995) about the lack of sublingual space for /ʃ/ in young children. A relatively high mean centroid for the target postalveolar fricative would likely arise if the front cavity was comparatively small, which could occur if there was no sublingual space during the consonant production. In the absence of consistent differences in the shape of the tongue with the older groups, any reduction in the sublingual space leading to this acoustic age-related difference may have been due to the position of the tongue relative to the jaw and the palate. A further indication that the three-year-olds may have had immature tongue-to-jaw coordination, compared with older speakers, is the dynamic age-related difference for /ʃ/, with a relatively greater frequency change between the centre and the periphery of the consonant for the three-year-olds. Given that jaw movements bring about large centroid changes into and out of the fricative constriction (cf. Zharkova et al., Reference Zharkova, Hardcastle and Gibbon2018), it could be that for achieving the constriction for /ʃ/ the participants in this study relied on the jaw more than is typical of older speakers. This strategy would be consistent with the fact that children learn to control jaw movements earlier than tongue movements (see, e.g., Green, Moore, Higashikawa & Steeve, Reference Green, Moore, Higashikawa and Steeve2000; Zharkova, Hewlett, Hardcastle & Lickley, Reference Zharkova, Hewlett, Hardcastle and Lickley2014).
In typical child development in English, (inter)dental realisations of /s/ are common (e.g., Smit, Reference Smit1993), and it was not surprising that they were observed for three children in the current study. The focus of the investigation was on comparing target postalveolar and alveolar consonants, so the study did not aim to differentiate between dental and alveolar productions of the target alveolar fricative. However, some observations can be made regarding those productions. In previous acoustic studies, the most prominent frequency concentration has been reported to be higher for [s] than for [θ], for example, by Nissen and Fox (Reference Nissen and Fox2005) for English speaking adults and three-to-five-year-old children, by Munson et al. (Reference Munson, Edwards, Schellinger, Beckman and Meyer2010) for English speaking two-to-five-year-old children, and by Gordon, Barthmaier, and Sands (Reference Gordon, Barthmaier and Sands2002) for adult speakers of Toda. Dental non-sibilant realisations of /s/ could be expected to be closer to /ʃ/ on the fricative centroid than [s] realisations. This was indeed the case for C1's productions of the fricatives in the context of /a/, where the token of /s/ perceived as [θ] had a noticeably lower mean centroid value than the other two tokens of /s/, which were both perceived as [s]. When the same three tokens produced by C1 were compared to each other on the tongue shape indices, there was no noticeable difference across the tokens. In general, in this study video camera data provided clearer information on individual differences in the extent of dentalisation of /s/ than articulatory indices. Recording ultrasound images of the tongue in the coronal plane would be helpful in future studies of sibilant fricatives, since it would make it possible to capture the extent of midline grooving that is likely to differentiate between alveolar and dental productions.
The results of this study, in combination with previously reported findings from instrumental studies of the sibilant fricative contrast in children, highlight the continuity in how physiological constraints affect early and later development of speech. Phonetic properties of sibilant fricatives are among the challenges that children are presented with by their ambient language at an early stage of phonological development (cf. “challenges” versus “opportunities” described by Vihman, Reference Vihman, Fougeron, Kühnert, D'Imperio and Vallée2010; see also Vihman, Reference Vihman2014). The development of the ability to differentially control and coordinate articulators also plays a part in constraining performance (cf. Gibbon, Reference Gibbon1999; Zharkova, Reference Zharkova2018). In response to these challenges, young typically developing children choose articulatory strategies that are available to them, leading to a less pronounced contrast in articulation and acoustics, and possibly resulting in perceived phonetic distortions or phonemic errors. The challenges continue to apply in older children's speech, well after the phonemic system has been acquired, throughout the protracted process of physical growth and maturation of speech motor control (cf. Smith, Reference Smith, Hardcastle, Laver and Gibbon2013). As a result, even when the fricatives are consistently produced correctly, school-aged children may still have a smaller contrast between the alveolar and postalveolar consonants than adults. The description of how lingual constraints affect the realisation of phonological oppositions by children of different ages has a clear relevance for theoretical explanations and clinical decisions. A possible application of this type of research to further developing the phonological theory would involve quantifications that would feed into constraint-based models, such as the A-map model (McAllister Byun et al., Reference McAllister Byun, Inkelas and Rose2016b), which posits that the same constraints apply in child and adult speech, albeit with different weightings. The relevance to speech and language therapy was briefly mentioned above when discussing covert contrasts in the clinical context. Since the fine tuning of the sibilant fricative contrast production continues throughout childhood, the phonetic parameters that correspond to the typical range of variability change with age, and these changes are relevant for assessing disordered productions. In particular, describing articulatory characteristics of correct productions and typical developmental errors during the fourth year of life would be helpful in developing more specific clinical criteria on whether fricative errors in the speech of children of that age are likely to become persistent or self-resolve without intervention.
Acknowledgements
The author gratefully acknowledges the help of Marko Liker with carrying out the reliability check, and the long-standing collaboration with Bill Hardcastle and Fiona Gibbon. Thanks are due to Melanie Soderstrom and two anonymous reviewers for helpful comments. The author is grateful to Galina Zharkova and Diane Anderson for their advice and help throughout this work. The paper is dedicated to the memory of Inger Moen, considered by the author as one of her first teachers. This work was supported by a grant from the Economic and Social Research Council to the author (ES/K002597/1).