Introduction
Research in materials science and engineering has become more and more interdisciplinary and continues to evolve and broaden in the 21st century. A few burgeoning areas, such as two-dimensional (2D) materials and hybrid systems,Reference Bonaccorso, Colombo, Yu, Stoller, Tozzini, Ferrari, Ruoff and Pellegrini1,Reference Bhimanapati, Lin, Meunier, Jung, Cha, Das, Xiao, Son, Strano, Cooper, Liang, Louie, Ringe, Zhou, Kim, Naik, Sumpter, Terrones, Xia, Wang, Zhu, Akinwande, Alem, Schuller, Schaak, Terrones and Robinson2 halide perovskites,Reference Manser, Christians and Kamat3 and metamaterials and metasurfaces,Reference Minovich, Miroshnichenko, Bykov, Murzina, Neshev and Kivshar4 have received much attention in recent years, especially for their technological applications. To elucidate carrier dynamics in optoelectronic materials and devices for further control, it is necessary to use time-resolved techniques with appropriate temporal resolutions. This has been seen in the last four decades with femtosecond all-optical spectroscopy methods becoming mature and broadly adopted in studies of a wide variety of materials as well as numerous physical, chemical, and biological systems.Reference Zewail5–Reference Cowan, Banerji, Leong and Heeger9 However, limitations in spatial resolution remain because of the fundamental diffraction limit of light and acquisition of averaged results due to ensemble probing, which is the acquisition of signals from a larger region of a sample. To mitigate the latter constraint of sample averaging, optical pump-probe microscopy has been developed to provide diffraction-limited or subdiffraction solutions.Reference Grumstrup, Gabriel, Cating, Van Goethem and Papanikolas10–Reference Guo, Wan, Yang, Snaider, Zhu and Huang12
The increasing need to directly image materials dynamics at the atomic level with simultaneous high spatial and temporal resolutions led to the invention of four-dimensional ultrafast electron microscopy (4D-UEM) in 2005,Reference Lobastov, Srinivasan and Zewail13 pioneered by Zewail and co-workers at the California Institute of Technology (Caltech) following the development of ultrafast electron diffraction and crystallography.Reference Zewail14,Reference Zewail15 This novel methodology was initially instrumented using a modified transmission electron microscope (TEM) that allows the entry of two laser beams for photoexcitation of specimens (pump) and generation of ultrashort photoelectron pulses (probe) from a flat LaB6 electron emitter in a pump-probe stroboscopic scheme.Reference Lobastov, Srinivasan and Zewail13 The fourth dimension of ultrashort time added to the versatile three-dimensional (3D) space- and energy-resolved electron microscopy techniques opens up new possibilities to visualize light‒matter interactions, including photon-induced near-field electron microscopy.Reference Barwick, Flannigan and Zewail16,Reference Flannigan and Zewail17 The Introductory,Reference Flannigan and Lindenberg18 Feist et al.,Reference Feist, Storeck, Schäfer and Ropers19 and Pomarico et al.Reference Pomarico, Kim, García de Abajo, Kwon, Carbone and van der Veen20 articles in this issue provide further details for the up-to-date development of this version of UEM.
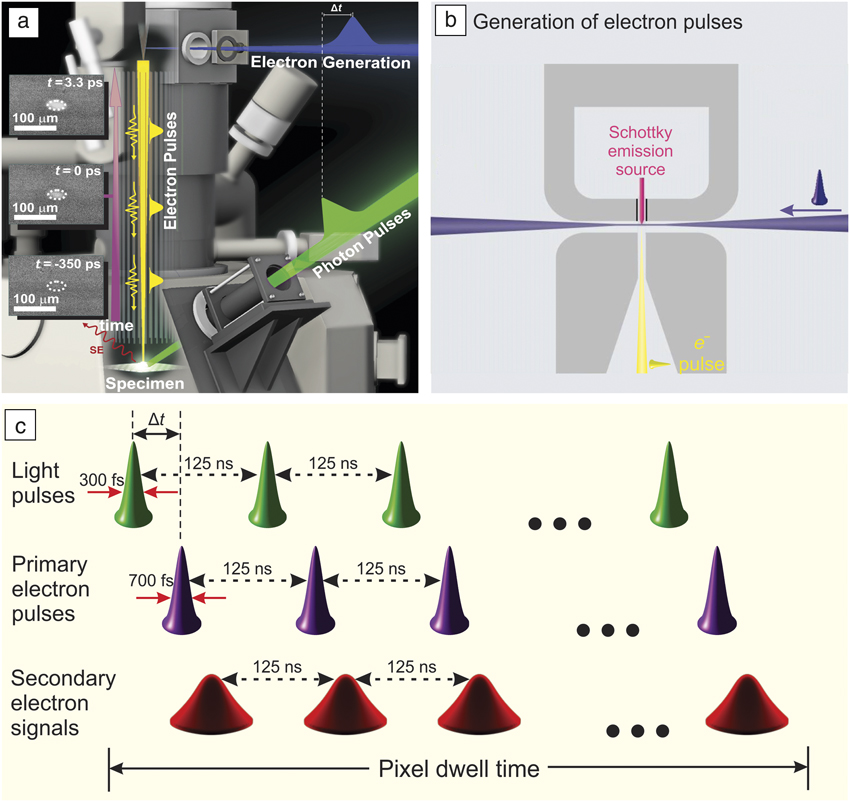
In 2009, D.-S. Yang proposed a scanning electron microscope (SEM) for ultrafast imaging. Instrumentation for the first-generation apparatus was begun in December 2009 by Yang and O.F. Mohammed under Zewail’s supervision at Caltech;Reference Yang, Mohammed and Zewail21,Reference Mohammed, Yang, Pal and Zewail22 the second-generation apparatus was built at King Abdullah University of Science and Technology by Mohammed (Figure 1).Reference Sun, Melnikov, Khan and Mohammed23 The aim of this emerging method of scanning ultrafast electron microscopy (S-UEM) was to achieve real-space imaging of photo-induced dynamical processes of materials surfaces and interfaces with nanometer spatial and sub-picosecond temporal resolutions. This is different in concept and instrumentation from earlier gated setups with electron optics for beam blanking and bunchingReference Hosokawa, Fujioka and Ura24 and from picosecond (ps) cathodoluminescence with pulsed photoelectrons for excitation and the detection of resulting photons.Reference Merano, Sonderegger, Crottini, Collin, Renucci, Pelucchi, Malko, Baier, Kapon, Deveaud and Ganière25
Schematic of scanning ultrafast electron microscopy (S-UEM). (a) S-UEM instrumentation using a modified scanning electron microscope with two laser beams, one for photoelectron generation (blue) and the other for photoexcitation or clocking (green). The inset micrographs give an example of the different images acquired at selected delay times between the laser and the photoelectron pulses.Reference Sun, Melnikov, Khan and Mohammed23 (b) Schematic of the electron source region using side illumination of a cooled sharp Schottky emitter.Reference Yang, Mohammed and Zewail21 (c) Pump-probe scheme at 8 MHz (i.e., successive events separated by 125 ns) within a given dwell time at each pixel. The arrival times of the pump and probe pulses at the specimen differ by a delay time, Δt.Reference Shaheen, Sun, Yang and Mohammed26 Note: t, time; SE, secondary electron.

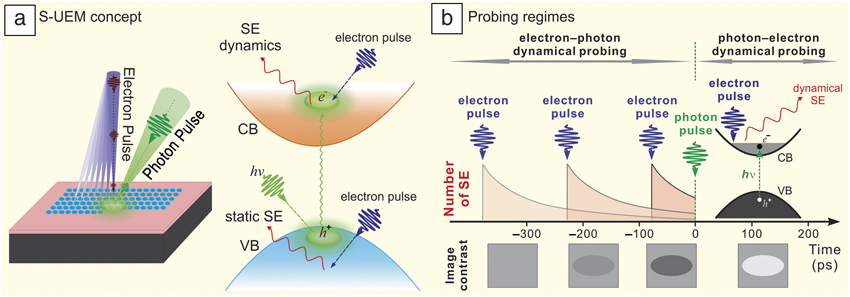
S-UEM has advantages of simple sample preparation, potential for studies of near-real-world devices, and the usage of thicker samples for better energy dissipation and reduction of radiation damage.Reference Yang, Mohammed and Zewail21,Reference Shaheen, Sun, Yang and Mohammed26 Beyond these, there are three unique features of S-UEM compared to 4D-UEM in the transmission mode. First, S-UEM has high surface sensitivity given the energy of secondary electrons emitted from surface regions;Reference Yang, Mohammed and Zewail21,Reference Mohammed, Yang, Pal and Zewail22 with environmental imaging, it is also possible to image photo-induced solid‒gas interactions in an ambient gas up to the level of a few mbar.Reference Yang, Mohammed and Zewail27 Second, materials dynamics initiated by the impact of primary electrons (PEs) can now be studied in the new electron‒photon dynamical probing regime and cross-examined with photo-induced carrier dynamics (Figure 2).Reference Mohammed, Yang, Pal and Zewail22,Reference Shaheen, Sun, Yang and Mohammed26 Third, the S-UEM is the first to employ side illumination of a cooled sharp Schottky emitter to generate photoelectrons in an actual electron microscope (Figure 1a–b),Reference Yang, Mohammed and Zewail21 seeking new designs for high-brightness sources of pulsed electrons.Reference Feist, Bach, Rubiano da Silva, Danz, Möller, Priebe, Domröse, Gatzmann, Rost, Schauss, Strauch, Bormann, Sivis, Schäfer and Ropers28 Considering the various analytical methods available for an SEM, more development opportunities still exist for the relatively new methodology of S-UEM. In what follows, we describe the imaging mechanisms and applications for current S-UEM development and conclude with an outlook for the future.
Imaging mechanisms of scanning ultrafast electron microscopy (S-UEM). (a) (Left) Schematic of raster imaging over both laser-illuminated and nonilluminated regions of a thin-film sample and (right) energy-gain mechanism producing bright contrast due to an enhanced secondary-electron yield from the excited electrons in the photoexcited region, using a direct-gap semiconductor as an example.Reference Shaheen, Sun, Yang and Mohammed26 (b) (Top) Two dynamical probing regimes and (bottom) typical image contrasts in positive and negative times with the respective energy-gain and energy-loss mechanisms. The schematic micrographs cover both photoexcited and unexcited regions, currently on the order of tens of micrometers. (Middle) For the new electron‒photon probing regime at negative times, the electron-impact dynamics (pink) initiated by an electron pulse (blue) may be clocked by the arrival of a photon pulse (green); the resulting contrast depends on how much the electron-impact dynamics is interrupted in the energy-loss mechanism as a result of carrier scattering in the laser-illuminated region.Reference Mohammed, Yang, Pal and Zewail22 Note: SE, secondary electron; VB, valence band; CB, conduction band; h, Planck’s constant; ν, frequency.

Imaging mechanisms
Dynamical imaging of S-UEM to date has been achieved by obtaining transient contrast changes resulting from ultrafast photoexcitation (the photon‒electron probing regime) or electron impact (the electron‒photon probing regime),Reference Mohammed, Yang, Pal and Zewail22,Reference Sun, Adhikari, Shaheen, Yang and Mohammed29 with intensity referencing to unilluminated or nonabsorbing (thus nondynamical) regions or with image processing algorithms for background removal.Reference Najafi, Liao, Scarborough and Zewail30 A positively biased Everhart‒Thornley detectorReference Everhart and Thornley31 is often used to acquire secondary electrons (SEs) emitted mostly from the first few nanometers of the sample surface region. For a given dwell time at each pixel, a fixed number of pump-probe events with the same adjustable delay time (Δt) take place at each pixel, depending on the laser repetition rate used (Figure 1c). A scan image at that delay time is then constructed through rastering the pulsed electron beam and averaging multiple frames (Figure 2a); a series of scan images are acquired by varying Δt through changing the optical path of the laser beam with respect to the electron-generating beam using a computer-controlled delay stage. It should be noted that the present tens-of-micrometers laser footprint can be further reduced to a near-diffraction-limited size or a subdiffraction level with new optical designs.
Bright and dark image contrasts referenced to a nondynamical region may correlate with time-dependent energies (hence scattering cross sections) and populations of nonequilibrium charge carriers in materials,Reference Mohammed, Yang, Pal and Zewail22,Reference Sun, Melnikov, Khan and Mohammed23,Reference Shaheen, Sun, Yang and Mohammed26,Reference Sun, Adhikari, Shaheen, Yang and Mohammed29 as well as potential structuralReference Yang, Mohammed and Zewail27 or morphologicalReference Najafi, Liao, Scarborough and Zewail30 changes caused by electronic excitation and relaxation. In a semiconductor, the presence of energetic electrons, promoted by photons or by the impact of PEs (1‒30 keV) to the conduction bands, may lead to a higher probability and yield of SE emission, causing bright contrast. Such processes can be regarded as energy-gain mechanisms (Figure 2a) and have been observed mostly in silicon- and cadmium-based semiconductors in the positive-time photon‒electron regimeReference Sun, Adhikari, Shaheen, Yang and Mohammed29 as well as in thin CdSe films in the negative-time electron‒photon regime.Reference Shaheen, Sun, Yang and Mohammed26 However, electrons carrying different energies in various bands may also exhibit sufficiently different scattering cross sections with primary and secondary electrons, which can result in a suppression, instead of an enhancement, of SEs escaping materials surfaces and hence a reduction in the SE yield. Consequently, a dark contrast is seen via such energy-loss scattering mechanisms in the presence of photocarriers, as observed in a number of materials, including GaAsReference Cho, Hwang and Zewail32 and InGaN nanowires.Reference Sun, Adhikari, Shaheen, Yang and Mohammed29 Furthermore, displacement of energetic electrons and holes may lead to the observation of bright and dark contrasts in adjacent regions, signifying charge separations in different directions and speeds.Reference Najafi, Scarborough, Tang and Zewail33,Reference Liao, Najafi, Li, Minnich and Zewail34 Therefore, by using S-UEM, the rich carrier dynamics of photoactive materials may be imaged and visualized in real space and time.
It is worth mentioning that the unique opportunity in S-UEM to study electron-impact dynamics in the electron−photon dynamical probing regime at “negative” times, where the PE pulse arrives at the specimen earlier than the optical pulse and nonnegligible dynamics may still be found (Figure 2b). The electron impact of pulsed high-energy PEs in the specimen causes a cascade of scattering events and generates nonequilibrium electron‒hole pairs with relatively high energies on average. Time-dependent signals in SE emission may then be observed through clocking by late-arriving photon pulses.Reference Shaheen, Sun, Yang and Mohammed26 Such dynamical information cannot be accessed by time-resolved all-optical spectroscopy or by 4D imaging in the transmission mode, which may be crucial and relevant to the interpretation of results from electron-beam-induced current (EBIC) analysis used as an analytical method to evaluate the performance of optoelectronic materials and devices, because of the high initial energies of EBIC carriers.Reference Shaheen, Sun, Yang and Mohammed26
Real-space and real-time imaging of carrier dynamics in solids and 2D materials
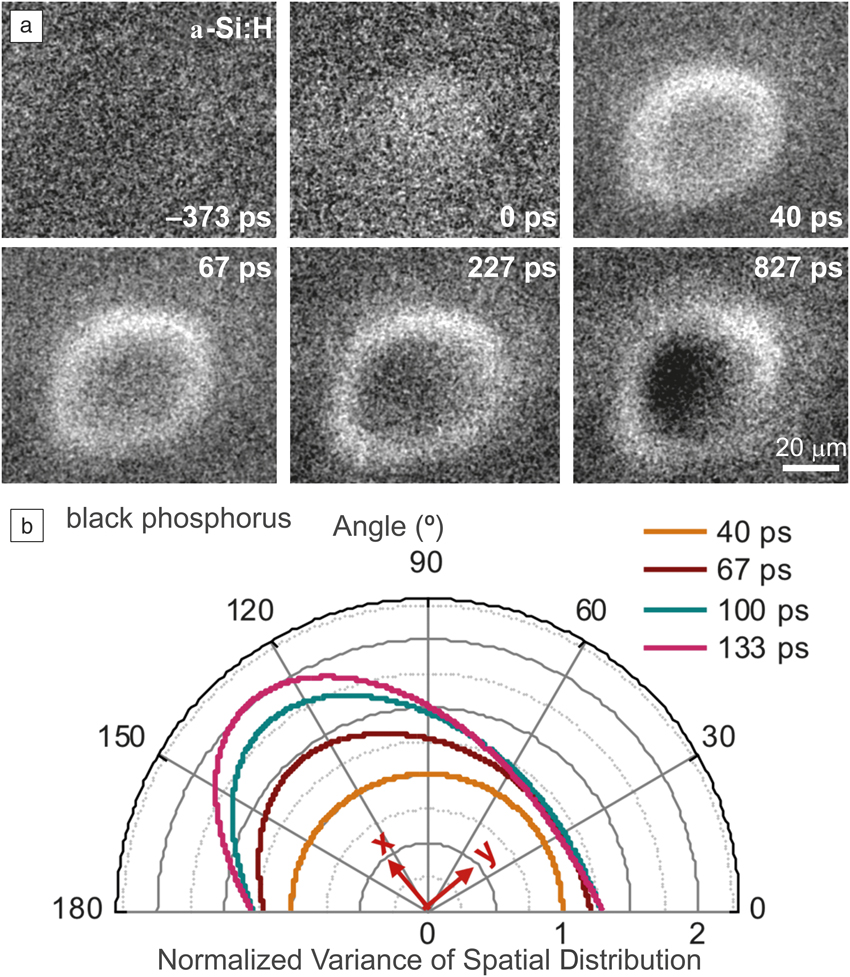
A recent S-UEM study on hydrogenated amorphous silicon (a-Si:H) showed surface imaging of photocarrier dynamics,Reference Liao, Najafi, Li, Minnich and Zewail34 which is technologically relevant to thin-film solar-cell applications and possesses drastically different carrier-transport properties from those of crystalline silicon. With the capability of high spatial and temporal resolutions of S-UEM, two intriguing phenomena were observed. First, qualitatively different from the ambipolar diffusion observed in crystalline silicon,Reference Najafi, Ivanov, Zewail and Bernardi35 energetic electrons and holes with different mobilities are spatially separated in a-Si:H after photoexcitation, as observed in the respective bright and dark contrasts as a result of a population displacement mechanism (Figure 3a), due to a large dielectric relaxation time caused by the low electrical conductivity.Reference Liao, Najafi, Li, Minnich and Zewail34 This “relaxation semiconductor” behavior was theoretically predicted in the 1970s,Reference Van Roosbroeck and Casey36 but could only be directly visualized for the first time via S-UEM. Second, it was observed that immediately after photoexcitation, hot electrons and holes with excess energy in a-Si:H diffuse away from the laser footprint center with significantly higher diffusivities than the near-equilibrium values, despite the strong structural disorder; a similar phenomenon of fast diffusion of hot carriers was also seen in crystalline silicon.Reference Najafi, Ivanov, Zewail and Bernardi35 Together with charge separations directly imaged across the interface of a p–n junction,Reference Najafi, Scarborough, Tang and Zewail33 these findings have provided new details of the spatial-temporal dynamics of hot electrons and holes in semiconductors immediately after they are photoexcited.
Photocarrier dynamics in hydrogenated amorphous silicon and black phosphorus imaged by scanning ultrafast electron microscopy. (a) Time-resolved secondary electron images of the surface of hydrogenated amorphous silicon. The bright and dark contrasts indicate electron- and hole-rich regions. A clear spatial separation of electrons and holes is observed at an 827-ps delay time.Reference Liao, Najafi, Li, Minnich and Zewail34 (b) Variance of the spatial distribution of photoexcited hot holes on the surface of black phosphorus projected onto different directions and normalized to the initial distribution at 40 ps. It is clearly seen that the hot-carrier diffusion occurs preferentially along the armchair direction, labeled as “x.”Reference Liao, Zhao, Najafi, Yan, Tian, Tice, Minnich, Wang and Zewail37

In addition, S-UEM has been applied to directly image the strongly anisotropic in-plane transport of hot carriers in black phosphorous, an emerging material for next-generation electronic and optoelectronic devices.Reference Liao, Zhao, Najafi, Yan, Tian, Tice, Minnich, Wang and Zewail37 Surprisingly, it was found that the anisotropy ratio of hole diffusivity along the “fast” (armchair) direction to that along the “slow” (zigzag) direction is about 15, much higher than the value (<3) observed under near-equilibrium conditions (Figure 3b). Such an observation demonstrates drastically different dynamics of hot carriers and near-equilibrium carriers, which is also consistent with the observed dynamics of energetic carriers generated by electron impact in the electron‒photon probing regime.Reference Shaheen, Sun, Yang and Mohammed26 In addition, high-energy electrons from a deeper region may experience scattering by lower-energy carriers generated through photoexcitation, causing a dark image contrast via the energy-loss mechanism. Thus, by using different parameters of external stimuli, carrier dynamics as a function of space, time, and excess energy may be tracked using S-UEM imaging.
Imaging of carrier dynamics of nanostructured materials
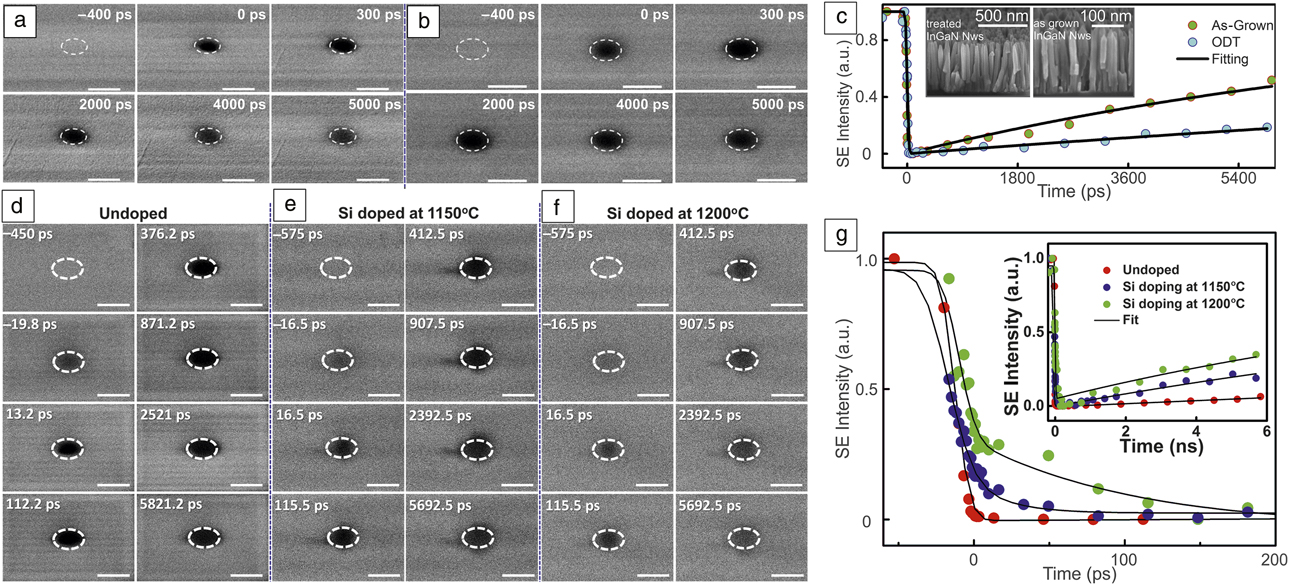
Visualization of charged-carrier dynamics in space and time has also been achieved on the surface of copper indium gallium selenide nanocrystal (CIGSe NC) and indium gallium nitride nanowire (InGaN NW) arrays before and after surface passivation and also after silicon doping.Reference Bose, Bera, Parida, Adhikari, Shaheen, Alarousu, Sun, Wu, Bakr and Mohammed38–Reference Bose, Adhikari, Burlakov, Liu, Haque, Priante, Hedhili, Wehbe, Zhao, Yang, Ng, Goriely, Bakr, Wu, Ooi and Mohammed41 Figure 4a–b shows time-resolved SE snapshots and intensity changes of InGaN NWs before and after passivation with an octadecylthiol (ODT) treatment, respectively, upon exposure to 515-nm photoexcitation. At a large negative delay time (‒400 ps), no change is seen in the image contrast, indicating full recovery of the InGaN NWs to the initial state before the next excitation pulse arrives at the specimen surface. A dark contrast observed in the laser-illuminated area both at negative tens of ps (electron-impact dynamics) and at positive times (photo-induced dynamics) signifies the energy-loss imaging mechanisms. Such observations imply that the effective scattering cross section of SEs with low-energy electrons in the conduction band is sufficiently higher than that of conduction electrons with PEs. At longer times, the intensity (negative change) of the recorded SE signal gradually recovers, which indicates surface charge-carrier recombination.
Time-resolved secondary-electron (SE) images showing contrast evolution in InGaN nanowires (NWs) at an excitation of 515 nm at selected times for (a) an as-grown sample and (b) an octadecylthiol (ODT)-passivated one. The dashed ellipse indicates the laser spot on the NWs, which was approximately 40 µm in size. Directly comparing both samples indicates that the as-grown NWs exhibit more rapid recovery. (c) Extracted kinetics of the time-resolved SE intensities of the InGaN NWs from the as-grown and ODT-treated samples during a time window of 6000 ps. The faster recovery of the as-grown sample is evident. The structures of the two samples are shown in the inset micrographs.Reference Khan, Adhikari, Sun, Priante, Bose, Shaheen, Ng, Zhao, Bakr, Ooi and Mohammed40 (d‒f) Time-resolved SE difference images at indicated delay times for undoped and Si-doped NWs at 515-nm excitation. The dashed ellipse indicates the laser footprint on the sample. The scale bar is 50 µm. (g) Temporal evolution of the SE intensity at the center of the laser footprint on the 200-ps time scale. The inset shows the dynamics on a 6-ns time window. The reverse trends of time constants (e.g., faster intensity drop and slower recovery for the red versus slower intensity drop and faster recovery for the green) suggest different roles of silicon dopants on the photocarrier dynamics in different temporal ranges.Reference Bose, Adhikari, Burlakov, Liu, Haque, Priante, Hedhili, Wehbe, Zhao, Yang, Ng, Goriely, Bakr, Wu, Ooi and Mohammed41

Interestingly, within a 5-ns time window under the same experimental conditions, the SE intensity change of the as-grown sample is significantly reduced compared to that of the ODT-passivated one (Figure 4c), which provides clear indication of a faster charged-carrier recombination for the as-grown sample. Thus, longer carrier lifetimes of InGaN NWs can be achieved by minimization of surface defects after the ODT treatment; this is also corroborated by the NW elemental mapping results of surface oxygen removal and formation of a carbon-rich amorphous layer.Reference Khan, Adhikari, Sun, Priante, Bose, Shaheen, Ng, Zhao, Bakr, Ooi and Mohammed40 Such performance improvement through surface passivation has also been examined in a recent study for CIGSe NCs with a large-gap zinc sulfide layer. Time-resolved SE images of specimen surfaces clearly demonstrate that the density of trap states is significantly reduced after ZnS capping The removal of trap states and increase in charge-carrier lifetimes were also experimentally confirmed by the increased photocurrent of self-biased photodetectors fabricated using the shelled NCs.Reference Bose, Bera, Parida, Adhikari, Shaheen, Alarousu, Sun, Wu, Bakr and Mohammed38
Figure 4d‒f shows S-UEM images acquired on the surface of InGaN NWs with and without silicon dopants of varying concentration processed at different temperatures.Reference Bose, Adhikari, Burlakov, Liu, Haque, Priante, Hedhili, Wehbe, Zhao, Yang, Ng, Goriely, Bakr, Wu, Ooi and Mohammed41 A difference in the time-dependent dark contrast in the laser-illuminated region is evident. Within a time window of 6 ns, a greater silicon dopant concentration is shown to cause a faster recovery of the dark image contrast, which is indicative of a higher rate of charged-carrier recombination (Figure 4g, inset). However, the SE kinetics at hundreds of picoseconds exhibit a surprising opposite trend to that observed on the longer time scale, hinting at the possibility of a different mechanism operative within this time window (Figure 4g). The increase of silicon dopants appears to add trap states that effectively induce a lag for the early-time escape of the emitted SEs, thus resulting in deferred growth of the dark contrast in the case of Si-doped NW samples. Hence, the increase in silicon dopant concentration in InGaN NW arrays manifests itself in the trapping dynamics at early times for SEs and at longer times for photocarriers.
Concluding remarks and outlook
The selective study of ultrafast carrier dynamics of materials, surfaces, and interfaces with high spatial and temporal control is one of the major challenges impeding the optimization of photoactive materials-based devices. Four-dimensional S-UEM provides a versatile tool to tackle the problem. With this methodology, one can now have access to dynamical phenomena at surfaces with adequate spatiotemporal resolution, including surface diffusion, charge separation, transport, recombination, and anisotropic motions, a territory that has been beyond reach by static electron imaging or conventional time-resolved laser spectroscopy until now. A few studies such as hydrogenated amorphous silicon, black phosphorus, indium gallium nitride nanowires, and copper indium gallium selenide nanocrystals were presented in this article.
The state of the art of 4D S-UEM can be further advanced by new optical designs to reach a diffraction-limited or subdiffraction laser footprint, the use of nanostructured specimens and devices with patterns of photoactive and inactive materials for nanoscopy-level imaging, implementation of a high-brightness source using a cold nano-sized emitter in the field-emission regime, integration of a lock-in amplification mechanism for high-sensitivity detection,Reference Zani, Sala, Irde, Pietralunga, Manzoni, Cerullo, Lanzani and Tagliaferri42 and incorporation of various imaging modes in conventional scanning electron microscopy with electrons, photons, or induced currents. We anticipate 4D S-UEM to become more broadly adopted in the near future for direct visualization of carrier and surface dynamics in space and time, taking advantage of the versatile use of scanning electron microscopy in various fields of scientific and technological research.
Acknowledgments
D.-S.Y. acknowledges support from a National Science Foundation CAREER Award (Grant No. CHE-1653903) and from the R.A. Welch Foundation (Grant No. E-1860). B.L. is supported by a startup fund from the University of California, Santa Barbara. O.F.M acknowledges funding support from King Abdullah University of Science and Technology.

Ding-Shyue (Jerry) Yang is an assistant professor of chemistry at the University of Houston. He received his BS and MS degrees from National Taiwan University, and his PhD degree from the California Institute of Technology (Caltech) in 2009. He designed and built the first scanning ultrafast electron microscope at Caltech. His research focuses on interfacial energy- and charge-transfer dynamics in heterogeneous solid‒molecule systems and ultrafast dynamics and transformation pathways of energy-related materials. Yang can be reached by email at yang@uh.edu.

Bolin Liao is an assistant professor of mechanical engineering at the University of California, Santa Barbara. He obtained his PhD degree in mechanical engineering from the Massachusetts Institute of Technology in 2016, and was a Kavli postdoctoral fellow at the California Institute of Technology. His current research focuses on nanoscale energy-transport processes and their applications to develop more efficient and cost-effective clean-energy technologies. Liao can be reached by email at bliao@ucsb.edu.

Omar F. Mohammed is an assistant professor in the Division of Physical Sciences and Engineering at King Abdullah University of Science and Technology (KAUST), Saudi Arabia. He developed and built the first- and second-generation scanning ultrafast electron microscope at the California Institute of Technology and KAUST, respectively. His research focuses on the development of highly efficient solar cells with the aid of cutting-edge laser spectroscopy and electron microscopy. Mohammed can be reached by email at omar.abdelsaboor@kaust.edu.sa.