In March 2009, at a time when President Obama was basking in the glow of the honeymoon with the public every new president enjoys, I asked, “Will Barack Obama be a one-term president?”Footnote 1 What prompted me to pose so impertinent a question at so hopeful a time was that the Office of Management and Budget was projecting that that year the federal government would spend 28% of gross domestic product (GDP). This amounted to a 7% point increase compared to the previous year, the largest peacetime one-year jump since 1930.Footnote 2 The most recent estimate for 2012 is that federal outlays will take up 24.3% of GDP, up 3.5% points since 2008. This is the second-largest peacetime increase from one election year to the next since 1880, edged out only by Franklin D. Roosevelt's first-term surge of 3.6% points.Footnote 3
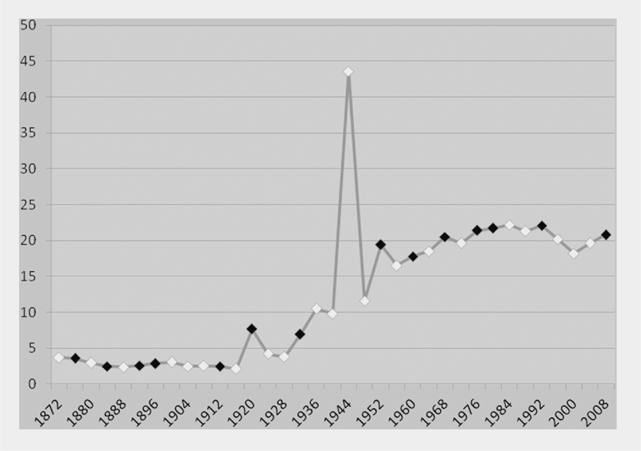
To appreciate the implications of this spike in federal spending for President Obama's prospects for reelection, examine figure 1. It tracks F, the percent of GDP spent by the federal government from one presidential election year to the next.Footnote 4 Years in which the incumbents won a majority of the two-party vote (VOTE2) are indicated by white dots, all others by black dots. Observe the slope of the F-line connecting the dots. Note that only five times have incumbents succeeded in hanging on to the White House at the end of a term in which spending relative to GDP did not decline or at least moderate its rate of growth compared to the previous term. Those exceptions fell in 1908, at the end of Teddy Roosevelt's second term; in 1936 and 1944, two of Franklin Roosevelt's reelections; in 1984, when Ronald Reagan won a second term; and in 2004, when George W. Bush, too, was reelected. Note that three of these exceptions involved charismatic presidents who had survived assassination attempts, both Roosevelts and Reagan, and one of those also had to do with World War II, the last popular war. Also, Reagan's fiscal expansion was accompanied by vigorous economic growth. None of these conditions applied to George W. Bush, and it showed: in 2004, he retained the White House by the smallest margin in the major party vote of any sitting president in more than a century. More to the point of the purpose of this article, none of those conditions is present in 2012, either.Footnote 5
F and VOTE2, 1872–2008

The bivariate relation between federal spending (again, as a percent of GDP) and presidential reelection shown in figure 1 may well be spurious, but the Fiscal Model offers reasons and evidence to doubt it. The intuition is that F represents the equivalent of a fee that the federal government charges the economy for its services. As with any commodity, the higher the federal fee, the smaller the quantity demanded. However, unlike consumers in a market, voters are not able to reduce their “purchases” from Washington when its fee goes up. Instead, assuming there has been no change in their evaluation of federal goods and services,Footnote 6 they do the next best thing. Switching metaphors, on Election Day they “fire” the incumbents. Viewed in this light, ceteris paribus, an election is equivalent to a retrospective-minded referendum on the president's fiscal policy.
A change in F yields F1, the first derivative of F with respect to time, in this case the four-year presidential term. F1 = Ft − Ft−1, where t = election year and t − 1 is the previous election year. In other words, F1 denotes the percent point change in spending from one presidential term to the next; for example, if F rises from 19% to 20%, F1 = 1. In turn, F1 yields a binary variable describing spending policy: FPRIME = 1 if F1 > 0 (policy is expansionary) and FPRIME = −1 if F1 < 0 (policy is contractionary). A related spending measure is FISCAL. FISCAL is calculated by combining F1 with its derivative, F2. If F1 > 0 and F2 ≥ 0, this means that in the current term F has increased at the same or faster rate than in the previous term. FISCAL = 1 (policy is expansive). In contrast, if F1 = 1 but F2 < 0, this shows that, although F has risen since the previous election, it has done so at a slower rate. In other words, it signals to the electorate that the growth in spending has decelerated.Footnote 7 Thus FISCAL = −1 (policy is cutback) if F1 < 0 or if F1 ≥ 0 and F2 < 0. FISCAL and FPRIME are fairly strongly correlated (Pearson's r = 0.79). Since 1872, only four times have these variables taken opposite signs.Footnote 8
FISCAL and FPRIME are strong predictors of election outcome (victory or defeat for the incumbents in the two-party vote for president), 1880–2008. If FPRIME = −1 (policy is contractionary), incumbents win more than 85% of the time; if FPRIME = 1 (an expansionary policy), they lose about three-fifths of the time. Seventy percent of the cases behave as expected. Using FISCAL as the spending measure yields similar results. The negative relation between FPRIME or FISCAL and VOTE2 persists in the presence of controls for PARTY, Democrat (1) or Republican (0), and three variables borrowed or adapted from Fair (Reference Fair2012): GROWTH, ALL NEWS, and DURATION. GROWTH is the annualized rate of real per capita GDP growth in the first three quarters of the election year. ALLNEWS is similar to Fair's GOODNEWS, the number of quarters through all but the last quarter of the presidential term in which GROWTH is greater than 3.2%, except that, unlike Fair's, its values in his “war” years (1920, 1944, 1948) are not zeroed out. Both measures of economic performance are expected to have a positive impact on the vote.Footnote 9 By contrast, DURATION, a weighted index of the number of consecutive terms the incumbents have occupied the White House (0, 1.0, 1.25, 1.50, and so on), should have a negative effect.
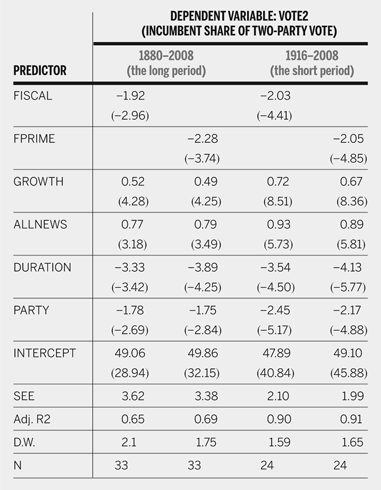
Table 1 displays the estimates of two pairs of regression models, one across the 24 elections held since 1916, the period Fair uses for forecasting VOTE2, and another across the 33 elections held since 1880. All variables behave as expected: both measures of economic growth have a positive effect on the vote, the longer the incumbent party occupies the White House, the smaller its vote share, and Democrats do less well than Republicans. Note that a policy switch from contractionary (or cutback) to expansionary (or expansive), that is, a shift in FPRIME (or FISCAL) from −1 to 1, on average costs the incumbents approximately 4% points in the two-party vote. (FPRIME and FISCAL are coded −1 or 1; therefore, to estimate their effect on VOTE2 one needs to multiply their coefficients by two.)
The Fiscal Model: Two Versions, Two Periods (t-statistics in parenthesis)

WILL BARACK OBAMA WIN REELECTION IN 2012?
Since 1880, only 6 out of 22 times (27%) has a sitting president lost his bid for reelection: Benjamin Harrison (1888), William Howard Taft (1912), Herbert Hoover (1932), Gerald Ford (1976), Jimmy Carter (1980), and George H. W. Bush (1992).Footnote 10 In fact, only twice has the popular vote gone against a president in the first term of a party reign (Harrison and Carter). If history reflects true odds, then, President Obama's prospects for winning another term in the White House are very good indeed. Examining the relationship more closely, however, we find that the advantage of incumbency is mediated by fiscal policy. Measuring it by FPRIME yields the following pattern: In the 22 times that a president has sought reelection, 10 times he pursued a contractionary policy and 12 times an expansionary policy. Ninety percent of the former cases (9 out of 10) resulted in reelection, but only 7 out of 12 (58%) of the latter did. Using FISCAL as our measure, 13 times a president pursued a cutback policy, and in all but two of those (85%) he won reelection, whereas only in the aforementioned five times (out of nine, or 55%) did an expansive policy yield a another term in the White House. Because he has pursued an expansionary/expansive fiscal policy, judging by the pace of federal spending alone President Obama's prospects are less rosy than those of the typical president seeking reelection: somewhere between 0.55 and 0.58.Footnote 11
As noted earlier, however, fiscal policy is by no means the only determinant of presidential election outcomes. Economic performance, party identification, and length of party reign all have an effect. At this time, the economy is the only question mark. But taking Fair's most recent (July 27) forecasts for GROWTH and ALLNEWS, 1.62% and 1, respectively, the Fiscal Model forecasts for Obama's share of the two-party vote, obtained by estimating both versions shown in table 1 over the short period, the one Fair uses to make his forecasts, is 46.9% with FPRIME and 45.5% with FISCAL. The probability that he will win more than 50% is 0.11 and 0.05, respectively. In other words, at this point, several months before the election, the Fiscal Model predicts Obama to lose the two-party vote by about the same margin as he won it in 2008. Even if he does squeeze by the Republican candidate, it is highly likely that President Obama would do so with a smaller share of the vote than in 2008, the first president in well over a century to be reelected to a second term by a thinner margin of victory than he received the first time around.