Introduction
Clay minerals are composed of permanently charged platelets with equivalent spherical diameter <2 μm (Schoonheydt & Johnston Reference Schoonheydt and Johnston2006). Because of the high surface charge and the large surface area, clay minerals possess high sorption and pH buffering capacity (Bloom Reference Bloom and Sumner2000). Hydration of charge-compensating interlayer cations in clay minerals leads to swelling and diffusive migration of water molecules and cations. Due to the low hydraulic conductivity and self-sealing properties related to swelling, clays are used as efficient hydraulic barriers to contain migration of hazardous contaminants (Lo et al. Reference Lo, Mak and Lee1997; Edil Reference Edil2003; Rowe Reference Rowe2005). For instance, Opalinus Clay (Switzerland) is proposed as a potential host rock for geological waste disposal (Marschall et al. Reference Marschall, Horseman and Gimmi2005). Bentonite is used as a sealing material in the Swedish waste disposal concept for high-level radioactive waste (SKB 2006). Clay cap-rocks are used for carbon storage and sequestration (Song & Zhang Reference Song and Zhang2013).
The hydraulic permeability of compacted argillaceous rocks is extremely low. Molecular diffusion is the dominant transport mechanism of solute and solvent in these materials. Several experimental observations provide clear evidence that the surface adsorbed cations in compacted clays are not fully immobilized and contribute to the overall diffusive flux (van Schaik et al. Reference van Schaik, Kemper and Olsen1966; Eriksen et al. Reference Eriksen, Jansson and Molera1999; Melkior et al. Reference Melkior, Yahiaoui, Motellier, Thoby and Tevissen2005, Reference Melkior, Yahiaoui, Thoby, Motellier and Barthes2007; Van Loon & Eikenberg Reference van Loon and Eikenberg2005; Gimmi & Kosakowski Reference Gimmi and Kosakowski2011). The mechanism and the importance of surface diffusion in argillaceous rock is still under debate (Bourg et al. Reference Bourg, Bourg and Sposito2003). Effective macroscopic transport in porous media depends on a number of geometrical and electrochemical parameters. The pore network connectivity, tortuosity, and pore-size distribution are the geometric constraints controlling mass transport (Tyagi et al. Reference Tyagi, Gimmi and Churakov2013; Churakov et al. Reference Churakov, Gimmi, Unruh, Loon and Juranyi2014; Gimmi & Churakov Reference Gimmi and Churakov2019). The interaction of ions with the charged mineral surfaces leads to the formation of so-called diffuse double layers (DDL). For negatively charged clay minerals, the DDL is enriched in cations and depleted in anions. The mobility of cations within the DDL has been shown to be reduced due to electrokinetic phenomena and the steric interaction of ions with clay mineral surfaces (Rotenberg et al. Reference Rotenberg, Marry, Dufreche, Malikova, Giffaut and Turq2007a, Reference Rotenberg, Marry, Dufrêche, Giffaut and Turqb; Pagonabarraga et al. Reference Pagonabarraga, Rotenberg and Frenkel2010; Botan et al. Reference Botan, Rotenberg, Marry, Turq and Noetinger2011; Obliger et al. Reference Obliger, Duvail, Jardat, Coelho, Bekri and Rotenberg2013, Reference Obliger, Jardat, Coelho, Bekri and Rotenberg2014; Schaettle et al. Reference Schaettle, Pestana, Head-Gordon and Lammers2018). In order to model accurately water and cation diffusion in a reactive transport environment, the effect of DDL (Alt-Epping et al. Reference Alt-Epping, Gimmi, Wersin and Jenni2018) and pore network geometry need to be taken into account simultaneously.
Macroscopic reactive transport models (Yang et al. Reference Yang, Patel, Churakov, Prasianakis, Kosakowski and Wang2019) integrate such complex phenomena in a very simplistic way; e.g. using the Poisson-Boltzmann equation to describe the properties of a mineral–fluid interface. The Poisson-Boltzmann equation is based on the assumption that the ions are point charges embedded in a uniform dielectric continuum and, thus, the molecular nature of solvent and finite ionic size are completely ignored. Consequently, macroscopic models break down, especially when the interlayer space or water content is very small (Rotenberg et al., Reference Rotenberg, Marry, Dufreche, Malikova, Giffaut and Turq2007a, Reference Rotenberg, Marry, Dufrêche, Giffaut and Turqb) or at high surface charge density and high ionic strength.
In contrast to simplified macroscopic models, molecular simulations such as Monte Carlo (MC) (Torrie & Valleau Reference Torrie and Valleau1980; Boda et al. Reference Boda, Henderson, Plaschko and Fawcett2004; Silvestre-Alcantara et al. Reference Silvestre-Alcantara, Kaja, Henderson, Lamperski and Bhuiyan2016) and molecular dynamics simulations (MD) (Chang et al. Reference Chang, Skipper and Sposito1998; Marry et al. Reference Marry, Rotenberg and Turq2008; Holmboe & Bourg Reference Holmboe and Bourg2014; Yang et al. Reference Yang, Neretnieks and Holmboe2017b) take the finite size of molecular solvent and ions and, most relevant, the interatomic interactions of the system into account (Kosakowski et al. Reference Kosakowski, Churakov and Thoenen2008; Churakov & Gimmi Reference Churakov and Gimmi2011; Churakov Reference Churakov2013; Prasianakis et al. Reference Prasianakis, Curti, Kosakowski, Poonoosamy and Churakov2017). However, they are computationally expensive for the description of mineral–fluid interactions if large systems need to be considered. Classical density functional theory (DFT) (Henderson Reference Henderson1992; Hansen & McDonald Reference Hansen and McDonald2006; Yang & Liu Reference Yang and Liu2015; Yang et al. Reference Yang, Neretnieks, Moreno and Wold2016, Reference Yang, Neretnieks, Moreno and Wold2017a) at the atomistic level has been used widely to describe the mineral–fluid interfaces because it provides a computationally inexpensive alternative. Numerical modeling based on classical DFT can easily handle molecular systems two to three orders of magnitude larger than one considered in MC and MD simulations. Classical DFT has difficulty taking into account hydrogen bonding between water molecules and the surface of the clay mineral (Sposito Reference Sposito1984) and describing specific orientation-dependent distributions of the interfacial water molecules hydrating the surface and the interlayer ions (Marry et al. Reference Marry, Rotenberg and Turq2008). Recently, Borgis and coworkers proposed a DFT for SPC/E water, which has been used to study pyrophyllite (Jeanmairet et al. Reference Jeanmairet, Marry, Levesque, Rotenberg and Borgis2014).
Various models have been proposed within the framework of classical DFT to take into account the solvent effects. For example, early work (Tang et al. Reference Tang, Scriven and Davis1992, Lamperski & Zydor Reference Lamperski and Zydor2007) introduced the solvent primitive model i.e. a three-component model (3CM or the so called DFT/HS-3CM), in which the solvent molecules are represented by neutral hard spheres (HS) on the basis of the simplest restricted primitive model (Yang et al. Reference Yang, Neretnieks, Moreno and Wold2016, Reference Yang, Neretnieks, Moreno and Wold2017a) (RPM or the so called DFT/HS-2CM), where the ions of electrolytes with the same size are modeled by hard spheres with point charges located at their centers, the electrode by a uniformly charged surface, and the solvent by a uniform dielectric continuum. Comparison between the RPM and the 3CM models showed that the solvent plays a significant role in the solid–fluid interfacial properties (Lamperski & Zydor Reference Lamperski and Zydor2007). Later, the 3CM model was validated (Lee et al. Reference Lee, Templeton, Mandadapu and Zimmerman2013) by comparison with the molecular solvent model (Jorgensen et al. Reference Jorgensen, Chandrasekhar, Madura, Impey and Klein1983; Price & Brooks Reference Price and Brooks2004) in which solvents and ions were described explicitly as distinct atoms, using MD simulations. However, most of the insights into the solvent arrangement could not be provided by the 3CM model, notwithstanding the fact that the density distributions and other interfacial properties were qualitatively captured by such a coarse-grained model. Lee et al. (Reference Lee, Nilson, Templeton, Griffiths, Kung and Wong2012), therefore, introduced a modified 3CM which incorporated Lennard-Jones attractions into the fluid–fluid and fluid–wall interactions rather than the hard-sphere and hard-wall repulsions. Other DFT studies of electrolytes in solution also used solvent modes. For instance, Oleksy & Hansen (Reference Oleksy and Hansen2010) proposed wetting a solid substrate by a “civilized” model of ionic solutions, in which water is described by dipolar hard spheres. Lian et al. (Reference Lian, Zhan, Jiang, Liu and Wu2017) investigated electrostatic energy extraction by few-layer graphene electrodes, where the solvent is described by hard sphere dimers with opposite charges.
Many attempts have been made to reproduce the properties of interfacial water layers as revealed by molecular simulations and experimental observations (Fenter et al. Reference Fenter, Cheng, Rihs, Machesky, Bedzyk and Sturchio2000; Schlegel et al. Reference Schlegel, Nagy, Fenter, Cheng, Sturchio and Jacobsen2006) using simplified theories from the perspective of a macroscopic scale (Qiao & Aluru Reference Qiao and Aluru2003; Tournassat et al. Reference Tournassat, Chapron, Leroy, Bizi and Boulahya2009; Botan et al. Reference Botan, Marry, Rotenberg, Turq and Noetinger2013). An advanced Grand Canonical Monte Carlo (GCMC) technique was used (Moucka et al. Reference Moucka, Svoboda and Lisal2017) to model pyrophyllite and Na-Mnt in equilibrium with a bulk solution having salt concentrations of 3.14 and 6.6 mol kg–1 with pore size ranging from ~7 to 28 Å. This GCMC technique is based on fractional exchanges of dissolved ions and water molecules. The chemical potentials of NaCl and water in the bulk phase were determined using Osmotic Ensemble Monte Carlo simulations. The chemical potential was then used in GCMC to simulate the adsorption of ions and water molecules in the clay pores, and in turn to predict the salt solubility in confined solutions.
The present work was motivated by the GCMC and the merits of the modified 3CM model, which can be implemented numerically by classical DFT, to describe the structure and interfacial properties by explicitly taking into account the solvent effects, yet in a simplified form. Atomistic simulations reveal clearly that water molecules play an important role in saturated (Holmboe & Bourg Reference Holmboe and Bourg2014) or partially saturated clay systems (Churakov Reference Churakov2013). Therefore, theoretical methods at the atomic level such as classical DFT take into account water molecules for mineral–fluid interfaces. To this end, the objective was to validate the DFT/LJ-3CM of modeling structures of water molecules and ions in Mnt interlayers by atomistic simulations under a wide range of conditions, to compare systematically the new DFT approach with the structural data obtained by MD simulations, and then to test thermodynamic properties of the model with respect to the swelling behavior of clay systems and ion exchange as a function of water content, ionic strength of electrolyte (1:1, 2:1 salts), and temperature.
Methods and Models
System Setup for Molecular Simulations
A periodic 3D supercell containing two fully flexible Mnt layers was set up according to the previous modeling studies of hydrated Mnt (Skipper et al. Reference Skipper, Chang and Sposito1995a,Reference Skipper, Chang and Spositob; Tambach et al. Reference Tambach, Hensen and Smit2004; Tournassat et al. Reference Tournassat, Chapron, Leroy, Bizi and Boulahya2009; Bourg and Sposito Reference Bourg and Sposito2011; Holmboe & Bourg Reference Holmboe and Bourg2014; Marry et al. Reference Marry, Rotenberg and Turq2008). A single TOT (2:1 tetrahedral-octahedral-tetrahedral) layer in the simulation supercell consisted of 6×6×1 unit cells of Mnt. The supercell dimensions in the direction perpendicular to the basal plane were adjusted to accommodate the appropriate number of water molecules in the interlayer to simulate the hydration state of Mnt. The Mg–for-Al isomorphic substitutions in the octahedral sheet were distributed randomly, but excluded Mg-Mg pairs to maintain a mean layer surface charge density of –0.116 C/m2, consistent with previous MD simulations (Tournassat et al. Reference Tournassat, Chapron, Leroy, Bizi and Boulahya2009). A representative snapshot (Fig. 1) shows the simulation supercell of Na-Mnt in the 5W hydration state with z dimension 50.8 Å, containing 52 Na ions, 4 Cl ions, and 1800 H2O water molecules. In the following discussion, the interlayer size is defined as the distance between the basal planes of the outermost oxygen atoms of Mnt.
Snapshot of a MD simulation cell showing Na-Mnt in the 5W hydration state with z dimension 50.8 Å containing Na ions (dark blue), Cl ions (light blue), and water molecules (O and H atoms are in red and white, respectively). The clay layer consists of an octahedral sheet (pink) sandwiched by tetrahedral sheets (gold yellow)

Classical MD Simulations
MD simulations were performed using the open source package GROMACS (Berendsen et al. Reference Berendsen, van der Spoel and van Drunen1995; van der Spoel et al. Reference van der Spoel, Lindahl, Hess, Groenhof, Mark and Berendsen2005) which uses the CLAYFF force field (Cygan et al. Reference Cygan, Liang and Kalinichev2004) for montmorillonite, the ion-potentials reported by Åqvist (Reference Åqvist1990) for Ca2+, Joung-Cheatham parameters (Joung & Cheatham III Reference Joung and Cheatham III2008) for monovalent ions (Na+/Cl–), and the SPC/E water model (Berendsen et al. Reference Berendsen, Grigera and Straatsma1987) for all interatomic interactions. The Lennard-Jones shift potential was truncated beyond a cutoff value of 1.0 nm. The long-range electrostatic interactions were computed using the Particle-Mesh-Ewald (PME) method (Darden et al. Reference Darden, York and Pederson1993). All atomic simulations were conducted at 298 K using a time step of 1 fs. The integration of the equations of motion was performed using the leap-frog algorithm. Energy minimization with the steepest descent algorithm was used to prepare the initial configurations. The equilibration was performed in two steps. First, the system was pre-equilibrated in the NPT ensemble (pressure P, number of particles N, and temperature T were fixed) for 5 ns using the Berendsen barostat (Berendsen et al. Reference Berendsen, Postma, van Gunsteren, DiNola and Haak1984) at 298 K and 1 bar to relax the Mnt layers and interlayer electrolytes in all the dimensions. The 5 ns-long NVT (fixed volume V, N, and T) runs were performed using position restraints of the clay lattices to generate equilibrated systems. The x and y dimensions of the NVT supercell in all simulated hydration states were kept at 31.0 Å×54.2 Å. The dimensions of the supercell in the z direction and the composition of the interlayer are given in Table 1. The production runs were performed for 125 ns in the NVT ensemble at 298 K.
Simulation parameters of the supercell for the MD simulations

Fluid DFT Calculations
The f-DFT simulations were conducted using the open source package Tramonto developed at Sandia National Laboratories (https://software.sandia.gov/tramonto/). The f-DFT simulations were performed in grand canonical ensemble (μVT), where the total volume V, the temperature T, and the chemical potentials μ of the system were kept constant. Classical MD used in this study was implemented in the NVT ensemble. Therefore, the assignment of a consistent setup for f-DFT and MD simulations and μVT and NVT ensembles was not trivial. To match the condition of f-DFT and MD simulations two different approaches for the system were used at low (<5 water layers) and high (≥5 water layers) degrees of hydration. At low degrees of hydration, the total number of ionic species and water molecules in the interlayer space were set to be the same in both f-DFT and MD systems. At high degrees of hydration the chemical potential in f-DFT was set to match the density representing the regions of homogeneous fluid in the central part of the interlayer space.
In f-DFT, the density distributions of molecular species of fluid at equilibrium, ρ
i
(r), were determined by minimization of the grand potential energy at equilibrium described by the Euler-Lagrange equation. The chemical potential was expressed as a function of the external potential, Coulomb forces, ideal gas components, and excess energy due to hard-sphere repulsions (
 ), Lennard-Jones attractions (
 ), and short-range electrostatic interactions (
 ) were evaluated with the Mean Spherical Approximation (MSA) (Waisman & Lebowitz Reference Waisman and Lebowitz1972):

in which ψ(r) is the local electrostatic potential resulting from the Coulombic interaction between point charges and that from the electrostatic part of the external potential, which was obtained by solving Poisson’s equation, q i is the valence of the ionic species i using the expression

where ε0 is the vacuum permittivity, ε r is the relative permittivity or dielectric constant, z i is the valence of the ionic species i, and e is the elementary charge. The external field, u i (r), is induced by the clay surface, which is described as a flat wall with surface charge density σ uniformly distributed on the surface, k is Boltzmann’s constant, T is the absolute temperature, and f i (r) is the Helmholtz free energy per molecule of the particle i.
The one-dimensional external potential due to the wall–fluid interaction was represented by the Lennard-Jones 9-3 potential:

where
 is the LJ energy interaction parameter for wall–fluid interaction potential, d is the LJ particle diameter, and z is the position of molecular particle i from the wall in the direction perpendicular to the wall. The wall-fluid potential cutoff was set at 3.5 d.
The LJ interaction is described in a spirit of perturbation theory as hard-sphere interaction with an effective hard-sphere parameter d and the correction due to long-range interactions (Tang et al. Reference Tang, Scriven and Davis1991). The hard-sphere component,
 , was calculated using the fundamental measure theory (FMT) developed by Rosenfeld (Reference Rosenfeld1989). The short-range interaction cutoff for
 was 1d. The excess free energy was based on the following formula,

Note that for a complete description including non-local densities, n and nv, as well as an analysis of the functionals, the reader is referred to the original references (Rosenfeld Reference Rosenfeld1989).
The excess part of free energy due to the LJ attraction with respect to a hard-sphere reference fluid is defined by a density-weighted integral of a pair potential function over the surrounding fluids, separately summing the contributions from each species,

where
 is the LJ energy interaction parameter for fluid–fluid interaction potential, r = |s − r
′| refers to the distance between particles i at position s and j at r
′, and r is the cutoff distance. This contribution was considered to be within 1 to 3.5 molecular diameters, while it is set to zero outside this region.
The contribution to the free energy accounting for the short-range electrostatic interactions is expressed as

in which
 is the cross-correlation between the Columbic interaction and the hard-sphere exclusion, i.e. the electric residual part of the pair direct correlation function defined as the second functional derivative of the excess part of the free energy functional with respect to the single-particle density distribution (Hansen & McDonald Reference Hansen and McDonald2006). It can be modeled with MSA (Waisman & Lebowitz Reference Waisman and Lebowitz1972) for homogeneous systems, leading to

with the B parameter written as B = Γd/(1 + Γd), where
 ,
 ,
 is the density of species i in bulk reservoir, q
i
is the valence of the ionic species i, and e is the elementary charge. The relative permittivity depends, in general, on the system temperature and composition.
Results and Discussion
Fluid Structure at the Interface
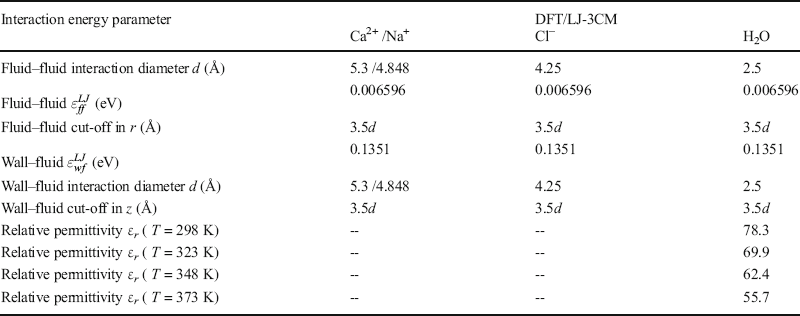
The interaction parameters used in the f-DFT calculations are reported in Table 2. In the DFT/LJ-3CM results, the structural and thermodynamic properties such as density profiles, cation selectivity of ion exchange equilibrium, and free energy were fitted to reproduce atomistic simulations (Marry et al. Reference Marry, Rotenberg and Turq2008; Yang et al. Reference Yang, Neretnieks and Holmboe2017b), and the LJ energy parameters for fluid–fluid and wall–fluid were taken from molecular simulations (Magda et al. Reference Magda, Tirrell and Davis1985; Lee et al. Reference Lee, Nilson, Templeton, Griffiths, Kung and Wong2012). The uniform surface charge density in DFT//LJ-3CM was set to be the same as in MD simulations, –0.116 C/m2. To test the performance of the DFT/LJ-3CM in comparison with the DFT/HS-3CM, i.e. the solvent primitive model, the results for both approaches were compared with MD simulation for Mnt in the 10W hydrate state. HS radii used in the DFT/HS-3CM were the same as the LJ parameters in Table 2.
The interaction energy parameters for the DFT/LJ-3CM simulation

The DFT/LJ-3CM results taking into account the solvent effects were compared first with the atomic simulations for the case when Na-Mnt was saturated in a 0.62 M NaCl bulk solution. Density distributions were compared among water H2O (i.e. water oxygen OW in MD simulations), Na+ and Cl– in the interlayer obtained with DFT/LJ-3CM, DFT/HS-3CM models, and atomic simulations (Fig. 2). The structured density profiles of interlayer water and ions from atomic simulations were predicted accurately by the DFT/LJ-3CM results. DFT/HS-3CM calculations overestimated, by nearly four times, the contact cation (Na+) and water concentrations. The excessive cation density at the contact resulted in overcharging of the surface and values which were too large for co-adsorption of anions (e.g. Cl–) at the interface. In the DFT/HS-3CM model, the solvent was modeled by neutral spheres instead of a dielectric continuum as used in DFT/HS-2CM. Therefore, the wall/ion electrostatic interaction would be overestimated in the DFT/HS-3CM model and this could explain the overestimation of the densities at contact.
Density distributions of Na+ and Cl– ions and H2O from DFT/LJ-3CM calculations as a function of distance from the surface in the 10W hydration state. The DFT/LJ-3CM results are compared with atomic simulations (gray curves) and with calculations using the DFT/HS-3CM (blue curves) and DFT/HS-2CM (dark blue curves) models

A similar comparison was conducted using the DFT/LJ-3CM model for Mnt saturated in a 0.23 M CaCl2 bulk solutions for Ca-Mnt in the 10W hydration state. The density distributions of calcium and chloride ions and water molecules as a function of distance from the surface were obtained with the DFT/LJ-3CM model and from atomistic simulations. The DFT/LJ-3CM results agreed well with the atomistic simulations. The DFT/LJ-3CM model successfully captured the damped oscillations of Ca2+ and H2O density distributions in the vicinity of the surface (Fig. 3). These important features were missing from the density profile obtained with the DFT/HS-2CM model. Furthermore, the number of density profiles of ionic and solvent molecules in the vicinity of the charged surface were substantially overestimated by the DFT/HS-3CM model. The mismatch of anion density predicted by the DFT/HS-3CM model in the 2:1 (e.g. CaCl2) was even larger than in the 1:1 (e.g. NaCl) electrolyte. This can be explained by the stronger electrostatic effect of the Ca2+ ion compared to Na+. For the same (overestimated) cation atom density, Ca2+ resulted in stronger co-adsorption of Cl– anions at the surface. The comparison demonstrated that the DFT/LJ-3CM model clearly performed better than the DFT/HS-3CM model near the fluid–wall interface, especially for 2:1 electrolytes. Accordingly, further comparison of results from the molecular simulation with the DFT/LJ-3CM model was restricted.
Density distributions of Ca2+, Cl– ions, and H2O from the DFT/LJ-3CM calculations as a function of distance from the surface in the 10W hydration state. The DFT/LJ-3CM results are compared with atomic simulations (gray curves) and with calculations using the DFT/HS-3CM (blue curves) and the DFT/HS-2CM (dark blue curves) models

To test further the accuracy of the DFT/LJ-3CM model, the f-DFT results were compared with atomistic simulations of Na-Mnt in NaCl solution with various water contents, i.e. 2W, 3W, 4W, and 5W hydrated states (Holmboe & Bourg Reference Holmboe and Bourg2014; Yang et al. Reference Yang, Neretnieks and Holmboe2017b). The anions were essentially excluded from the nanopore when the distance between Mnt layers was <10 Å. The f-DFT results were insensitive to the bulk concentration of NaCl when the nanopore between Mnt layers was <10 Å. Accordingly, the concentration of bulk NaCl solutions in DFT calculations was set to be 0.6 M for Mnt in 2W, 3W, 4W, and 5W hydrated states.
The density profiles in a ~6.4 Å interlayer pore (Fig. 4 ) were obtained from the DFT/LJ-3CM model and atomistic simulations corresponding to the 2W hydration state. The DFT/LJ-3CM model predicted two symmetrically peaked, cation-density profiles whereas atomistic simulations predicted single-peaked Na+ density in the middle of the interlayer (Fig. 4 ). At such a low hydration state, the observed structuring of the fluid was controlled by the strong orientation-dependent ion–solvent and solvent–surface interactions. The observed difference was clear evidence that important features such as H-bonding and rotation of water molecules were not taken into account by the DFT/LJ-3CM model.
Comparison of density distributions of Na+ (dark blue) and water (light blue) predicted by the DFT/LJ-3CM model with atomic simulations (black curves) as a function of distance from the Mnt surface in 2W hydration state. The dashed gray lines represent the position of the outermost oxygen sites on the Mnt surface. The concentration of Cl– ions was negligibly low and is not shown here for clarity

Low temperature ion-dipole interaction cannot be captured by the orientation-independent LJ potential. However, the main features of water density distributions were captured successfully by the DFT/LJ-3CM results (Fig. 4). Atomistic simulations also indicated a small fraction of Na+ forming a small local density maximum at ~1.5 Å from the surface. These were inner-sphere complexes entering the hexagonal cavities of the tetrahedral sheet of Mnt. Such complexes were also present at the greater degrees of hydration discussed later. These features cannot be considered in the current DFT/LJ-3CM model which uses a simple planar interface.
The density distributions of calcium ions and water molecules in a ~9 Å interlayer pore were predicted by the DFT/LJ-3CM model and by atomistic simulations for Mnt in the 3W hydration state (Fig. 5). The DFT/LJ-3CM model captured the features of the density profiles of cations, especially the structure of interlayer water molecules in the 3W hydration state.
Comparison of density distributions as a function of distance from the surface in the 3W hydration state from the DFT/LJ-3CM calculations (Na ion density is dark blue and H2O density is light blue) with atomic simulations (black curves)

Again, Na and H2O density profiles were predicted by the DFT/LJ-3CM model and the atomistic simulations of Mnt in the 4W hydrate state (Fig. 6). Similar Na and H2O density profiles were predicted by the DFT/LJ-3CM model and the atomistic simulations for the 5W hydration state (Fig. 7). The density profiles of sodium ions predicted by the DFT/LJ-3CM model were more structured than profiles from MD simulations. Both the DFT/LJ-3CM results (blue curves) and the atomistic simulations (black curves) showed that Na+ ions were enriched at a distance of approximately 0.5d from the surface. This is comparable to the typical ion–surface distance of Na-outer-sphere complexes. As for the 3W state, DFT/LJ-3CM slightly over-predicted the structuring of the ion and water in the middle of the interlayer. The secondary features in the ions and water density distributions related to the non-planar surface topography were not reproduced by the f-DFT model. These secondary density maxima are related to partially hydrated inner-sphere Na ions entering the hexagonal cavities on the Mnt surface. Such a complex solvation behavior cannot be captured by the DFT/LJ-3CM model due to the over-simplistic planar representation of the surface and the lack of orientation-dependent ion–dipole interaction.
Comparison of density distributions as a function of interlayer separations in the 4W hydration state obtained using the DFT/LJ-3CM model (Na ions are dark blue and H2O is light blue) with atomic simulations (black curves)

Comparison of density distributions as a function of interlayer separations in the 5W hydration state from the DFT/LJ-3CM model (Na ions in dark blue and H2O in light blue) with atomic simulations (black curves)

Overall analysis of the data demonstrated that the DFT/LJ-3CM model could capture the primary structural properties of ions and water in the vicinity of a fluid surface interface for very different hydration states of Mnt. The model tended to over-predict the structuring at greater distances from the surface in comparison with the MD simulation results. The features related to the non-planar interface and the changes in the hydration state of the ions, because of the changes from outer-sphere to the inner-sphere complexes, cannot be captured within the currently used DFT/LJ-3CM model.
Swelling Behavior
Depending on the chemical potential of water, smectite minerals are known to contain a distinct number of water molecules in the interlayer, commonly referred to as 1W, 2W, and 3W hydration states (Mooney et al. Reference Mooney, Keenan and Wood1952; Karaborni et al. Reference Karaborni, Smit, Heidug, Urai and Oort1996; Kawamura et al. Reference Kawamura, Ichikawa, Nakano, Kitayama and Kawamura1999). The stability of a particular hydration state and the exact interlayer thickness depends on temperature, composition of the electrolyte solution (both concentration and ion speciation in particular), and the distribution of isomorphic substitution in the TOT layer (Boek et al. Reference Boek, Coveney and Skipper1995a,Reference Boek, Coveney and Skipperb; Young & Smith Reference Young and Smith2000; Hensen & Smit Reference Hensen and Smit2002; Smith et al. Reference Smith, Wang, Chaturvedi and Whitley2006; Tambach et al. Reference Tambach, Bolhuis, Hensen and Smit2006). A model-based description of smectite swelling is essential for prediction of a clay’s mechanical properties (Hoang & Galliero Reference Hoang and Galliero2015; Sun et al. Reference Sun, Hirvi, Schatz, Kasa and Pakkanen2015). The stable hydration state corresponds to the minimum value of the free energy of the system. The dependence of surface free energy, Ω(h), on the interlayer separation, h, is calculated by an integration of the solvation force via (Frink & van Swol Reference Frink and van Swol1998):

The constant Ω(∞) is equal to the surface free energy of an isolated wall in equilibrium with bulk fluid. The factor 2 in the left hand side of Eq. 8 accounts for the presence of two interfaces in the slit pore. The absolute minimum in Ω(h) determines the thermodynamically stable equilibrium separation of two walls, separated by h, for an unconstrained swelling condition, where the solvation force f s is defined as f s = p − p b , and p is the total normal force per unit area on each wall, whereas p b is the bulk pressure at the chosen chemical potential and temperature.
The dimensionless free energy of the system for Na- and Ca-Mnt was plotted as a function of slit pore size for various ionic strengths (Fig. 8). The symbol A in the vertical axis represents the surface area. Depending on the ionic strength of the external electrolyte, the stable states of the Ca and Na-Mnt predicted by DFT/LJ-3CM were either a dispersed one at lower ionic strength or a compacted “3W-Layer” state at higher ionic strength. The model for Na-Mnt predicted the dispersion to be stable if the bulk concentration of monovalent ions was <2 M (Fig. 8a). The model for Ca-Mnt predicted the dispersion state to be stable at bulk concentrations of 2:1 electrolyte below 0.01 M (Fig. 8b). The metastable states with 2W and 4W layers were also apparent in the free energy profiles as local minima. The prediction of stable interlayer distances was based on changes in the chemical potential of each ion in the bulk electrolyte. The 2W state can become stable over the 3W state if the chemical potential of solute is further reduced, e.g. partial saturation (Churakov Reference Churakov2013). The behavior of the DFT/LJ-3CM for Mnt agreed very well qualitatively with the behavior of natural systems. The quantitative differences were related to the over-simplistic description of solvent and solvent–solute interactions, which were not captured in the model. Contrary to the experimental observations, Poisson-Boltzmann approximations predict repulsive interaction of Mnt platelets in NaCl and CaCl2 solutions (Segad et al. Reference Segad, Jonsson, Akesson and Cabane2010). The 2-component RPM model improved the predictions, suggesting an attractive force between TOT layers in Ca-Mnt at ~10 Å separation. In contrast to the DFT/LJ-3CM, the two-component RPM did not predict the existence of other, eventually metastable, hydration states. In this context the DFT/LJ-3CM model used in the present study clearly performed better than the widely used DFT-based description of swelling in clay minerals.
Free energy per unit surface area as a function of the equilibrium interlayer separation between two smectite TOT layers in a NaCl, and b CaCl2 bulk solutions. The ionic concentrations are indicated in the plots

Thermodynamics of Ion Sorption
In this section, the DFT/LJ-3CM model was applied to evaluate ion exchange equilibrium and to estimate the effect of temperature on cation selectivity. The cation exchange between Ca2+ and Na+ ions in the interlayer of Mnt can be expressed by the following reaction (Appelo & Postma Reference Appelo and Postma2005):

where X indicates the clay mineral exchanger. The selectivity coefficient of ion exchange K GT is given by the Gaines-Thomas convention (Gaines & Thomas Reference Gaines and Thomas1953; Appelo & Postma Reference Appelo and Postma2005) as

where square brackets denote activities. [Na +] and [Ca 2+] represent the activities of ions Na+ and Ca2+ in water, which can be related to the ion concentrations in bulk aqueous solutions. The surface activities [Na − X] and [Ca − X 2] are approximated by the equivalent charge fractions of Na+ and Ca2+ ions in the adsorbed phase in the DFT calculations. More detailed discussions of surface activities and ion exchange properties of clay minerals is available elsewhere (Yang et al. Reference Yang, Neretnieks, Moreno and Wold2017a).
The selectivity coefficient K
GT
as defined with the Gaines-Thomas convention was obtained by the DFT/LJ-3CM and the experimental results (Sposito et al. Reference Sposito, Holtzclaw, Charlet, Jouany and Page1983) of the surface activities [Na − X] i.e. βNa = τ
Na
/(τ
Na
+ 2τ
Ca
), where
 (Table 3). The selectivity coefficients K
GT
obtained previously using the DFT/HS-3CM model (Yang et al. Reference Yang, Neretnieks, Moreno and Wold2017a) are shown for comparison.
Thermodynamics of Ca-Na exchange in Wyoming Mnt predicted using the DFT/LJ-3CM model (present study), the DFT/HS-3CM model (Yang et al. Reference Yang, Neretnieks, Moreno and Wold2017a), and the experimental data of Sposito et al. (Reference Sposito, Holtzclaw, Charlet, Jouany and Page1983)

To demonstrate the ability of the DFT/LJ-3CM to describe the cation exchange in Ca-Na-Mnt, the corresponding data in Table 3 were plotted (Figs. 9 and 10), and revealed (Fig. 9) the equivalent charge fractions of Na ions in the adsorbed phase, i.e. surface activities of Na-X (βNa) from the experiments and the DFT/LJ-3CM calculations as a function of the mole fraction of Na ions in the mixture of NaCl and CaCl2 bulk solutions. The calculations were performed at room and higher temperatures taking into account the change in the relative dielectric permittivity of water (Malmberg & Maryott Reference Malmberg and Maryott1956). The dielectric constant in the interlayer and in the bulk solution was assumed to have the same temperature dependence. The model predicted that temperature has a very limited effect on the cation exchange in Na-Ca-Mnt. Na sorption decreased only slightly with increasing temperature. The comparison of f-DFT calculations and experiments showed that the DFT/LJ-3CM model can quantitatively and qualitatively reproduce the measurements of cation exchange for Mnt in the Na and Ca electrolyte solutions.
Surface activities as a function of the mole fraction of Na+ ions in the mixture of NaCl and CaCl2 bulk electrolytes

The selectivity coefficient K GT as a function of the mole fraction of Na ions in the mixture of NaCl and CaCl2 bulk solution

The selectivity coefficient K GT from the DFT calculations and measurements, represented as a function of the mole fraction of NaCl in the mixture of NaCl and CaCl2 bulk solutions using the DFT/LJ-3CM (Fig. 10), revealed a distinct advantage over the RPM calculations in comparison with the experimental results (Sposito et al. Reference Sposito, Holtzclaw, Charlet, Jouany and Page1983). The DFT/LJ-3CM results agreed quite well with the experiments when the mole fraction of Na ions in the bulk was >0.4. The interlayer separations in the f-DFT calculations of the selectivity coefficient were set at 30 Å when Na was dominant (i.e. Na mole fraction >0.7), which is commonly used in simulations for pure Na electrolyte solutions because the Mnt layers tend to disperse. However, the Mnt layers collapsed and formed a gel with ~9 Å interlayer separation (the compacted ‘3W-Layer’ state) for Ca salts with bulk ion concentration ≥10 mM (Fig. 8). Accordingly, the interlayer separations in the DFT calculations were set to be 9 Å when Ca was dominant in the bulk solutions (i.e. Na mole fraction <0.7). The selectivity coefficient log10 K GT (Fig. 11) was plotted as a function of the Na charge fraction at the surface, i.e. the surface activities in the adsorbed phase. A linear relationship consistent with the experimental observations was recovered between the selectivity coefficient and the surface activities.
The selectivity coefficient, log10 K GT , as a function of the charge fraction of the Na+ ions in the adsorbed phase. The curve shows the DFT results. The solid dots represent the experimental data from Sposito et al. (Reference Sposito, Holtzclaw, Charlet, Jouany and Page1983)

Summary and Conclusions
The accurate description of fluid–solid interface structure and the thermodynamics of the diffuse double layer (e.g. ionic concentration profiles and ionic mobility as a function of distance from the surface) is indispensable for accurate modeling of ion transport and retention in compacted clay systems (van Schaik et al. Reference van Schaik, Kemper and Olsen1966; Gimmi & Kosakowski Reference Gimmi and Kosakowski2011). These model parameters can be obtained, in principle, by full-scale atomistic simulations. The direct application of MD simulation to near-reality systems representing complex networks of pores in clays is currently not feasible due to the high computational costs (Churakov & Gimmi Reference Churakov and Gimmi2011; Churakov et al. Reference Churakov, Gimmi, Unruh, Loon and Juranyi2014). Widely used and computationally efficient RPM models of electrolyte on the other hand ignore the molecular nature of the solvent and fail to provide good quantitative description of the ion and solvent profiles close to the solid interface due to the simplistic nature of the underlying interaction potential. Application of three componen tf-DFT models for electrolytes, which take into account soft ions and solvent, could be a powerful way to obtain accurate molecular-scale descriptions of mineral–electrolyte interfaces at comparatively low computational costs.
In the present work, the performance of the three-component DFT/LJ-3CM model was tested against full-scale molecular simulation of Na and Ca Mnt in various hydration states. In good agreement with the atomistic simulation, the DFT/LJ-3CM model reproduced accurately the short-range structuring of the ions and solvent molecules at TOT layer separations >10 Å. In very narrow slit pores of <10 Å, the solvent structure was reasonably reproduced. Under these conditions, the molecular system behavior was controlled by orientation-dependent ion-dipole interaction and hydrogen bonding. Furthermore, the real clay surface has a complex 3-dimensional arrangement of oxygen atoms, allowing ion-specific steric interaction, whereas the f-DFT model assumes a planar interface. These coordination-dependent interactions and the molecular nature of the surface were not taken into account properly in the current model.
The DFT/LJ-3CM model was further applied to evaluate swelling behavior of Ca and Na Mnt and the Na-Ca exchange equilibrium. The calculations of selectivity coefficients for Na-Ca exchange reactions agreed well with experimental observations. The swelling behavior of DFT/LJ-3CM Mnt was in good qualitative agreement with the experimental observations. Exceptionally, the model predicted local free energy minima of the system for discrete 1W, 2W, and 3W hydration states. The DFT/LJ-3CM model is clearly superior to conventional 3CM and RPM in predicting solvent structure and the thermodynamics of DDL.
The DFT/LJ-3CM calculations were at least 3-4 orders of magnitude less demanding in terms of computational resources compared to conventional MD simulations. The DFT/LJ-3CM model applied in this work was able to describe the cation selectivity of ion exchange equilibrium in a wide range of solution compositions. Such a model can be used in reactive transport simulators and modeling ion migration taking place under more complex thermo-chemo-hydro-mechanical conditions. The ability of the DFT/LJ-3CM model to capture the water and ion density distributions is of great interest for many practical applications such as upscaling of the results to pore-level for reactive transport simulations in porous media. The f-DFT tool provides a more computationally economic way to achieve those goals because of its ability to model simple fluid systems of increased complexity, e.g. 3D systems not restricted to system size. The computational advantage of f-DFT allows researchers to execute rapid parametric studies (parameters: pore-size/solution concentration) and can bridge between atomistic and pore-level simulations.
Acknowledgments
The authors acknowledge financial support by the Marie Skłodowska-Curie Actions, MSCA-COFUND, PSI-FELLOW-II-3i grant agreement No. 701647. The atomistic simulations were performed using resources provided by the Swiss Center of Scientific Computing (CSCS) for High Performance Computing. The authors are grateful to Dr Michael Holmboe for discussions about the MD simulations and to Dr Pfingsten Wilfried for discussions on cation adsorption on mineral surfaces.
Compliance with Ethical Standards
Conflict of Interest
The authors declare that they have no conflict of interest.