Wide-bandgap semiconductor devices can have a strong impact on power system size, weight, and efficiency due to their ability to reduce the size of passive components and lessen thermal management requirements. Silicon (Si) is today the dominant semiconductor for power devices, but its material limitations have led the power electronics community to explore wide-bandgap semiconductors like silicon carbide (SiC), gallium nitride (GaN), diamond, and others.[Reference Millan, Godignon, Perpina, Perez-Tomas and Rebollo1, Reference Tsao, Chowdhury, Hollis, Jena, Johnson, Jones, Kaplar, Rajan, Van de Walle, Bellotti, Chua, Collazo, Coltrin, Cooper, Evans, Graham, Grotjohn, Heller, Higashiwaki, Islam, Juodawlkis, Khan, Koehler, Leach, Mishra, Nemanich, Pilawa-Podgurski, Shealy, Sitar, Tadjer, Witulski, Wraback and Simmons2] GaN has been one of the foci of power device research due to its wide direct-bandgap electronic structure, high critical electric field, and high electron mobility. These fundamental material properties lead to lower specific on-resistance (R on,sp) for a given blocking voltage, compared with Si.[Reference Tsao, Chowdhury, Hollis, Jena, Johnson, Jones, Kaplar, Rajan, Van de Walle, Bellotti, Chua, Collazo, Coltrin, Cooper, Evans, Graham, Grotjohn, Heller, Higashiwaki, Islam, Juodawlkis, Khan, Koehler, Leach, Mishra, Nemanich, Pilawa-Podgurski, Shealy, Sitar, Tadjer, Witulski, Wraback and Simmons2, Reference Hudgins, Simin, Santi and Khan3]
The performance of a semiconductor material for a power device is often judged by the Baliga figure-of-merit (BFOM; also known as the unipolar figure-of-merit, or UFOM):
 $$\displaystyle{{V_{\rm B}^2} \over {RR_{{\rm on,sp}}}} = \displaystyle{1 \over 4}\varepsilon \mu _{\rm n}E_{\rm C}^3 $$
The critical electric field (E C) is defined as the peak electric field that leads to avalanche breakdown in a one-dimensional model. It is strictly speaking defined for a linear electric field profile in a non-punch-through drift region and depends on doping and temperature. Avalanche breakdown is a combination of two competing processes: phonon scattering and impact ionization. Changes in temperature directly affect the phonon scattering component, leading to a positive dependence of avalanche breakdown voltage temperature. This temperature dependence is one way to determine whether or not breakdown is due to avalanche. E C and the impact ionization process are not well characterized for GaN,[Reference Baliga4, Reference Dickerson, Allerman, Bryant, Fischer, King, Moseley, Armstrong, Kaplar, Kizilyalli, Aktas and Wierer5] which leads to some uncertainty in the BFOM for GaN devices and is a topic of current research.
Historically, GaN has been used in lateral power devices such as the high-electron mobility transistors (HEMTs).[Reference Millan, Godignon, Perpina, Perez-Tomas and Rebollo1] GaN HEMTs are capable of high-frequency operation, though electric field management typically limits their rated hold-off voltage to 650 V.[Reference Jones, Wang and Costinett6] These devices do not have avalanche capability and do not recover if breakdown occurs. On the other hand, vertical devices are capable of taking full advantage of GaNs superior material properties.[Reference Kizilyalli, Edwards, Nie, Disney and Bour7] Vertical GaN (v-GaN) devices with potential for high-voltage operation and avalanche capability[Reference Kizilyalli, Edwards, Nie, Disney and Bour7–Reference Hu, Nomoto, Song, Zhu, Qi, Pan, Gao, Protasenko, Jena and Xing11] are now becoming available.
The reliability of v-GaN is less well characterized than that of traditional Si and SiC devices, especially under realistic operating conditions. Studies of reliability and degradation mechanisms of lateral GaN HEMTs are ongoing,[Reference del Alamo and Joh12–Reference Bahl, Kim, Fu, Sasikumar, Chatterjee and Pendrakhar15] but reliability data on v-GaN is lacking. Avogy performed initial reliability studies of v-GaN[Reference Kizilyalli, Bui-Quang, Disney, Bhatia and Aktas16] and Slobodyan et al. performed preliminary continuous hard-switching reliability studies of v-GaN diodes. For the latter study, stress voltage was de-rated due to thermal issues with the test set-up at that time.[Reference Slobodyan, Sandoval, Flicker, Kaplar, Matthews, van Heukelom and Atcitty17]
In this paper, we extend continuous switching stress-testing to higher voltages, which has been enabled by improvement of thermal management in the test set-up. All stress tests were performed on Avogy supplied model AVD05A120A v-GaN PiN diodes housed in a TO-220 package. The device structure was reported earlier by Avogy,[Reference Kizilyalli, Edwards, Aktas, Prunty and Bour18] consisting of epitaxially grown GaN layers on a native GaN substrate and floating guard rings for electric field management, as is illustrated in Supplementary Fig. S1. The devices have a DC blocking voltage rating of 1200 V and a forward current rating of 5 A. The 0.72 mm2 diode die yields a rated current density of 694 A/cm2. Due to the number of figures extracted from the data, only representative curves are reported here. Overall, four devices were tested: one to obtain temperature-dependent current–voltage (I–V) curves, and three for stress testing. Although not all of the devices have precisely the same initial characteristics, the trends observed during the stress interval are common to nearly all of the devices examined. More data, including the results for devices stressed at 500 and 750 V, is in the Supplementary Materials.
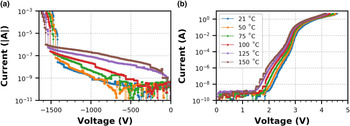
Prior to stress-testing, forward and reverse I–V curves were measured from room temperature to 150 °C in 25 °C steps (Fig. 1). The step-like jumps in current are an artifact of instrument current ranging. Both curves show expected behavior with temperature. Breakdown has a positive temperature coefficient and is both repeatable and non-destructive. These breakdown curves confirm the avalanche ruggedness of v-GaN PiN diodes shown previously.[Reference Kizilyalli, Edwards, Nie, Disney and Bour7, Reference Slobodyan, Sandoval, Flicker, Kaplar, Matthews, van Heukelom and Atcitty17, Reference Kizilyalli, Edwards, Aktas, Prunty and Bour18]
v-GaN PiN diode temperature-dependent (a) reverse and (b) forward I–V curves.

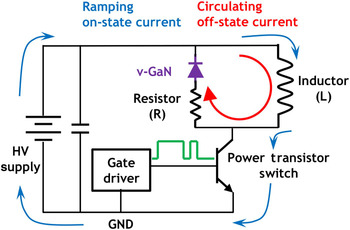
To perform continuous-switching reliability testing, we utilized a modified double-pulse test circuit (DPTC). While the DPTC is usually used to characterize switching of inductively loaded power transistors, it can also be operated in a steady state mode. Therefore, it is possible to use the DPTC for continuous device stressing, coupled with periodic characterization of switching performance. This modified DPTC setup used to perform continuous-switching reliability testing on the diode is illustrated in Fig. 2 and has been described in detail in previous publications.[Reference Matthews, Flicker, Kaplar, van Heukelom, Atcitty, Kizilyalli and Aktas19] The setup in this work added forced air cooling to the v-GaN diode under test to provide thermal management during stress-testing and prevent thermally driven degradation mechanism that would not be present in an end-use application with proper heat-sinking.
Circuit diagram including lumped parasitic resistance, R, in the free-wheeling loop.

In an idealized analysis of a DPTC, all elements are lossless. However, a real circuit has lossy elements that can be represented by a lumped resistance in the free-wheeling loop (represented by a resistor, R, in Fig. 2). This lossy element causes the switch and diode current to saturate. Current saturation makes realistic DPTC useful for continuous reliability testing. The gate driver provides the signal to operate the power transistor switch. When the switch is on (closed), the diode is reverse biased. The inductor current ramps up linearly and flows around the main circuit loop (blue arrows in Fig. 2). The change in current through the inductor, ΔL, is related to the switch on time, t on, by Eq. (2):
 $$t_{{\rm on}} = \displaystyle{{{\rm \Delta} I_{\rm L}\cdot L} \over {V_{{\rm in}}}}$$
When the switch is off (open), the diode is forward biased and current circulates through the free-wheeling loop (red arrow in Fig. 2) following Eq. (3):
 $$I_{\rm L}(t) = I_{{\rm L,max}}\cdot {\rm e}^{-(R/L)t}$$
The time t off needed for the loop current to decay to its initial value, as required to satisfy steady state operation, is given by Eq. (4):
 $$t_{{\rm off}} = -\displaystyle{L \over R}\ln \left( {1-\displaystyle{{t_{{\rm on}}\cdot V_{{\rm in}}} \over {L\cdot I_{{\rm max}}}}} \right)$$
To characterize the reliability of the v-GaN diodes under test, the DPTC is operated in this steady state mode. The diode static and transient characteristics are evaluated periodically via I–V curve sweep and traditional double-pulse characterization mode.
In double-pulse characterization mode, which is the traditional operation mode of the DPTC, two pulses are used as a tool to characterize switching transients of a device. The first gate pulse increases the stored energy in the inductor, effectively “charging up” the circuit to a quasi-steady state. When the gate is turned off, the current circulates through the diode/inductor free-wheeling loop. The second gate pulse is used to characterize the switching transients. The diode current gives a measure of reverse recovery, and was previously used by Matthews et al. to compare the switching characteristics of v-GaN to SiC and Si devices.[Reference Matthews, Flicker, Kaplar, van Heukelom, Atcitty, Kizilyalli and Aktas19] Pre-stress and final post-stress double-pulse traces of all tested devices are included in the Supplementary Materials. Nearly identical pre- and post-stress traces indicate minimal degradation in the switching characteristics of the device.
During continuous stress-testing, the DPTC is operated in steady state mode. For proper operation, the duty cycle of the gate driver must be chosen so the recirculating current in the free-wheeling loop decays to its initial value, as shown in Eq. (4). Otherwise, the diode current increases every switch cycle in a “runaway” effect causing catastrophic device failure due to overcurrent. The test circuit utilized three 1 mH inductors connected in series and no external resistance (i.e., the lumped resistance shown in Fig. 2 was parasitic). The pulse t on was chosen to be 2 µs and t off was 998 µs to prevent current runaway, giving a duty cycle of 0.2%. From Eqs. (2)–(4), this implies the parasitic resistance in the free-wheeling loop is at least 1 Ω. The parameters for steady state stress operation of the DPTC involve a switching stress applied for 720 min at each of the following supply voltages: 500, 750, and 1000 V.
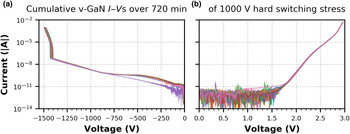
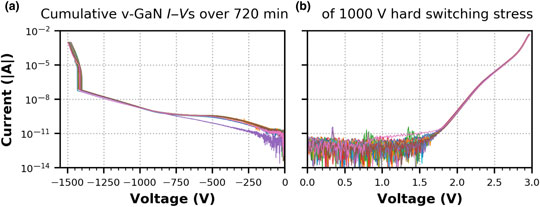
Separate forward and reverse I–Vs were collected over the stress duration, starting prior to stress and then at 20-min intervals. Figure 3 shows all I–V curves measured over 720 min of stress for the device stressed at 1000 V. The forward I–Vs are nearly identical except for the final measurement. The initial and final reverse I–Vs nearly overlie each other up to breakdown. An increase in leakage current between 0 and −750 V is observed to occur following the initial stress period, which then stabilizes. In addition, the avalanche breakdown voltage decreases slightly as a function of stress time. The change in reverse leakage after the initial stress period suggests that two transport mechanisms may be active, with carrier trapping possibly playing a role. While the final 720-min I–Vs of devices stressed at 500 and 750 V were taken immediately after stress measurements (see Supplementary Fig. S2 and S6), an additional curve was taken for the 1000 V stress case a day after stressing ended. The 1000 V curve showed leakage recovered close to its initial value. This suggests that some of the effects of stress are reversible if the device is given adequate time to recover and may be related to carrier trapping as mentioned above.
Cumulative (a) reverse and (b) forward I–Vs over the full duration for the device stressed at 1000 V. All curves nearly overlap except for the pre-stress curves.

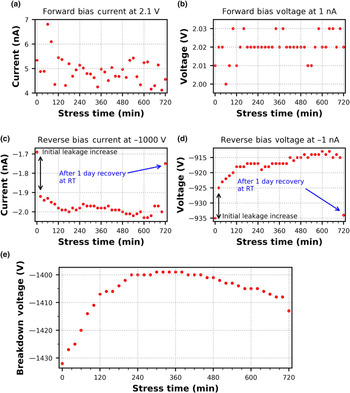
To better visualize the effects of stress on device performance, time-dependent I–V curves were sampled at fixed voltage and current to see how current and voltage vary with time at a fixed value. Figures 4(a) and 4(b) show the results of sampling of forward I–Vs at 2.1 V and 1 nA. A 2.1 V was chosen because it is close to the turn-on voltage, and 1 nA was chosen to characterize the behavior of the forward current at lower forward voltage while simultaneously avoiding the noise floor. Both the forward current at 2.1 V and forward voltage at 1 nA display very little variation with stress time. This indicates that stress has little effect on device performance in the forward bias.
Forward bias (a) leakage current at 2.1 V and (b) voltage variability at 1 nA for the v-GaN stressed at 1000 V, reverse bias (c) leakage current at −1000 V and (d) voltage variability at −1 nA, and (e) breakdown voltage versus stress time for the v-GaN stressed at 1000 V.

As with the forward I–Vs, the reverse I–V curves were sampled over the stress duration. Figures 4(c) and 4(d) plot the sampling done at −1 nA and −1000 V. At −1000 V, there is an initial ~0.25 nA increase in leakage current after the device is stressed. This is followed by a slower ~0.1 nA total increase over 720 min of stress. Likewise, the voltage at −1 nA increases by 10 V after the initial stress period, then steadily increases another 10 V over 720 min. The leakage current in the reverse bias may be associated with trap states in the band gap, which leads to higher Shockley–Read–Hall recombination current.[Reference Baliga4] The initial increase of leakage current may indicate that trap states are quickly filled with application of stress. Further stress on the device does not dramatically affect the population of trap states, indicating that few trap states are created after the initial application of stress. The final sample point, taken after 1 day of post-electrical stress relaxation, returns close to the initial value, suggesting that the trap states are emptied during the recovery period.
Breakdown voltage over the stress duration is plotted in Fig. 4(e). Breakdown was defined as the voltage at which the current exceeds −5 µA. Unlike the leakage current, there is no abrupt change in breakdown after the initial stress period. Instead, there is a slow decrease in breakdown voltage from −1430 to −1400 V over 220 min, a stable plateau at −1400 V up to 440 min, and then an increase in breakdown voltage to −1408 V. The final sample point, taken after 1 day of relaxation from electrical stress, increases from −1408 to −1413 V. The difference in trends between leakage current and breakdown voltage implies that different mechanisms are behind each trend. Further studies are needed to clarify this difference.
In summary, we performed reliability studies of v-GaN PiN diodes. Using a DPTC in steady state operation, the devices were stressed with a 2 µs switching pulse. Stress voltages of 500, 750, and 1000 V were applied to three different devices over 720 min. Forward and reverse current–voltage curves were collected every 20 min during stress and were sampled to obtain trends in device behavior. I–V characteristics in the forward bias show no degradation. Leakage current in the reverse bias increases quickly under application of stress but does not change significantly as the devices are stressed further. Recovery to near the initial value is observed following 1 day of annealing at room temperature after stress, suggesting that trap states may be responsible for the observed changes in reverse leakage current.
Supplementary material
The supplementary material for this article can be found at https://doi.org/10.1557/mrc.2018.204.
Acknowledgments
The authors thank I. Kizilyalli and O. Aktas, both formerly of Avogy Inc., for providing the diodes studied in this work. The characterization work at Sandia was supported by the Energy Storage Program managed by Dr. Imre Gyuk of the DOE Office of Electricity, and the fabrication work at Avogy was supported by the SWITCHES program managed by Dr. Tim Heidel of ARPA-E. Sandia National Laboratories is a multi-mission laboratory managed and operated by National Technology and Engineering Solutions of Sandia (NTESS) LLC, a wholly owned subsidiary of Honeywell International Inc., for the U.S. Department of Energy's National Nuclear Security Administration under contract DE-NA0003525. The opinions expressed in this paper are solely those of the authors and do not represent the views or recommendations of NTESS.