INTRODUCTION
By-catch, the incidental capture of non-target species in fishing gear, has become a major issue in global fisheries management and conservation for the last 30 years (Kelleher, Reference Kelleher2005; Soykan et al., Reference Soykan, Moore, Zydelis, Crowder, Safina and Lewison2008). By-catch includes under-sized individuals of the target species and all size classes of non-target species that have no commercial value that are returned to the sea. By-catch mortality is of most concern for organisms that have slow growth (late maturity) and low reproductive rates (Hall et al., Reference Hall, Alverson and Metuzals2000; Soykan et al., Reference Soykan, Moore, Zydelis, Crowder, Safina and Lewison2008). Such organisms are typically defined as endangered, vulnerable or threatened species and include fish, birds, reptiles and mammals (Dayton et al., Reference Dayton, Thrush, Agardy and Hofman1995; Zollett, Reference Zollett2009; Harden & Williard, Reference Harden and Williard2012; IUCN, 2015). The issues related to the by-catch composition of mobile fishing gears (e.g. trawls and dredges) and some static gears such as long-lines have been studied extensively (Auster & Langton, Reference Auster, Langton and Benaka1999; Kelleher, Reference Kelleher2005; Lokkeborg, Reference Lokkeborg2005). In contrast, pot and trap fisheries have been little studied to date in relation to by-catch due to the general perception that the environmental effects of these fisheries is minor compared with other fishing gears (Eno et al., Reference Eno, MacDonald and Amos1996, Reference Eno, MacDonald, Kinnear, Amos, Chapman, Clark, Bunker and Munro2001). However, in Europe, there is now a move to ban discards of target species and as such it will be necessary for all fisheries to quantify and report their by-catches. For this reason there is an urgent need to gather evidence on the by-catch associated with all fisheries, including pot fisheries in the UK and more widely in Europe. In particular, it is important to report the amount of catches of quota species.
Pots are passive fishing gears that are used across the world and are used in both offshore and inshore fisheries of Alaska, NE America, Norway, UK and France (Gabriel et al., Reference Gabriel, Lange, Dahm and Wendt2005). In the UK, pots are used to catch brown crab Cancer pagurus, European lobster Homarus gammarus and common whelk Buccinum undatum (Gray, Reference Gray1995; Eno et al., Reference Eno, MacDonald, Kinnear, Amos, Chapman, Clark, Bunker and Munro2001). Pots are generally assumed to be environmentally friendly fishing gears due to their associated low energy use (compared with towed mobile fishing gear), low habitat impact (e.g. Eno et al., Reference Eno, MacDonald, Kinnear, Amos, Chapman, Clark, Bunker and Munro2001; Coleman et al., Reference Coleman, Hoskin, von Carlshausen and Davis2013), high selectivity (in terms of species and size) and high rate of live by-catch (Jennings & Kaiser, Reference Jennings and Kaiser1998; Furevik et al., Reference Furevik, Humborstad, Jørgensen and Løkkeborg2008). However, the loss of pots due to bad weather or interactions with other fisheries can lead to ‘ghost fishing’ and additional mortality for some species (Jennings & Kaiser, Reference Jennings and Kaiser1998; Bullimore et al., Reference Bullimore, Newman, Kaiser, Gilbert and Lock2001; Kaiser & Jennings, Reference Kaiser, Jennings, Hart and Reynolds2002; Kaiser, Reference Kaiser2014). Additionally, pots and traps can damage some sessile organisms such as corals, sponges and other benthos (Jenkins & Garrison, Reference Jenkins and Garrison2013).
Previous studies have shown that survey design (e.g. fishery dependent or fishery independent surveys), environmental factors (e.g. season, fishing areas, substratum type, animal behaviour) and fishery-specific factors (e.g. pot design, soaking time) can affect the estimated by-catch rate in pots and traps (Roosenburg & Green, Reference Roosenburg and Green2000; Brock et al., Reference Brock, Hawthorne, Ward and Linnane2007; Butler & Heinrich, Reference Butler and Heinrich2007; Hart & Crowder, Reference Hart and Crowder2011; Harden & Williard, Reference Harden and Williard2012; Page et al., Reference Page, Curran and Geer2013). These factors are important considerations when attempting to estimate the losses associated with by-catch in pot fisheries. Mitigation measures that reduce by-catch can be effective, such as the introduction of escape panels that allow undersized individuals and other species to leave pots (Brown, Reference Brown1982; Frusher & Gibson, Reference Frusher, Gibson, Buxon and Eayrs1998). Seasonal closures can also be used to alleviate the incidence of by-catch (Pascoe, Reference Pascoe1997; Harden & Williard, Reference Harden and Williard2012; Lewison et al., Reference Lewison, Wallace, Alfaro-Shigueto, Mangel, Maxwell and Hazen2013). Both measures require quantification of their effectiveness prior to implementation.
The present study focused on the Isle of Man pot fishery for which little information exists on composition of catches. While the study is specific to the Isle of Man, the pot fishery is very similar in its characteristics to other areas of the UK in terms of target species and potential by-catch. In the Isle of Man, brown crab Cancer pagurus, and European lobster Homarus gammarus are targeted using the same types of pots. Landings of both brown crab and European lobster have increased markedly over the last 20 years (crab landing has risen from 52 t in 1994 to 453 t in 2013, whereas lobster landing has risen from 3 t in 1993 to 41 t in 2013) (FAO, 2015). The main reasons for the increased landings are related to development of fishery technology (vessel design advances), increased pot effort, an extension of crustacean fisheries from inshore to offshore grounds, and increasing market demand. The pot fishing occurs around most of the island within 3 nm (with the possible exception of the NE coast), and out to the territorial sea boundary (12 nm) off the central-west and south-west coasts. The minimum landing size of brown crab and European lobster are 130 mm carapace width and 87 mm carapace length respectively. Pots are fitted with escape gaps (80 mm wide × 45 mm high) to reduce catches of undersized individuals. The typical soaking time is 1 or 2 days but can be longer during periods of poor weather conditions. There are no spatial or seasonal closures in the Isle of Man pot fishery.
In the Isle of Man, there are a diverse range of seabed habitats ranging from mud to sand and coarse sediments and biogenic reefs (horse mussel, maerl and seagrass beds) (Hinz et al., Reference Hinz, Murray, Gell, Hanley, Horton, Whiteley and Kaiser2010). As a result, assemblages of target and non-target species vary considerably within the territorial limits of the sea around the Isle of Man (Boyle et al., Reference Boyle, Kaiser, Thompon, Murray and Duncan2016). Consequently, any study of by-catch would need to encompass all those areas targeted by a particular fishery. The first objective of the present study was to determine non-target fish and invertebrate species composition in the Isle of Man pot fishery. The second objective was to quantify patterns in the spatial and temporal catch of these non-target species. Similarly, according to our hypothesis inshore areas would exhibit higher species dominance in comparison with the offshore areas due to the differences in habitat and environmental factors. Furthermore, it was hypothesized that crab number per pot would decrease with increased lobster number per pot because it was considered that lobsters predate brown crabs, thus there is the potential for inter-specific competition/predation to influence patterns in catch. The last objective was to highlight catches of species of conservation importance or those that might be relevant to the EU landings obligation.
MATERIALS AND METHODS
By-catch composition using fishery independent data (FID)
In the Isle of Man, near-shore sediments are predominantly fine sand, whilst offshore sediments are mainly categorized in four classes; coarse sands and gravel, fine sand, muddy sand and mud (Barne et al., Reference Barne, Robson, Kaznowska, Doody and Davidson1996; Craven et al., Reference Craven, Brand and Stewart2012). The deepest part of the sea is to the west of the Isle of Man, where a 100 m trough extends north-south, whilst the water is generally <50 m deep around the east part (Gowen et al., Reference Gowen, Tett, Kennington, Mills, Shammon, Stewart, Greenwood, Flanagan, Devlin and Wither2008). Bottom water temperature peaks in September while March is the coldest month (Öndes et al., unpublished). The waters to the west of the Isle of Man are strongly stratified in the summer and autumn (Öndes et al., Reference Öndes, Kaiser, Murray and Torres2016). There are currently no seasonal closures that affect pot fisheries in the Isle of Man.
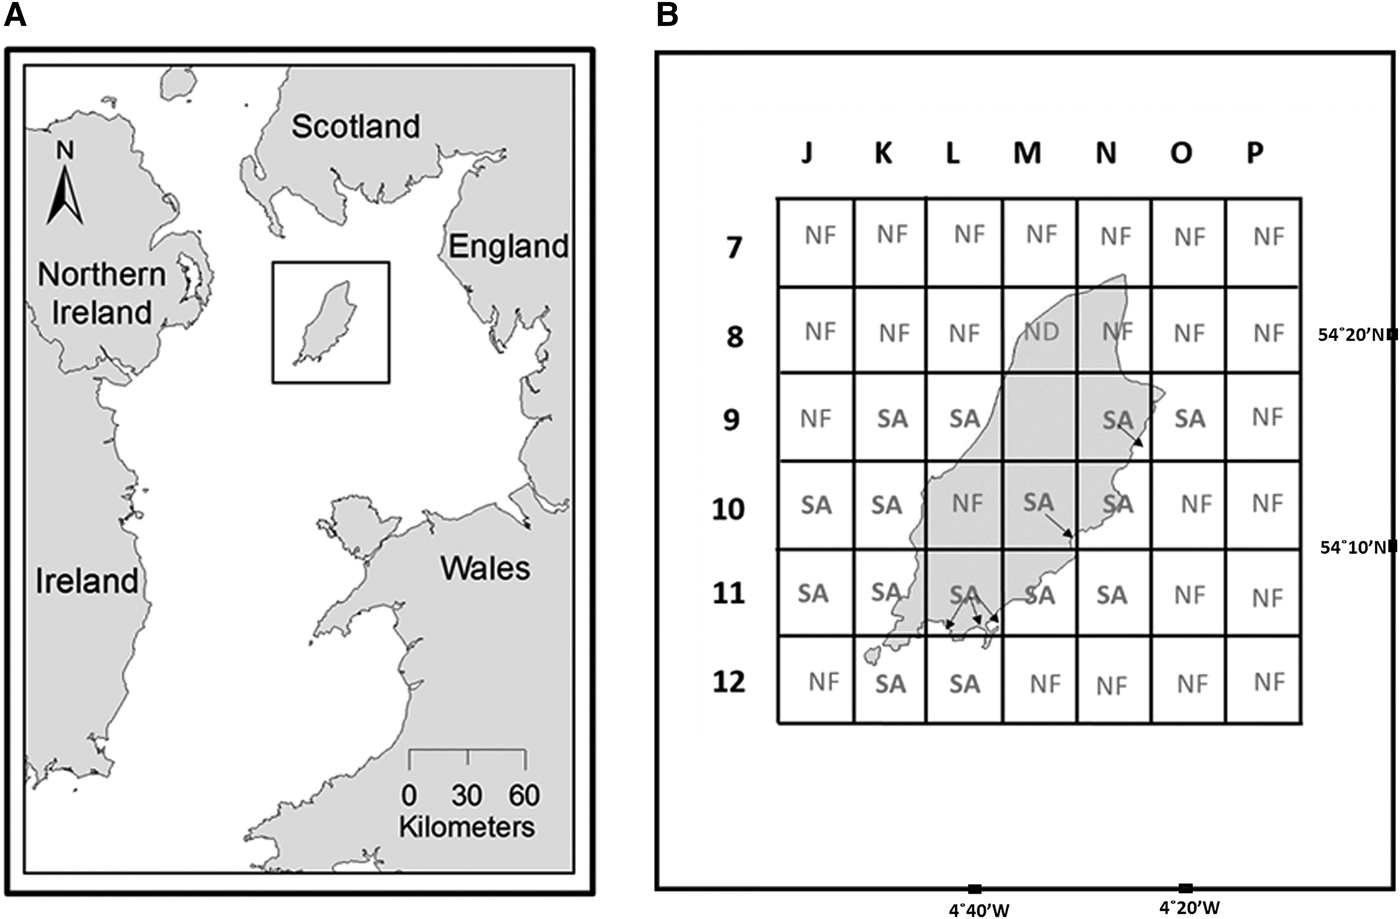
To assess the seasonal and spatial variations in catch of non-target species in the pot fishery, the surveys were conducted seasonally between spring 2012 and summer 2013 on the main fishing grounds for the brown crab around the Isle of Man, Irish Sea (Figure 1A, B). All samples were collected by commercial fishing boats thus the surveys represent the Isle of Man pot fishing sector in terms of actual soaking time, sampling areas, depth, pot size and used bait. During the sampling period, fishermen were using standard traps (steel framed parlour pots). Pot volume was variable among fishermen (0.11, 0.12, 0.14, 0.17 and 0.20 m3). Commercial fishing pots, which were fitted with mandatory escape gaps (80 mm wide × 45 mm high), were lifted across depths ranging between 2 and 65 m. Soaking time varied from 24 to 288 h, but the typical soaking time was 24 or 48 h. The pots were mainly baited with small-spotted catshark, cod, haddock, herring and pollack. In some seasons, the extent of the area over which fishing occurred was reduced due to limited fishing activity and bad weather. The hauled pot numbers were 184, 685, 660, 316, 136 and 508 respectively in each of the sampling seasons (spring 2012, summer 2012, autumn 2012, winter 2012, spring 2013 and summer 2013). Around the north coast of the island there were no active pot fishermen which is related to the unsuitable tidal conditions which are too strong for the use of pots. To provide spatial and temporal comparisons of catch ratio, data were standardized to reporting areas of ~75 km2 using the grid squares, which subdivide the 37E5 (ICES) rectangle (Figure 1B). Individual fishing locations were recorded using GPS during the surveys.
(A) Location of the Isle of Man in the northern Irish Sea (ICES subdivision VII A); (B) study area subdivided into 42 areas of ~75 km2 with reference grid. Grid showing alpha-numeric coordinates for ICES statistical rectangle 37E5. NF; no commercial fishing using pot gear; ND, no data; SA, sampling area. The no-fishing areas were defined from the questionnaire study undertaken by Whiteley (Reference Whiteley2009) and DEFA (2013). Number of sampling (string number) per grid; J10: 14, J11: 8, K9: 16, K10: 29, K11: 25, K12: 14, L9: 7, L12: 22, M11: 21, N9: 14, N10: 34, N11: 13, O9: 26.

During the fieldwork, both target and non-target species were quantified aboard the fishing vessels during 12 sampling trips. All by-catch species were identified (to species level when possible). Lobster and brown crabs were not counted as part of the by-catch. Subsamples of by-catch species were collected to assess mean body-size. Animals were measured for total length (fish), carapace length or width (crabs), carapace length with rostrum (lobsters), total shell length (gastropods and bivalves), mantle length (cephalopods) and diameter (echinoderms) (Tonks et al., Reference Tonks, Griffiths, Heales, Brewer and Dell2008).
Local ecological knowledge (LEK)
Local ecological knowledge (LEK) was collected through the use of face-to-face questionnaires in July 2013. Interviews were undertaken with fishermen who were owners of fishing vessels and who actively fished brown crab and lobster. A total of 10 fishermen out of a population of 25 were interviewed which represented 40% of all active pot fishermen. The questionnaires were used to collect information on the by-catch species in the pots, the seasonal patterns of by-catch species, and the peak seasons for by-catch composition in the Isle of Man. The questionnaire form included the common name of potential non-target species with photographs to aid identification.
Environmental data
In addition to the pot by-catch survey data, marine environmental data for the year 2008 around the Isle of Man (Figure 1B) was obtained from Bangor University (Murray et al., Reference Murray, Hinz and Kaiser2009; Lambert, Reference Lambert2011). The data included bottom water temperature, chlorophyll-a in the sediment, seasonal chlorophyll-a in the water column, sediment grain-size, kurtosis, PEA (potential energy anomaly) (Murray et al., Reference Murray, Hinz and Kaiser2009) and bed shear stress (Lambert, Reference Lambert2011). From these data-layers, the mean values of each of these environmental variables were calculated for each statistical areas defined in Figure 1B. Although there is a mismatch between the year in which these data layers were generated and the collection of the by-catch data, they represent the most comprehensive spatial data for the environmental variables.
By-catch per unit effort (BPUE)
The number of by-catch species per unit effort (BPUE) was calculated using equation (1) and standardized to numbers of animals per 100 pots.
 $${\rm BPUE} = \displaystyle{{\hbox{total individuals per string of pots}} \over {\hbox{total number of pots per string}}} \times 100 $$
Data analyses
To test all data for normality and homogeneity of variance, a Kolmogorov–Smirnov K–S test and Levene's test were used respectively (Field, Reference Field2005; Becerra-Jurado et al., Reference Becerra-Jurado, Cruikshanks, O'Leary, Kelly, Poole and Gargan2014) and either parametric or non-parametric tests were applied accordingly. Spatial and seasonal trends in the BPUE of species were examined using the Kruskal–Wallis test. A pairwise comparison technique was used to test for seasonal and spatial differences in the mean BPUE of the most abundant by-catch species. A linear regression was used to test the relationship between BPUE and soaking time. As lobsters and brown crab are predators, the number of these animals within a trap may determine the likelihood of trap entry of other incidentally caught species. A quantile regression (75th) was used to test the relationship between the number of crabs per pot and lobster per pot. A quantile regression (75th) was also used to test the relationship between the number of target species (crabs and lobsters) per pot and the total number of by-catch species per pot.
To understand patterns in the ‘community’ of animals retained in pots a multivariate analysis approach was used to examine similarities in by-catch composition with location. The mean BPUE of species per statistical area (averaged across seasons) was square root transformed and a resemblance matrix calculated using the Bray–Curtis index of similarity. The resemblance matrix was used to generate a dendrogram and MDS ordination plot to show the relative similarity between catch compositions with location. The DIVERSE programme (Univariate Diversity Indices) was used to calculate summary community metrics in terms of number of species, Shannon–Wiener diversity index, Simpson diversity. Autocorrelation among environmental factors was examined and resulted in the removal of depth and bottom salinity from further analyses. The BEST analysis, which was defined as the linking of multivariate biotic patterns to suites of environmental variables (Clarke & Gorley, Reference Clarke and Gorley2006), was used to explore which environmental variables (bottom water temperature, chlorophyll-a in the sediment, seasonal chlorophyll-a in the water column, sediment grain-size, kurtosis, PEA) contribute most to any patterns observed within the data. K-dominance curves were plotted for by-catches for inshore (<28 m water depth) and offshore stations (Beukers-Stewart et al., Reference Beukers-Stewart, Vause, Mosley, Rossetti and Brand2005) to see if patterns in by-catch composition differed for these two areas. In this study, J10 and J11 represented the offshore areas, the other sampling stations were defined as inshore areas based on Beukers-Stewart et al. (Reference Beukers-Stewart, Vause, Mosley, Rossetti and Brand2005) (Figure 1B, Table 1). For inshore areas, Spearman's rank correlation was used to test the relationships among mean bottom temperature (BT) and variables: number of species (S) and Shannon-Wiener diversity index (H′ (loge)). Statistical analyses were carried out using Primer v.6, SPSS v.20 and STATA v.11.
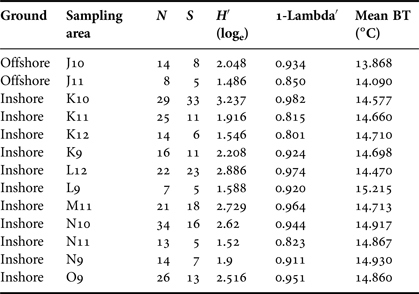
Results of DIVERSE (Univariate Diversity Indices) analysis related to spatial trends in BPUE (indiv. 100 pots−1).

N, sample size (number of sampling (string number)); S, number of species; H′ (loge), Shannon–Wiener diversity index; 1-Lambda′, Simpson diversity and environmental variable; BT (mean bottom temperature), which exhibited the best fit. For inshore areas, Spearman's rank correlation shows the relationships among Mean BT and variables: S (r = −0.61, P = 0.05), H′ (loge) (r = −0.54, P = 0.09).
RESULTS
By-catch composition using fishery independent data (FID)
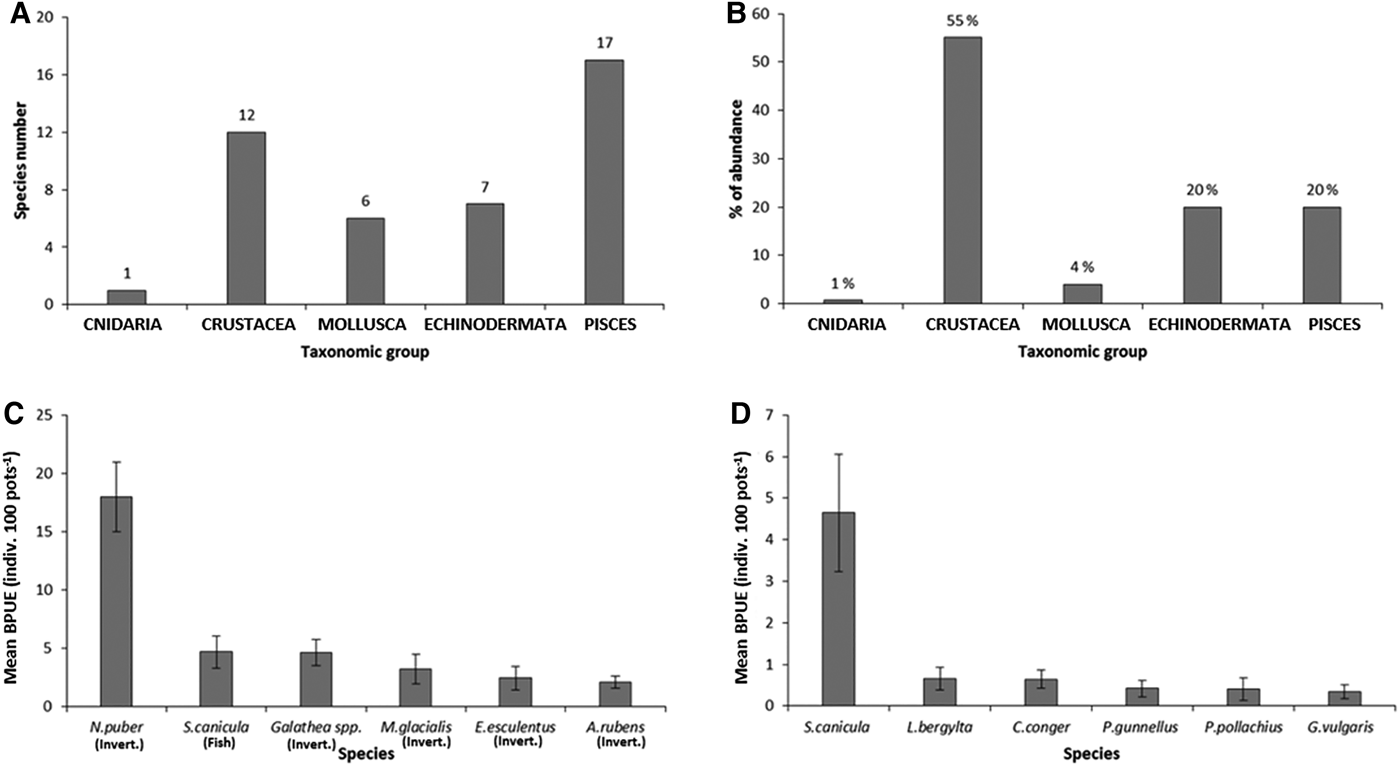
In total, 2489 pots were lifted within which a total of 17 fish species (220 specimens) and 26 invertebrate species (868 specimens) were caught (Figure 2A, Appendix 1). The by-catch of fishes accounted for the highest number of species and crustaceans were the most abundant group, accounting for 55% of the total number of animals retained by pots (Figure 2B). Velvet swimming crab (Necora puber) was the most commonly observed species, accounting for 34% in number of all by-catch species, and had a mean BPUE (±SE) of 17.56 ± 2.82 indiv. 100 pots−1. Small spotted catshark Scyliorhinus canicula and squat lobster Galathea spp. were the next most commonly caught by-catch species, with a mean BPUE of 4.65 ± 1.41 and 4.58 ± 1.13 indiv.100 pots−1 respectively. Other invertebrate species (spiny starfish Marthasterias glacialis, European edible sea urchin Echinus esculentus and common starfish Asterias rubens) had lower mean BPUE values (Figure 2C). The most common fish species retained in the pot gear were determined as small-spotted catshark Scyliorhinus canicula, ballan wrasse Labrus bergylta, European conger Conger conger, butterfish Pholis gunnellus, pollack Pollachius pollachius and rockling Gaidropsarus vulgaris (Figure 2D). Mean BPUE (±SE) of total by-catch was 46.50 ± 4.46 indiv. 100 pots−1. The mean BPUE was not significantly affected by soaking time (Linear regression, r = 0.153, P = 0.12).
(A) By-catch composition by major taxonomic group and number of species; (B) % abundance of by-catch species according to their taxonomic groups; (C) Mean BPUE (±SE) of the six most abundant species (fish and invertebrates); (D) Mean BPUE (±SE) of the six most abundant fish species.

Spatial variation
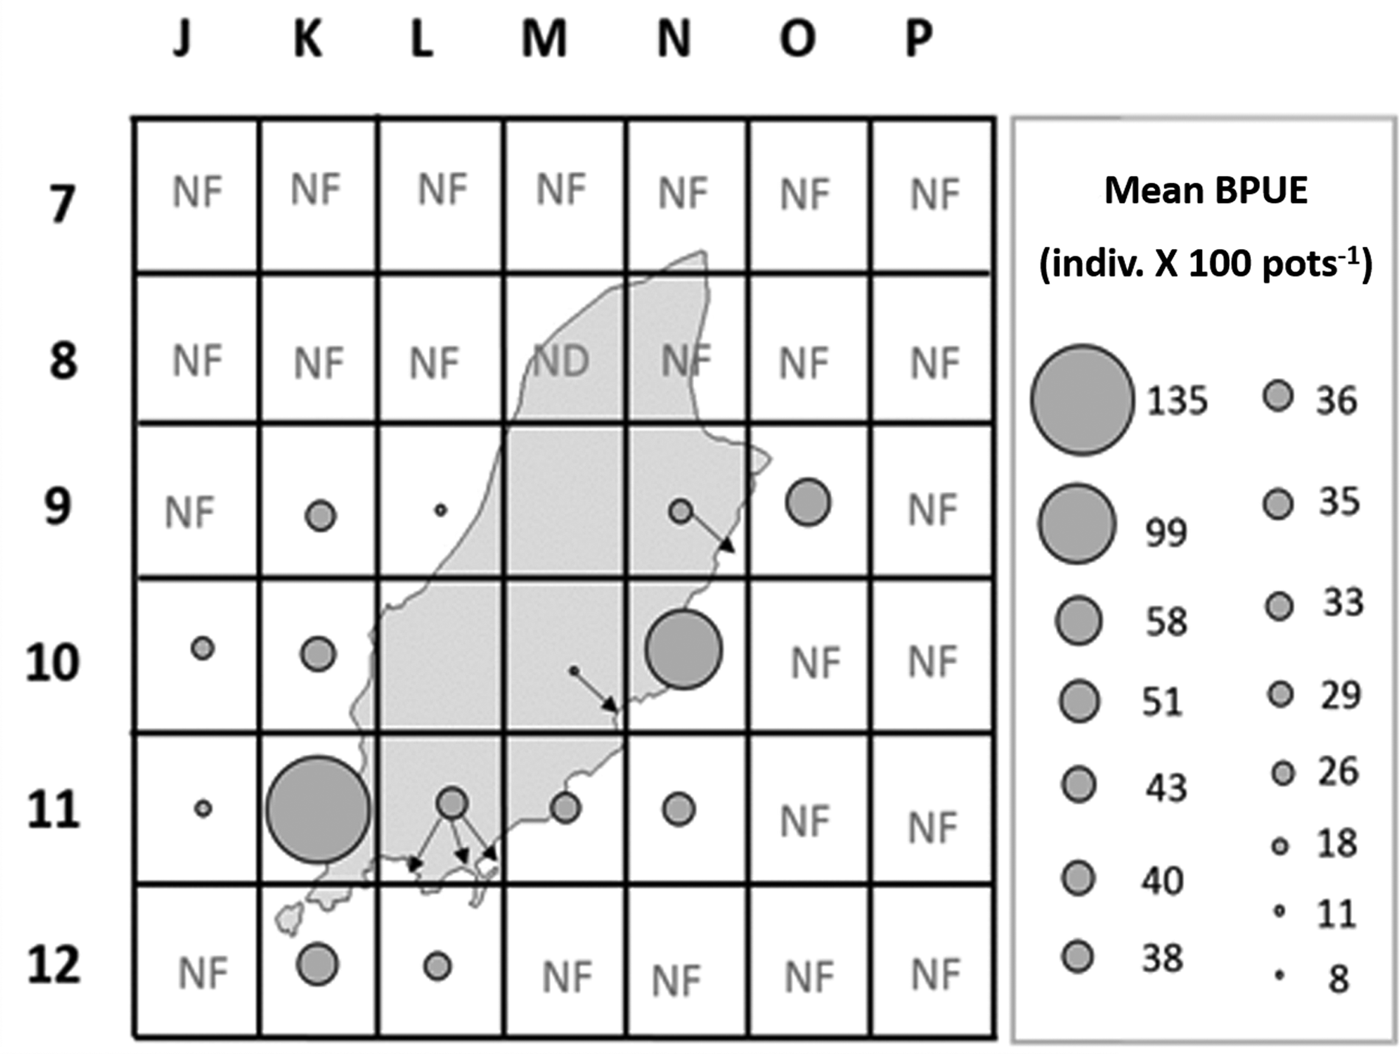
There was considerable spatial variation in the mean BPUE of the total by-catch per pot (Kruskal–Wallis, Chi-square = 26.65, df = 14, P = 0.02). The highest mean (±SE) BPUE was recorded in area K11 with 135 ± 96 indiv. 100 pots−1, whilst the lowest value was in area M10 with 8 ± 8 indiv. 100 pots−1 (Figure 3).
Mean BPUE for all by-catch species in each of the sampling areas. NF, no commercial fishing using pot gear; ND, no data.

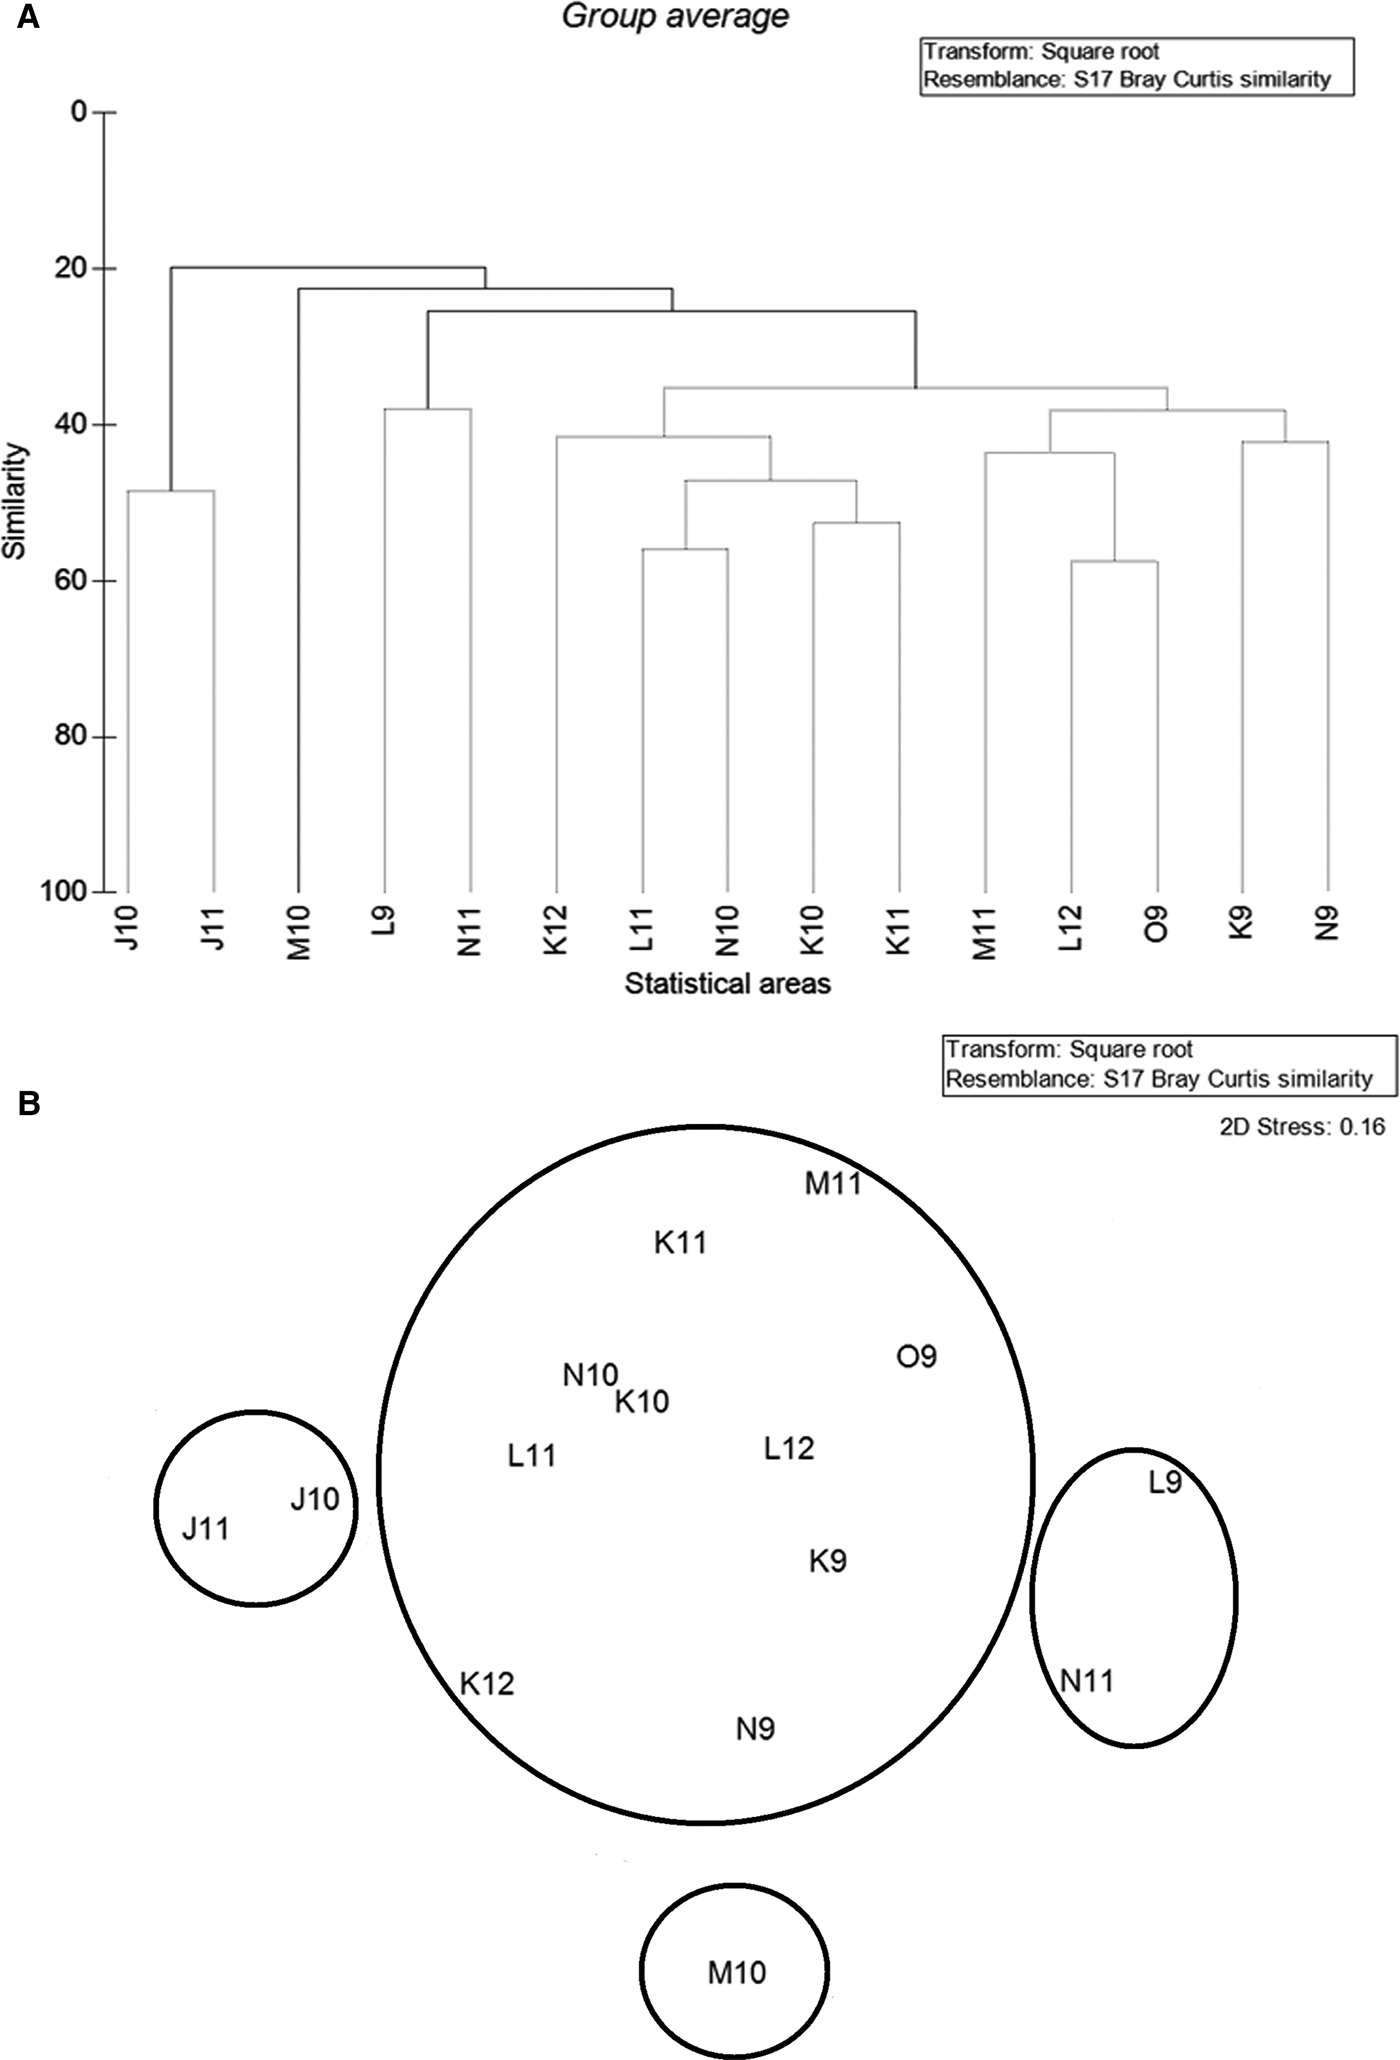
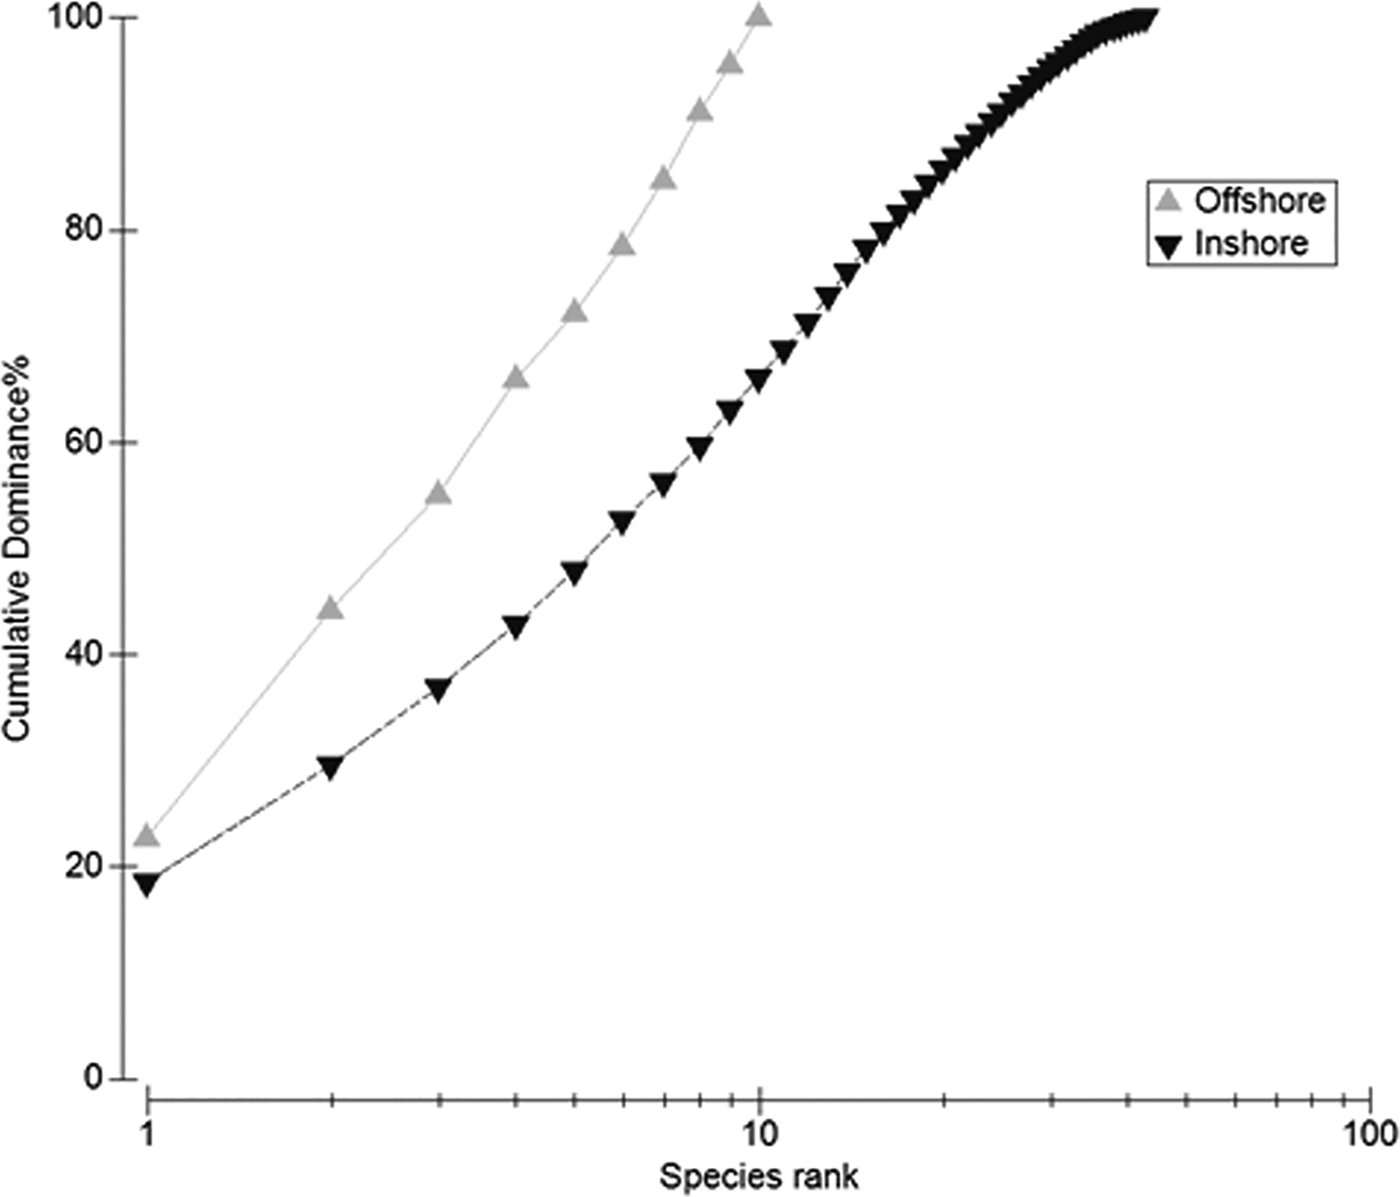
The dendrogram and MDS shown in Figure 4 illustrates the similarity between the statistical areas in terms of mean BPUE of species. The offshore and inshore areas showed a difference in terms of species dominance (Figure 5). Table 1 shows the results of the DIVERSE analysis. According to the BEST analysis, bottom temperature was the best explanation of the observed differences in catch composition in pot gear among different statistical areas (rho = 0.43).
(A) Dendrogram and (B) MDS ordination plot showing the similarity in by-catch composition for each of the different sampling areas for standardized pot catch data. The offshore stations are J10 and J11, whilst inshore stations are K9, K10, K11, K12, L9, L12, M11, N9, N10, N11 and O9. The data were derived from 2489 hauled pots.

Cumulative K-dominance curves for all by-catch (mean BPUE) species in offshore (J10 and J11) and inshore (other sampling areas) stations.

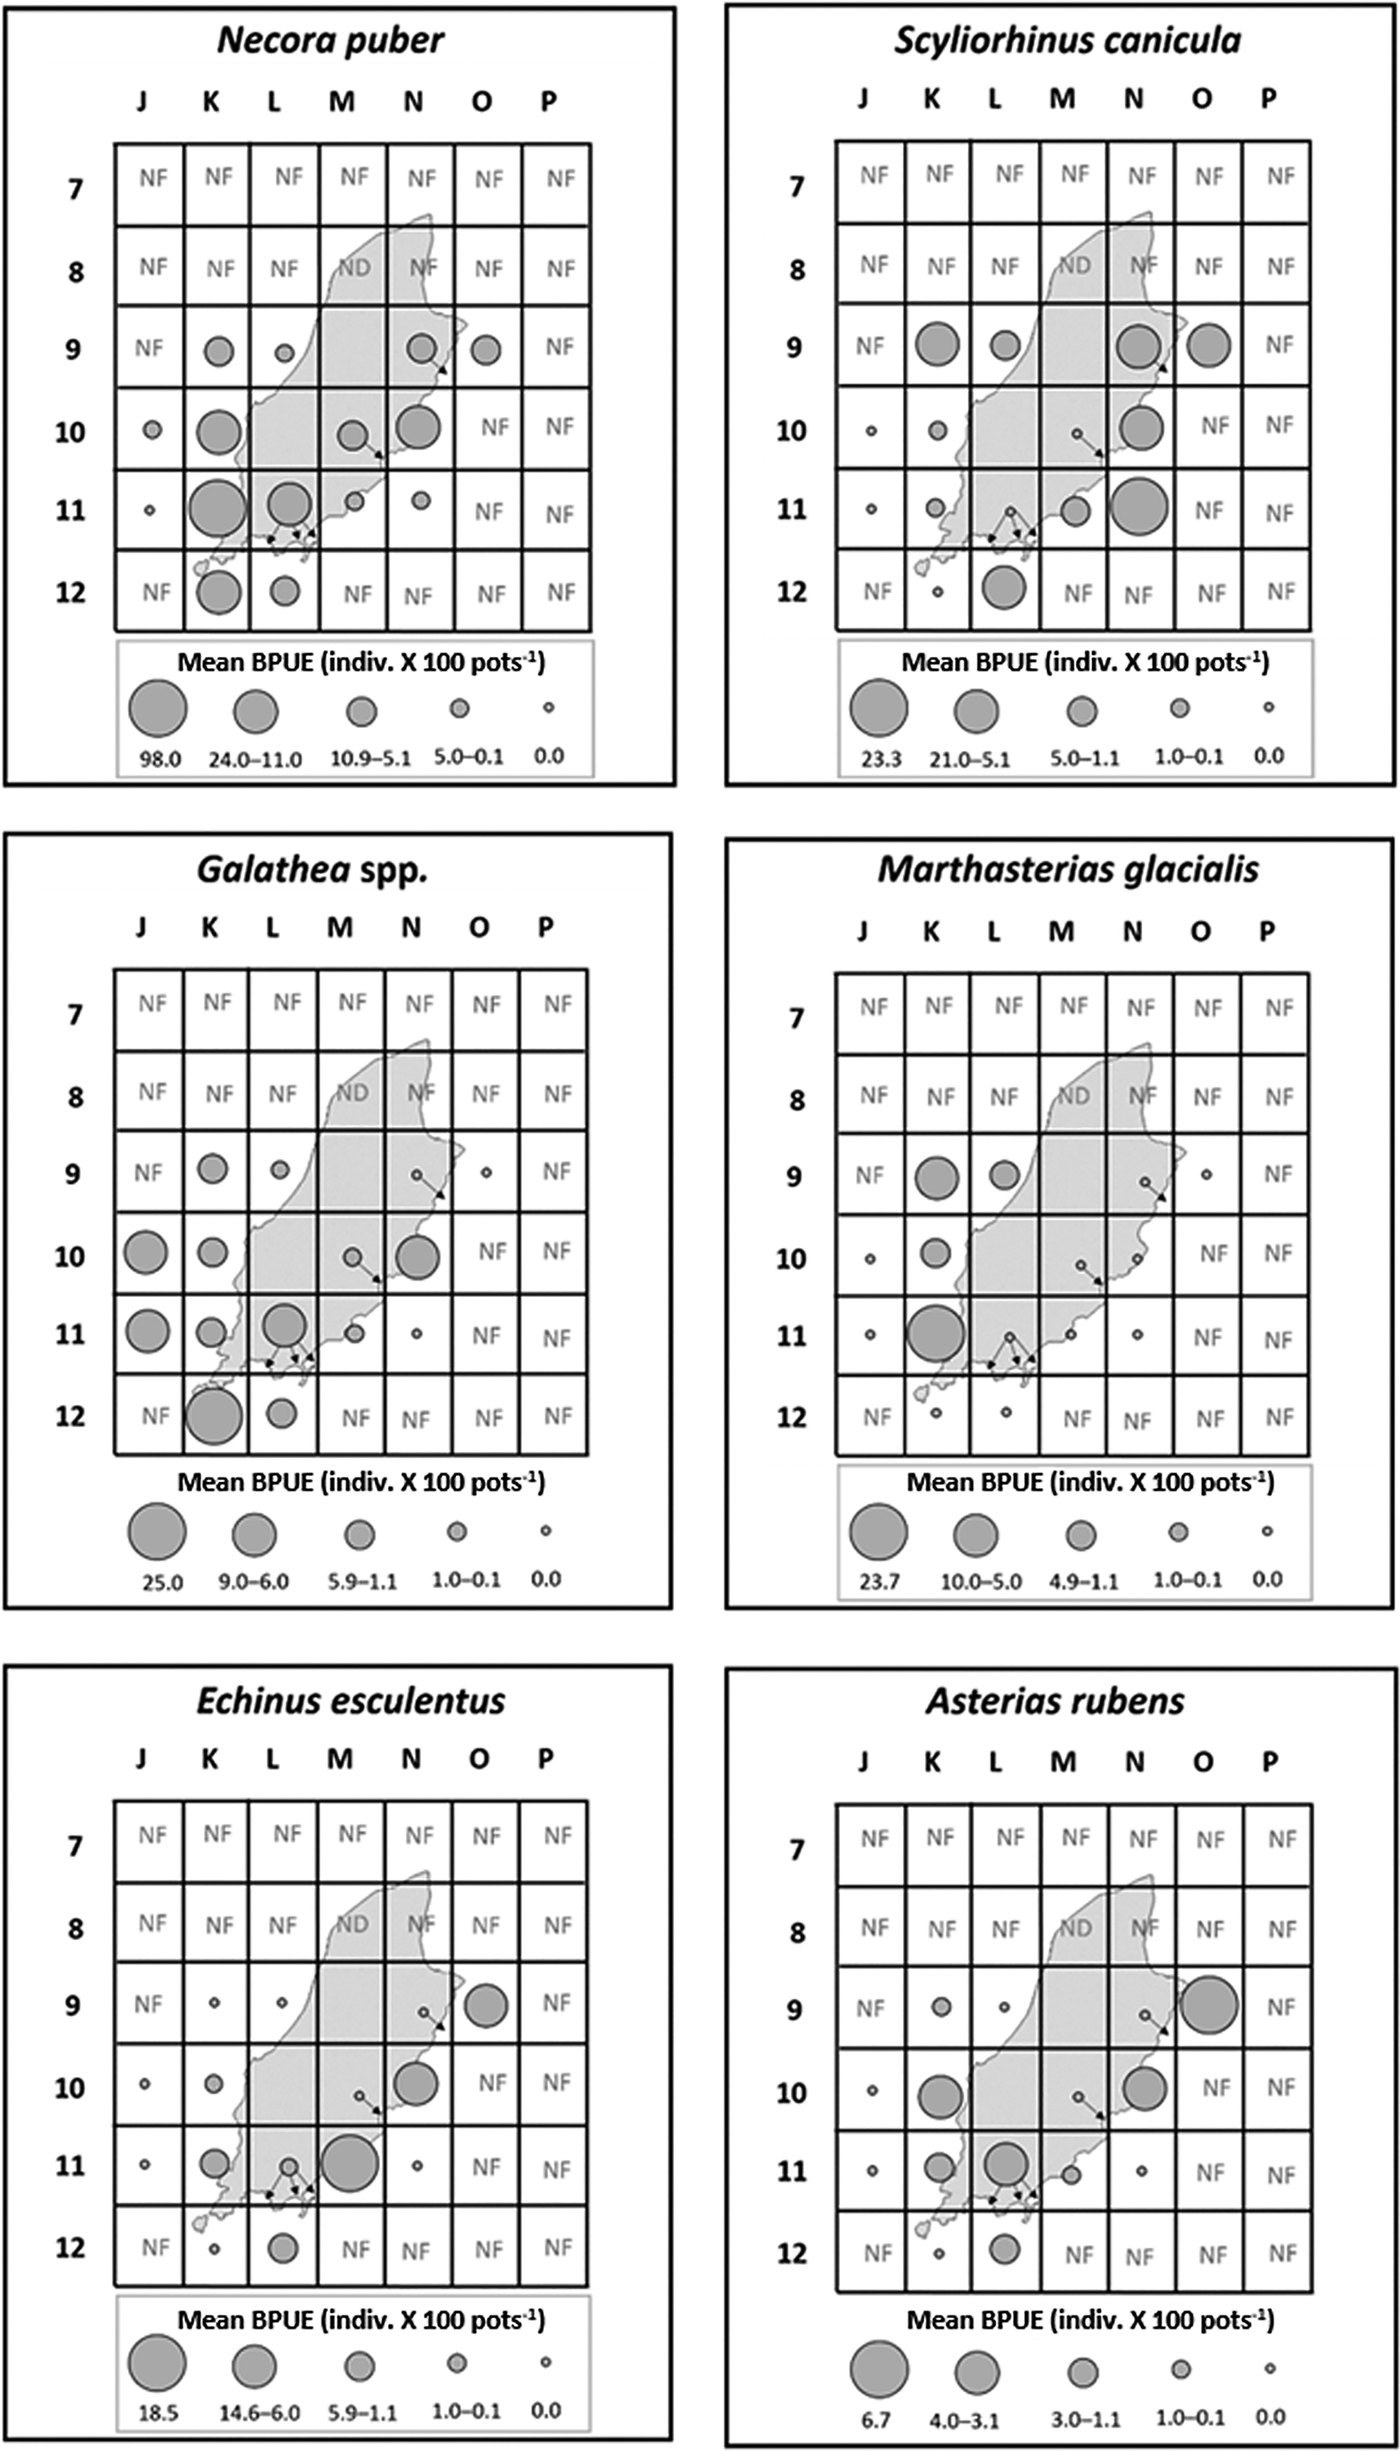
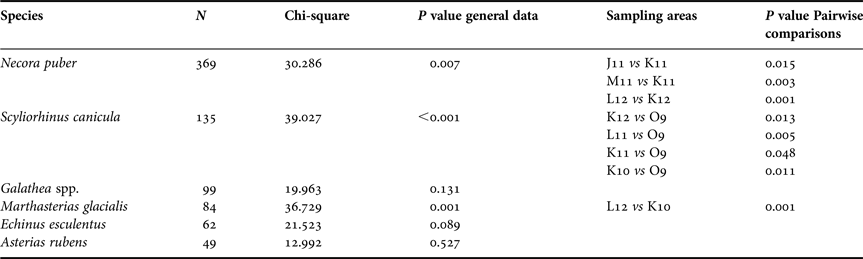
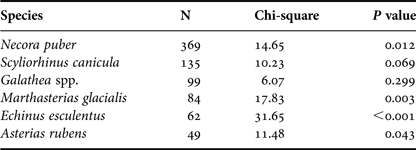
The most abundant six by-catch species exhibit the spatial variations in BPUE (Figure 6). Among them, M. glacialis exhibited high BPUE values around the west coast of the island, whereas E. esculentus mainly showed the highest mean BPUE values around the east coast. There were statistically significant differences between sampling areas and the BPUE of N. puber, S. canicula and M. glacialis, whilst there were no significant differences for Galathea spp., E. esculentus and A. rubens (Table 2).
Spatial differences in mean BPUE of the six most abundant species (N. puber, S. canicula, Galathea spp., M. glacialis, E. esculentus and A. rubens). NF, no commercial fishing using pot gear; ND, no data.

Spatial differences of the mean BPUE of the six most abundant species using the Kruskal–Wallis test (df = 14). Pairwise comparisons of the mean CPUE for the different sampling areas for the six most abundant by-catch species.

N, number of individuals.
Seasonal variation
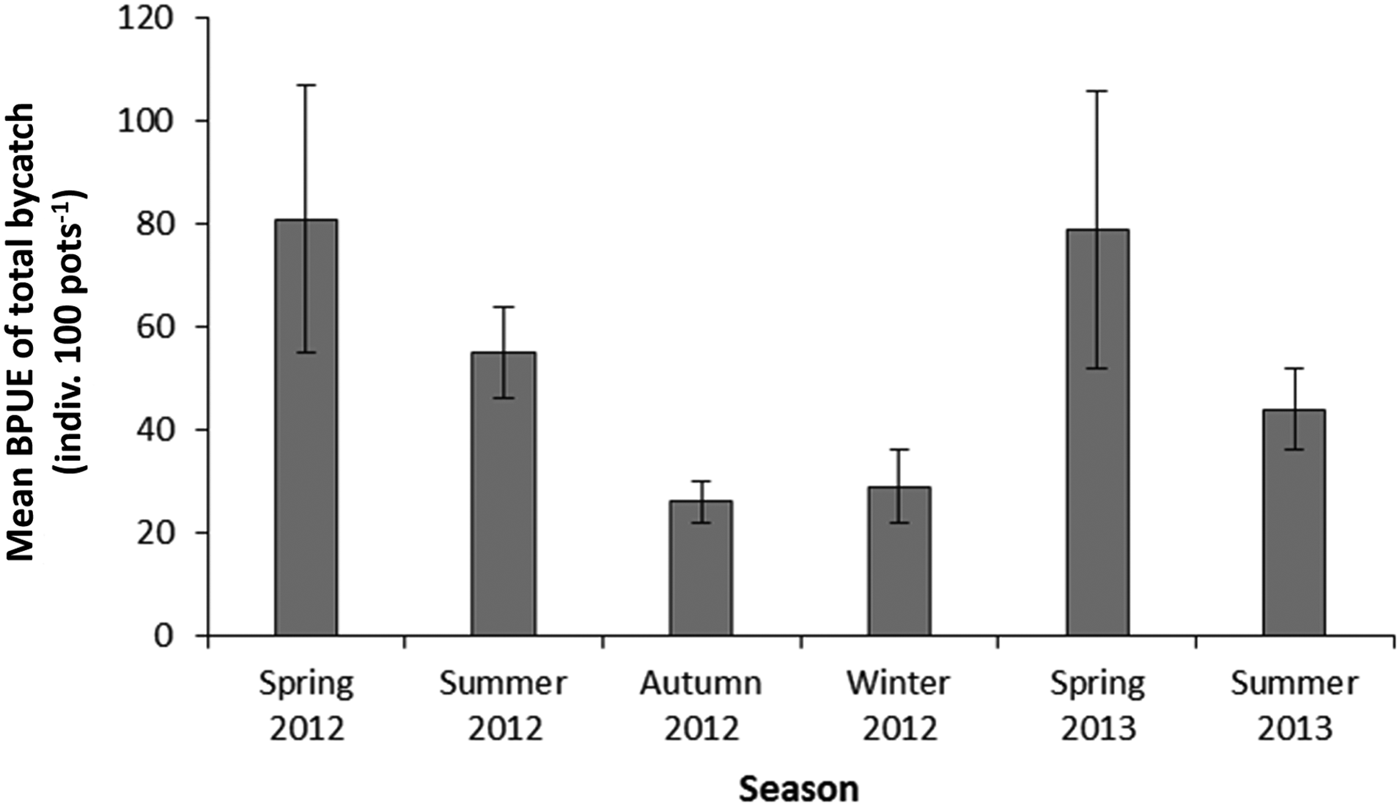
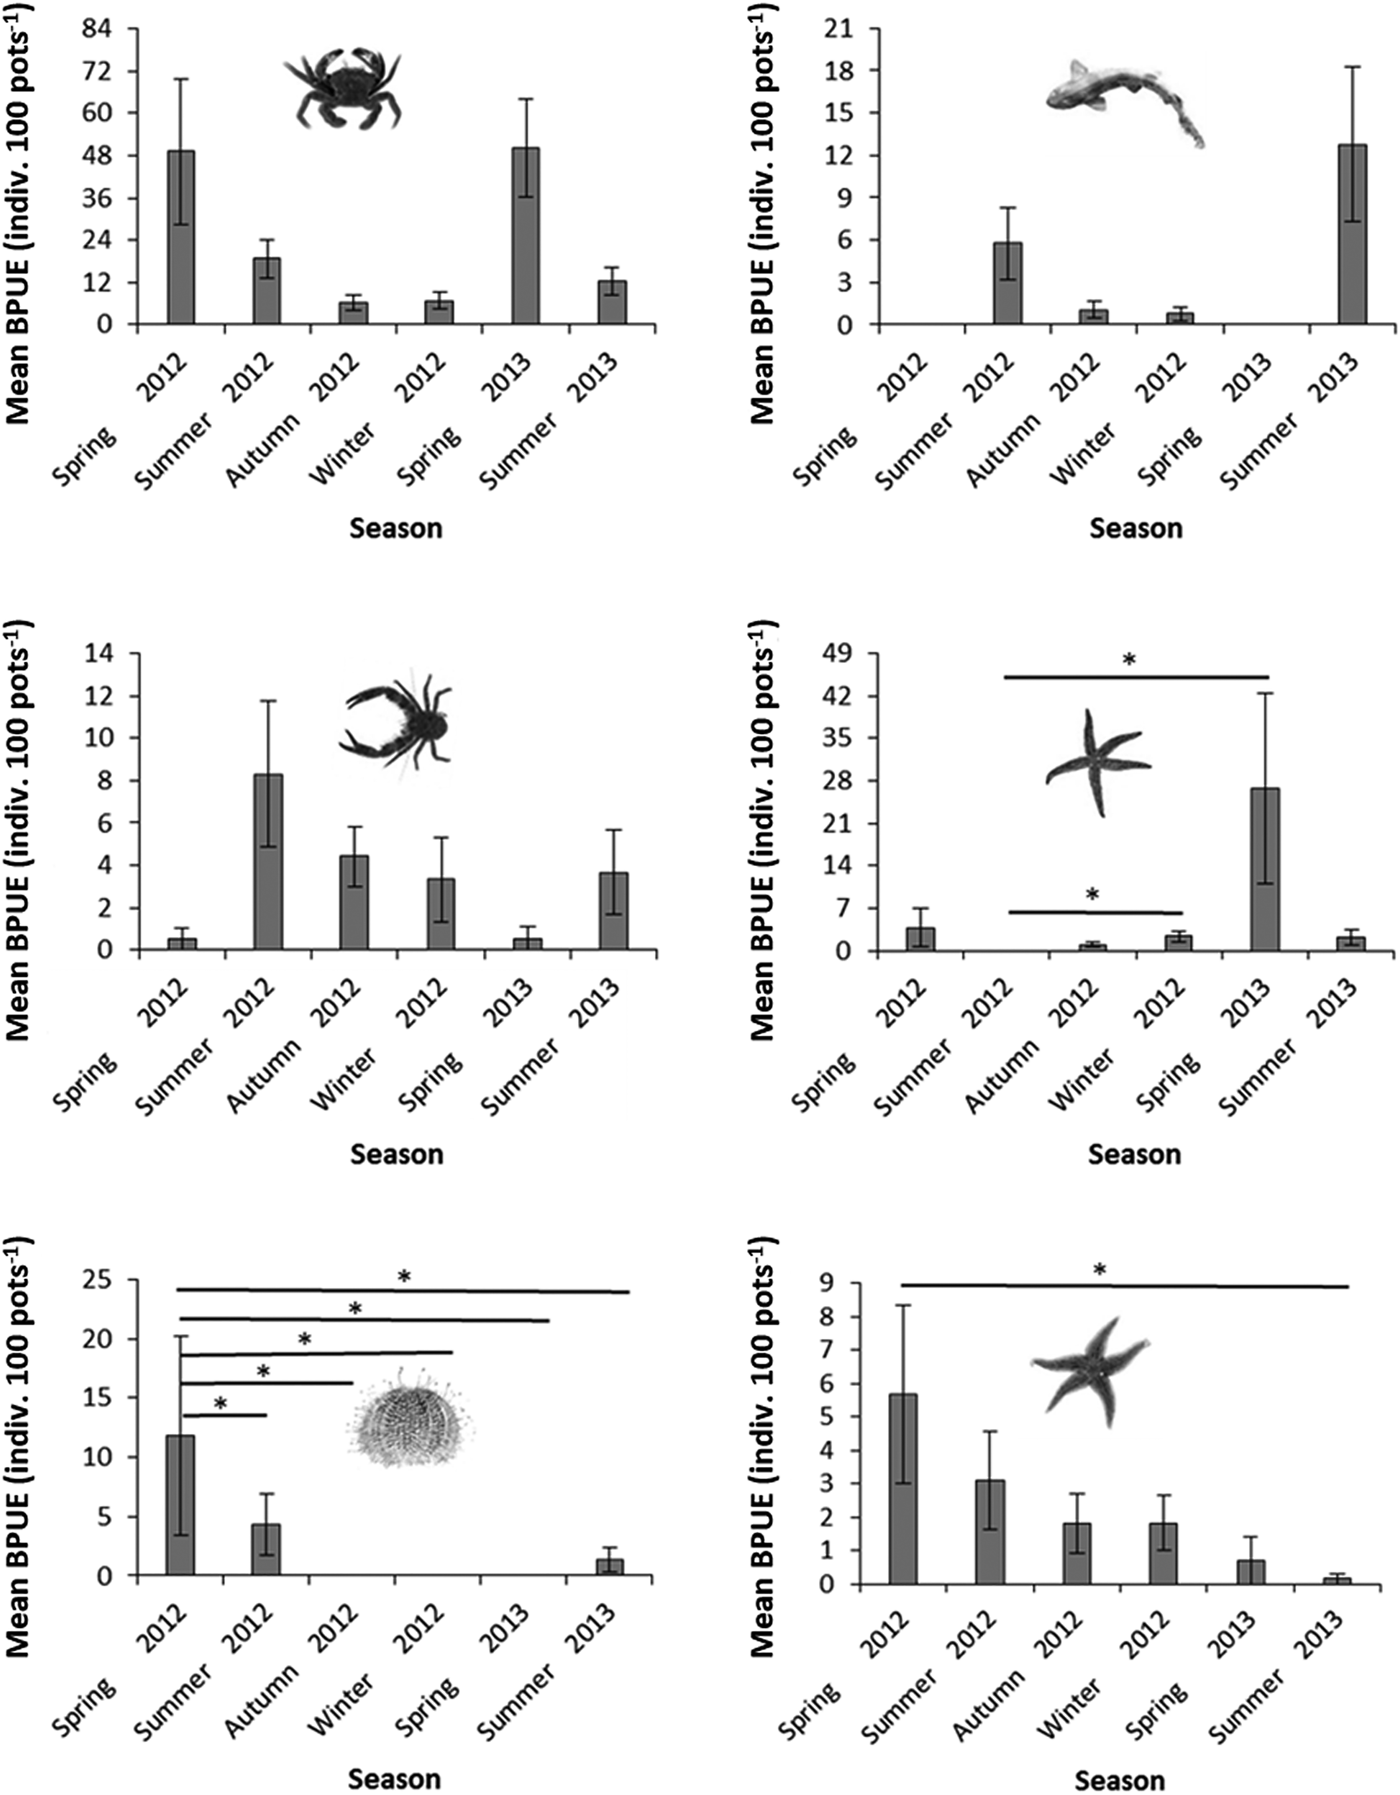
The highest and lowest mean BPUE values were determined as 81 ± 26 indiv. 100 pots−1 and 26 ± 4 indiv. 100 pots−1 in spring 2012 and autumn 2012 respectively (Figure 7). There was a marginally significant difference in the BPUE among the different sampling seasons, with the BPUE highest in spring and summer of 2012 and 2013 (Kruskal–Wallis test, Chi-square = 10.50, df = 5, P = 0.06). Figure 8 indicates the seasonal variations in BPUE of the six most common species. Among them, N. puber, M. glacialis, E. esculentus and A. rubens reached the peak BPUE in spring, whereas Galathea spp. and S. canicula were the most abundant in summer. There were statistically significant differences between sampling seasons and the BPUE of N. puber, M. glacialis, E. esculentus and A. rubens (Table 3).
Mean (±SE) BPUE of species (indiv. 100 pots−1) in each of the sampling seasons (spring 2012, summer 2012, autumn 2012, winter 2012, spring 2013, summer 2013).

Seasonal variations in mean (±SE) BPUE of the six most abundant species (N. puber, S.canicula, Galathea spp., M.glacialis, E.esculentus and A. rubens). Black lines indicate a significant difference among seasons (pairwise comparisons, non-parametric tests), significance level: *0.05.

Seasonal differences of the mean BPUE of the six most abundant species using the Kruskal–Wallis test (df = 5).

N, number of individuals.
Comparison of CPUE values of crab, lobster (target species) and by-catch species
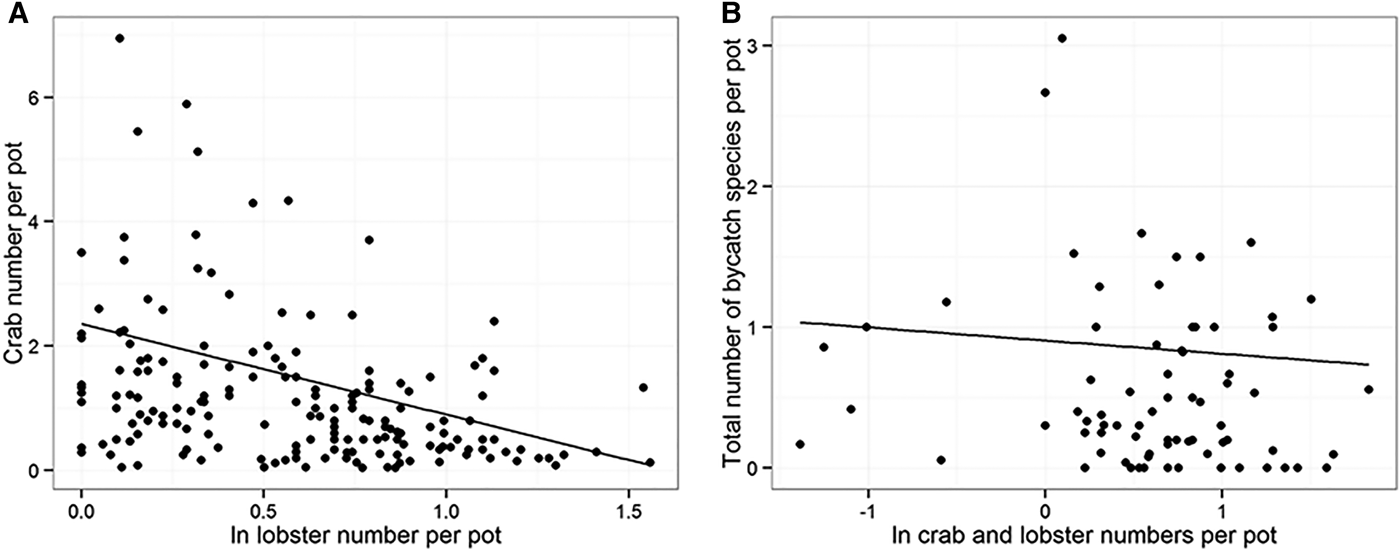
There was a significant negative relationship between crab and lobster number per pot (75th quantile regression, coef. = −0.46, P = 0.001, t = −3.43) (Figure 9A). However, there was no significant relationship between the target species (crab and lobster) number per pot and the total by-catch number (75th quantile regression, coef. = −0.09, P = 0.629, t = −0.49) (Figure 9B).
(A) The relationship between crab number per pot and ln lobster number per pot (N = 2406 hauled pots from 176 strings), (B) the relationship between total number of by-catch species per pot and ln target species (crab and lobster) number per pot (N = 1068 hauled pots from 78 strings).

The quota species
The results of this study show that the by-catch in crab traps included fish species; cod (Gadus morhua), haddock (Melanogrammus aeglefinus), coalfish (Pollachius virens), dab (Limanda limanda), hake (Merluccius merluccius), lemon sole (Microstomus kitt), pollack (Pollachius pollachius) and whiting (Merlangius merlangus). These species would need to be considered important in relation to the EU landings obligations as these species are quota species (EP, 2015).
Local ecological knowledge (LEK)
According to the questionnaire study all the fish and invertebrate species found during the fishery independent surveys, were also encountered by fishermen. Pot fishers reported encountering two other by-catch species (plate fish Bothus lunatus and shanny Lipophrys pholis) in crustacean pots. Half of the fishermen reported that the peak season for the occurrence of by-catch species in pots is spring and the other five fishermen estimated the peak season to be early summer. Furthermore, some species exhibit a strong seasonal increase in by-catch abundance. For example, fishermen reported that the common jellyfish Aurelia aurita, spiny spider crab Maja squinado, European conger Conger conger and Atlantic cod Gadus morhua occurred with the highest abundance in summer, whilst curled octopus Eledone cirrhosa peaked in spring. The latter species was also considered to suppress lobster catches due to its status as a predator of Crustacea.
DISCUSSION
The present study has provided fundamental information on the fish and invertebrate by-catch in crustacean pots and their seasonal and spatial patterns in the Northern Irish Sea. A total of 43 by-catch species were encountered in crustacean pots fished around the Isle of Man. Perhaps not surprisingly, Crustacea were the most abundant taxonomic group represented by 12 by-catch species. Elsewhere, Frusher & Gibson (Reference Frusher, Gibson, Buxon and Eayrs1998) investigated by-catch in the Tasmanian rock lobster fishery. They found 33 finfish species, nine crustacean species, 21 mollusc species and seven echinoderm species in pots which did not have escape gaps. They also reported that escape gaps reduced catches of most of the finfish and invertebrates by over 80%. Similarly, Brock et al. (Reference Brock, Hawthorne, Ward and Linnane2007) evaluated the by-catch composition in the South Australian rock lobster fishery and determined a total of 40 by-catch species. Recently, Page et al. (Reference Page, Curran and Geer2013) reported the by-catch in the commercial blue crab pot fishery in Georgia. They reported that there were 26 finfish species and 15 invertebrate species in pots. While the number of species that occur in pots may be different due to the habitat structure, biodiversity of sampling areas, the feeding behaviours of local species and technical characteristics of pots, there are striking similarities in the number and types of organisms encountered in these different studies.
The current study also demonstrates that the number of by-catch species retained by pots around the Isle of Man is relatively low in pots in comparison with other fishing gears such as trawls and scallop dredges. For example, Duncan (Reference Duncan2009) and Boyle (Reference Boyle2012) found 96 and 93 by-catch species respectively in the Isle of Man queen scallop trawl fishery. Similarly, Craven et al. (Reference Craven, Brand and Stewart2012) reported 50 fish species in the by-catches of scallop dredges in the same location (invertebrates were not recorded in this study).
In the present study, the most abundant by-catch species was the velvet crab N. puber that accounted for 34% in number of all by-catch species. Although N. puber is a target species in some fisheries (Tallack, Reference Tallack2002), it was not commercially exploited in the Isle of Man because of the lower catch of this species and the small body size of animals encountered. Henderson & Leslie (Reference Henderson and Leslie2006) investigated the survival rates of N. puber specimens, which were collected by pots. They reported that the mortality of N. puber is low (only four crabs from a total of 167 dead during the study).
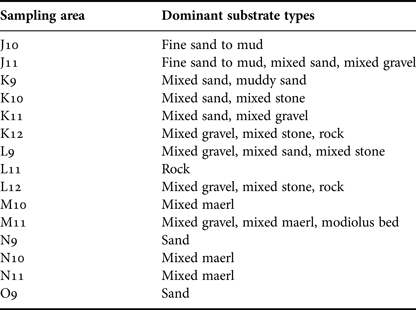
It is clear from this study that the mean BPUE of the total by-catch per pot differed significantly between fishing grounds. The total number of by-catch species in inshore areas is high in comparison with the offshore areas. Habitat structure may be a reason for the BPUE differences in sampling areas particularly for inshore waters where the habitat diversity is highest (Table 4). In particular, around the west coasts of the island some fishing grounds exhibited relatively high by-catch diversity (K10) and high BPUE (K11). It is interesting to note that K11 encompasses the Port Erin ‘closed area’ which has been protected from fishing for over 20 years. The highest mean BPUE values of the six most common species differed depending on sampling areas. For example, E. esculentus were commonly found around the east coast where the main habitats are sand, mixed gravel, mixed maerl and Modiolus beds (Table 4), which are commonly preferred by E. esculentus (Parr & Ager, Reference Parr and Ager2003). Bottom temperature was the single factor that had the best fit with the species composition of by-catches in the different areas around the Isle of Man. Thus, a combination of habitat type and environmental conditions (temperature) may be the key determinants of by-catch composition.
Dominant substrate types of different sampling areas which were identified from image analysis and sediment particle size analysis (Modified from Hinz et al., Reference Hinz, Murray, Gell, Hanley, Horton, Whiteley and Kaiser2010; White, Reference White2011).

The highest mean BPUE of species was found in spring 2012 and the lowest mean BPUE was in autumn 2012 in the Isle of Man. The seasonal catch rates varied depending upon the species. For example, N. puber and M. glacialis exhibited the highest BPUE in spring months, whereas the BPUE of S. canicula and Galathea spp. peaked in summer. The catch rate of N. puber, M. glacialis, E. esculentus and A. rubens showed a statistically significant gap between the sampling seasons. Understanding these seasonal fluctuations in by-catch would help mitigate the occurrence of these catches if it was thought that mortality occurred as a result of retention in pots. However, most of these species would survive capture once returned to the sea assuming they did not sustain injuries or damage.
There was a significant negative relationship between crab and lobster catches such that as lobster numbers increased within pots, the associated catch of brown crabs declined. As lobster predate brown crabs this is probably a predator avoidance response. A similar relationship was reported by Addison (Reference Addison1995) in English waters. Soaking time did not appear to influence by-catch abundance; however there was no means of ascertaining whether predation within the pots was a factor that might have affected this finding. Similarly, there was no significant relationship between the soaking time and crab catches in the Isle of Man (Öndes et al., unpublished).
This study shows that fish species had very low abundance in pots (except for Scyliorhinus canicula). All of the specimens were alive at the time of removal from pots. Small spotted catshark Scyliorhinus canicula, ballan wrasse Labrus bergylta and European conger Conger conger were kept by fishermen to use as bait. Similarly, common whelk Buccinum undatum specimens were kept for commercial sale. As Europe moves towards fully reported fisheries, the information reported in the present study will provide important evidence on the potential effect of pot fisheries on by-catch species and will highlight those species which are likely to be utilized for purposes such as bait or as a secondary commercial catch.
The physical impacts of pots and traps on benthic species have rarely been evaluated (Eno et al., Reference Eno, MacDonald and Amos1996, Reference Eno, MacDonald, Kinnear, Amos, Chapman, Clark, Bunker and Munro2001; Hawkins et al., Reference Hawkins, Roberts, Gell and Dytham2007; Heifetz et al., Reference Heifetz, Stone and Shotwell2009; Coleman et al., Reference Coleman, Hoskin, von Carlshausen and Davis2013); in particular, the corals, sponges, bryozoans and similar sessile organisms have the greatest propensity to be affected by trap fisheries (Shester & Micheli, Reference Shester and Micheli2011). Both Eno et al. (Reference Eno, MacDonald, Kinnear, Amos, Chapman, Clark, Bunker and Munro2001) and Coleman et al. (Reference Coleman, Hoskin, von Carlshausen and Davis2013) reported that crustacea pot fishing seems to have no detectable physical effects on benthic species in field experiments.
The phenomenon of ‘ghost fishing’ is considered to be another impact of pot or trap fishing on marine ecosystems. Bullimore et al. (Reference Bullimore, Newman, Kaiser, Gilbert and Lock2001) examined the mortality rate and the number of animals caught by fleets of crustacean pots in Wales in order to understand the impacts of lost pots. Spider and brown crabs were reported as dominant species in lost pots; velvet crab, lobster, ballan wrasse, dogfish and triggerfish were found in pots with lower abundance. Each pot killed a minimum of 6.06 brown crabs and 0.44 lobsters per pot per year. More importantly, these lost pots can continue to fish for many months in spite of the consumed bait (Bullimore et al., Reference Bullimore, Newman, Kaiser, Gilbert and Lock2001). However, the effects and frequency of the ghost fishing are still poorly understood in European fishing grounds. Pantin et al. (Reference Pantin, Murray, Hinz, Le Vay and Kaiser2015) estimated the number of lost pots in the Wales crustacean fishery using the questionnaire study. They reported that a total of 1167 pots are lost each year according to 44 brown crab fishermen's responses. In the Isle of Man, ghost fishing is considered to be rare (Manx fishers, personal communication) due to limited and decreased fishing activity in winter and bad weather. Furthermore, the compulsory use of escape gaps reduces further the potential for ghost-fishing for smaller size-classes of animals.
The common fishery policy (CFP) of European Commission aims to improve the data collection on discard and by-catch. For this aim, it is considered that not only target species but also certain by-catch species will need to be recorded in European waters. Those fish with known high survival rates can be returned to the sea (EC, 2017). For this reason, identification of by-catch species in pot fisheries plays an important role, as it enables managers to evaluate the potential ecological effects of that fishery in a particular locality. The present study provides some of the first insights into by-catch composition of crab pot fisheries in Northern European waters.
CONCLUSIONS
By-catches may cause a variety of adverse consequences on populations, food webs and conservation efforts (Revill et al., Reference Revill, Dulvy and Holst2005). The determination of the diversity of by-catch species, their catch per unit effort values and by-catch reduction techniques plays a vital role for sustainable fisheries management and protection of natural resources. The major findings of this research were that by-catch abundance is low in the Isle of Man pot fishery and it varied between inshore and offshore waters. By-catch composition consists of a total of 43 species. There is a direct relationship between lobster and crab abundance within the pots which is indicative of the predator-prey relationship between the two species, but this factor may also need to be considered if using pot catches to assess the status of the two species (estimates of true crab abundance may be under-estimated if lobsters are dominant in catches). In summary, this study shows that the Isle of Man crab pots selective fishing gears generate relatively few by-catches particularly when compared with other methods.
SUPPLEMENTARY MATERIAL
The supplementary material for this article can be found at https://doi.org/10.1017/S0025315417001643.
ACKNOWLEDGEMENTS
The authors thank the Department of Environment, Food and Agriculture (DEFA) officers and Manx crab fishermen for their contributions. The authors thank Dr Gwladys Lambert for providing the bed shear stress data.
FINANCIAL SUPPORT
This study was funded by the Ministry of National Education, Republic of Turkey (awarded to F.Ö.) and the Department of Environment, Food and Agriculture (DEFA), the Isle of Man Government (awarded to M.J.K.).