Introduction
Trichomonas vaginalis is a protozoan parasite with a cosmopolitan presence which may invade the human urogenital tract and cause trichomoniasis. The incidence of trichomoniasis is increasing worldwide, with 50% of asymptomatic cases reported in North America (Twu et al., Reference Twu, de Miguel, Lustig, Stevens, Vashisht, Wohlschlegel and Johnson2013; Kissinger, Reference Kissinger2015). Trichomoniasis induces vaginitis, cervicitis, urethritis, pelvic inflammatory disease and diverse adverse effects during pregnancy resulting in social, medical and economic implications (Swygard et al., Reference Swygard, Seña, Hobbs and Cohen2004; Twu et al., Reference Twu, de Miguel, Lustig, Stevens, Vashisht, Wohlschlegel and Johnson2013). Women infected during pregnancy are predisposed to early rupture of placental membranes and premature birth (Petrin et al., Reference Petrin, Delgaty, Bhatt and Garber1998). In addition, trichomoniasis is related to increased incidence of cervical-uterine and prostate cancer, infertility, and higher susceptibility to HIV infection (Kharsany et al., Reference Kharsany, Hoosen, Moodley, Bagaratee and Gouws1993; McClelland et al., Reference McClelland, Sangare, Hassan, Lavreys, Mandaliya, Kiarie, Ndinya-Achola, Jaoko and Baeten2007; Kissinger et al., Reference Kissinger, Amedee, Clark, Dumestre, Theall, Myers, Hagensee, Farley and Martin2009; Twu et al., Reference Twu, de Miguel, Lustig, Stevens, Vashisht, Wohlschlegel and Johnson2013; Smith and Garber, Reference Smith and Garber2015).
Innate immunity is the first line of defence against microorganisms (Fichorova, Reference Fichorova2009) including T. vaginalis. Epithelial cells, vaginal mucus, antimicrobial peptides, chemokines and immune cells such as neutrophils and macrophages provide the innate response in the female genital tract (Menezes and Tasca, Reference Menezes and Tasca2016). On the other hand, adaptive immunity is a pathogen-specific mechanism that requires the activation of B and T lymphocytes, mediated by antigen-presenting cells (Nemati et al., Reference Nemati, Malla, Yadav, Khorramdelazad and Jafarzadeh2018).
An endometrial inflammatory response is characterized by the presence of different cell populations, mainly neutrophils, macrophages and lymphocytes (Alderete and Garza, Reference Alderete and Garza1985; Song et al., Reference Song, Shin, Ahn, Min, Kim and Ryu2008; Reighard et al., Reference Reighard, Sweet, Vicetti Miguel, Vicetti Miguel, Chivukula, Krishnamurti and Cherpes2011; Nam et al., Reference Nam, Min, Kim, Lee, Kim, Song and Shin2012). Furthermore, an increase in CD4+ T cells has been described in T. vaginalis-infected women and murine models (Yano et al., Reference Yano, Aosai, Yui, Kojima and Kawana1983; Levine et al., Reference Levine, Pope, Bhoomkar, Tambe, Lewis, Zaidi, Farshy, Mitchell and Talkington1998; Reighard et al., Reference Reighard, Sweet, Vicetti Miguel, Vicetti Miguel, Chivukula, Krishnamurti and Cherpes2011; Smith and Garber, Reference Smith and Garber2015), and parasite-specific IgG and IgM have been observed (Menezes and Tasca, Reference Menezes and Tasca2016). The persistence of the parasite in hosts that have developed humoral and cell-mediated responses suggests an incomplete response. As neutrophils and macrophages are relevant in the endometrial response, this prompts further investigations of the innate arm of the immune response. Usually, neutrophils battle and kill pathogens through phagocytosis, degranulation, reactive oxygen species (ROS) production and neutrophil extracellular traps (NETs) formation. Nevertheless, the mechanism in T. vaginalis infection has not been fully elucidated and the participation of other cell types has not been considered. The use of in vivo interaction systems overcomes several disadvantages of cell culture, allowing the study of the integration of a complex cellular diversity and its role during the pathogenesis, permitting the observation of cell migration to determine cell function in the infection process. As in the gut tract, the female urogenital tract is populated by microorganisms, either commensal or pathogenic bacteria which could be masking the specific defence mechanisms established by local immune cells. This report aimed to describe the recruitment kinetics of immune cells to the infection site in order to define their role in an in vivo infection system. Besides, we show that NETs contributed to reduce the parasite viability, whereas reactive oxygen or nitrogen species have a limited impact.
Materials and methods
Parasite culture
Trichomonas vaginalis strain GT-21 was donated by Dr Anaya-Velazquez and Dr Padilla-Vaca (University of Guanajuato, Mexico); the strain was isolated from a symptomatic female patient and its virulence was demonstrated (Olmos-Ortiz et al., Reference Olmos-Ortiz, Barajas-Mendiola, Barrios-Rodiles, Castellano, Arias-Negrete, Avila and Cuéllar-Mata2017). The parasite was routinely cultured at 37°C in TYI-S-33 medium supplemented with 6% adult bovine serum and 1.5% Diamond vitamins. Potential mycoplasma contamination was investigated using a Venor GeM mycoplasma kit (Sigma-Aldrich, Cat. # MP0025), according to the manufacturer's protocol. The GT-21 strain was further investigated for the presence of any of the four known T. vaginalis virus (TVV 1–4) according to the previously described protocols (Figs S1 and S2) (Goodman et al., Reference Goodman, Freret, Kula, Geller, Talkington, Tang-Fernandez, Suciu, Demidenko, Ghabrial, Beach, Singh, Fichorova and Nibert2011; Fraga et al., Reference Fraga, Rojas, Sariego, Fernández-Calienes and Nuñez2012).
Mice maintenance conditions
BALB/c mice between 6 and 8 weeks of age (weight from 25 to 30 g) were used. Animals were bred in polycarbonate cages administering water and food ad libitum, in a temperature-controlled environment at 25 ± 3°C and handled according to the Mexican norm NOM-062-ZOO-1999.
Trichomonas vaginalis infection
Six animals per group were inoculated with 0, 1, 3, 5 or 8 million trophozoites diluted in 500 μL of sterile PBS. The peritoneal injection was performed using a 1 mL syringe with a 0.5 × 16 mm needle. The mice were sacrificed 15 days after inoculation to confirm the establishment of the infection and the peritoneal lavages were performed using 2 mL of cold PBS, recovering 500 μL of peritoneal wash from each mouse. Aliquots of the peritoneal washes (100 μL) were inoculated in LB liquid medium and Muller Hinton solid medium to identify any bacterial contamination during the process. After 3 days of inoculation with 8 million trophozoites, this group showed high mortality (40%). The evaluation of the infection was performed in the rest of the animals, according to the following criteria.
(a) Peritoneal washes cell count. The cells contained in peritoneal washes were stained with propidium iodide (PI) and the total count of cells including trophozoites and peritoneal cells was performed using a Neubauer chamber. Results were expressed as cells mL−1 for each experimental condition.
(b) Live parasites recovery. Also, the viability of the parasite recovered from the peritoneal cavity was verified as reported (Marcel et al., Reference Marcel, Rojas, Rodríguez, López and Ramos2001). That is, the presence of live trophozoites was evaluated by the addition of 20 μL of peritoneal washes into 5 mL of TYI-S-33 medium added with penicillin/streptomycin (100 U mL−1 and 100 μg mL−1, respectively), cultured at 37°C during 24 h and the absorbance to 450 nm was measured.
(c) Necropsy. The animals were sacrificed by cervical dislocation 15 days after parasite inoculation. Liver, stomach, kidneys, bladder, lungs, heart and encephalon were examined for anatomic damage. In addition, spleens were resected and weighed for splenomegaly assessment.
Flow cytometry
Six groups of animals were inoculated with 5 million trophozoites. Mice from each group were sacrificed at different times, 0, 3, 6, 9, 12 and 15 days after inoculation. Peritoneal washes were performed, and cells were resuspended at 1 million into 200 μL sterile PBS supplemented with 5 mm EDTA, 3% FBS (Biowest, Nuaillé, France) and 2% BSA (Gold Biotechnology, Sant Louis, MO, USA). The cells were incubated with the following rat antibodies: anti-CD8-AF647 (Santa Cruz Biotechnology, Dallas, TX, USA), anti-CD19-APC/Cy7, anti-F4/80-PerCP and anti-Ly-6c-PE/Cy7 (Biolegend, San Diego, CA, USA). Besides, Syrian hamster anti-CD3-PE and rat anti-CD4-FITC antibodies were used. After 60 min of incubation on ice, the cells were washed twice, resuspended in 500 μL of sterile PBS and incubated with PI for 15 min (Biolegend). After washing under the same conditions, the cells were fixed with 4% paraformaldehyde for 30 min, washed three times with PBS containing glycine, resuspended in 100 μL of sterile PBS and analysed by flow cytometry. Cells were acquired on FACScanto (BD Biosciences) in the Hospital of Specialities ‘Centro Medico Nacional Siglo XXI’ and data were analysed with FlowJo software (FlowJo V10, Ashland, Oregon, USA)
Reactive nitrogen species quantification
Two iNOS inhibitors, N(ɯ)-nitro-L-arginine methyl ester (L-NAME) or aminoguanidine (AG) (Sigma Aldrich, San Luis, MO, USA), were independently administered to mice at 1% in the drinking water to investigate the participation of nitric oxide in the immune response against T. vaginalis. Nine days after parasite inoculation, when the peak of infection occurred, the mice were sacrificed (Barajas-Mendiola et al., Reference Barajas-Mendiola, Castellano, Barrios-Rodiles, Deveze-Alvarez, Avila and Cuellar-Mata2019), and peritoneal washes were obtained. Reactive nitrogen species (RNS) were determined by nitrite quantification according to the modified Griess method (Arias-Negrete et al., Reference Arias-Negrete, Jiménez-Romero, Solís-Martínez, Ramírez-Emiliano, Avila and Cuéllar-Mata2004).
NETs inhibition
To investigate the role of NETs to control T. vaginalis growth, the NADPH-oxidase inhibitor metformin and the peptidyl arginine deiminase-4 (PAD4) inhibitor Cl-amidine were used; these compounds interfere in the signalling cascade for NETosis. Mice were inoculated with 5 million trophozoites by intraperitoneal injection, and 2% metformin in drinking water along the infection period, or Cl-amidine (0.3 mg per 200 μL sterile PBS/day/mice, intraperitoneally) during 3 days after infection. The dose of inhibitors was adapted according to previous reports (Knight et al., Reference Knight, Zhao, Luo, Subramanian, O'Dell, Yalavarthi, Hodgin, Eitzman, Thompson and Kaplan2013; Wang et al., Reference Wang, Li, Chen, Gu and Ye2015). Mice were sacrificed, and the peritoneal washes were used for extracellular DNA (NETs) quantification assays.
Extracellular DNA quantification
Extracellular DNA present in peritoneal washes was digested with micrococcal nuclease (500 mU mL−1, New England Biolabs) for 15 min, and the nuclease activity was stopped with 5 mm EDTA. Supernatants were collected and centrifuged at 2500 g for 5 min. DNA was calculated using Quant-it DNA PicoGreen (Invitrogen) under a standard curve using λ-DNA, as indicated by the provider.
Statistical analysis
Statistical analysis of three independent experiments was performed with the GraphPad Prism 5 software, using analysis of variance of Kruskal–Wallis and Dunn's post-hoc test. Each experiment included six mice per condition, and the significance P < 0.01 was indicated with *, P < 0.001 was indicated with **, and P < 0.0001 was indicated with ***.
Results
Trichomonas vaginalis intra-peritoneal infection
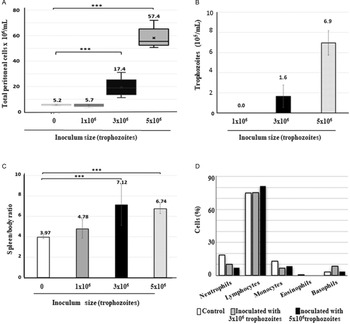
To establish an in vivo interaction system that allowed the study of the immune response, both parasite viability and host survival were evaluated, after trophozoite introduction at different quantities into the mice peritoneum. Parasite cultures were free of mycoplasma contamination and TVV (see Figs S1 and S2). Mice were inoculated with 1, 3, 5 or 8 million GT-21 T. vaginalis trophozoites and then sacrificed 15 days after inoculation to perform the necropsy and analyses of infection signs. Total cell count, immune cells and trophozoites, was determined by Neubauer chamber count and it revealed a considerable increase of peritoneal cells mL−1 with respect to uninfected mice, up to 17.4 × 10⁶ or 57.4 × 10⁶ cells in mice inoculated with 3 or 5 million trophozoites, respectively. The inoculation of 1 million trophozoites did not induce significant changes in the cell population (5.7 × 10⁶ cells mL−1). As expected, uninfected mice showed an invariable number of cells per millilitre (5.2 × 10⁶ cells mL−1) (Fig. 1A). As more than 40% mortality on mice was observed in the group inoculated with 8 million trophozoites, the data obtained from this were exuded from the study.
Signs of intraperitoneal infection. Mice were intraperitoneally inoculated with 1, 3 or 5 million trophozoites, and group control was inoculated with sterile PBS. Mice were sacrificed 15 days after inoculation for analysis of infection signs such as (A) cell density (B) trophozoites count, (C) splenomegaly analyses, spleen weight (mg)/body weight (g) ratio in each group; and (D) leucocytes count in blood samples. The experiments were performed by triplicate and statistical analysis carried out by Kruskal–Wallis and Dunn's post-test using n = 6, P < 0.001.

To determine the parasite viability, 20 μL of the peritoneal washes were inoculated in TYI-S-33 medium, and 24 h after inoculation, the parasite viability was evaluated as described (Marcel et al., Reference Marcel, Rojas, Rodríguez, López and Ramos2001; Olmos-Ortiz et al., Reference Olmos-Ortiz, Barajas-Mendiola, Barrios-Rodiles, Castellano, Arias-Negrete, Avila and Cuéllar-Mata2017; Barajas-Mendiola et al., Reference Barajas-Mendiola, Castellano, Barrios-Rodiles, Deveze-Alvarez, Avila and Cuellar-Mata2019). The results confirm the infection establishment with an increasing number of parasites isolated, 1.6 × 10⁵ ± 0.4 × 10⁵ or 6.9 × 10⁵ ± 0.9 × 10⁵ trophozoites mL−1 when 3 or 5 million trophozoites were inoculated, respectively (Fig. 1B). Peritoneal washes obtained from mice inoculated with 1 million trophozoites did not show parasite growth.
Besides, we observed that spleens from infected mice increased in size compared to those from uninfected animals (2.3 or 1.9 cm, respectively). We decided to evaluate splenomegaly determining the spleen/body weight ratio (mg g−1). This ratio was 4.78, 7.12 and 6.74 in mice inoculated with 1, 3 or 5 million trophozoites, respectively, while the uninfected mice ratio was 3.97 (Fig. 1C). On day 15 post-infection, the differential leukocyte count in blood showed lymphocytosis and neutropenia similar to a well-established infection process (Fig. 1D) (Malla et al., Reference Malla, Valadkhani, Harjai, Sharma and Gupta2004; Lazenby et al., Reference Lazenby, Soper and Nolte2013; Smith and Garber, Reference Smith and Garber2015). Moreover, the pathologic findings revealed the presence of a whitish nodule in the peritoneal tissue of infected mice, more abundant in those inoculated with 5 million trophozoites (Fig. S3).
Taken together the data, the increase of peritoneal cell total count, long-term parasite survival, splenomegaly, differential leukocyte count and pathologic analysis indicate an intense immune response to a well-established infection process. The inoculum of 5 million trophozoites was used for the next experiments.
Trichomonas vaginalis induces intense cellular changes in response to infection
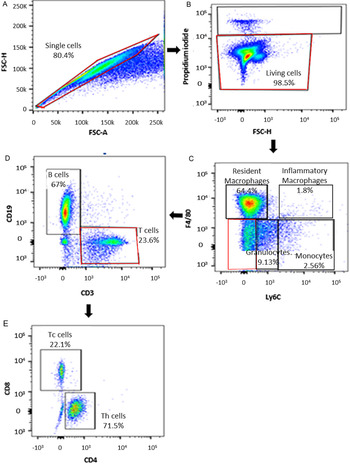
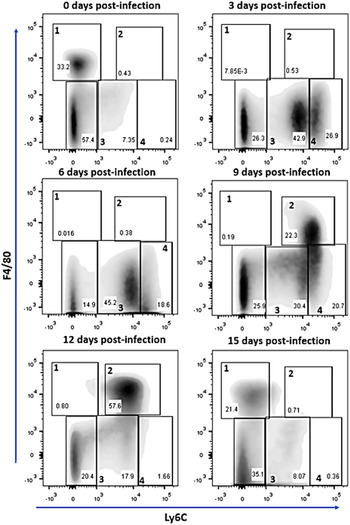
A flow cytometry analysis was performed in peritoneal washes obtained from infected mice, at 3, 6, 9, 12 and 15 days after parasite inoculation, and the cell population changes were determined. PI was used for gating out dead cells and gates were designed as Ly6C− and F4/80+ for resident macrophages, Ly6C+ F4/80+ for inflammatory macrophages, Ly6CmediumF4/80− for polymorphonuclears (PMN) and Ly6ChighF4/80− for monocytes (Fig. 2). The results show a significant increase in the average of different cell lineages, such as PMN, which increase from 7.35 to 42.9% from day 0 to 3, and monocytes from 0.24% to 26.9% on the same post-infection period (Fig. 3). In addition, a decrease in the resident macrophage population (Ly6C−, F4/80+) was observed, which was replaced by an important increase in the inflammatory macrophage population (Ly6C+, F4/80+), 9–12 days after inoculation (52%). Interestingly, at 15 days post-infection, the results showed a similar trend to uninfected mice (control group) and to those shown at day 0 (Fig. 3).
Gates selection for flow cytometry analysis. (A) Single cells. (B) Living cells. (C) Ly6C-F4/80 markers and Ly6CmediumF4/80− for granulocytes; Ly6ChightF4/80− for monocytes; Ly6C−F4/80+ for resident macrophages; and Ly6C+F4/80+ for inflammatory macrophages. (D) Double-negative cells were gated for T cells (CD3+) and B cells (CD19+). (E) CD3+ cells were gated by Th cells (CD4+) and Tc cells (CD8+).

Cell population changes during T. vaginalis infection. Mice were inoculated with 5 million trophozoites and the peritoneal washes were obtained at 0, 3, 6, 9, 12 and 15 days after parasite inoculation. Dot plots indicate Ly6C vs F4/80 profiles of live cells obtained from peritoneal washes. 1 = Resident macrophages, 2 = inflammatory macrophages, 3 = polymorphonuclear cells and 4 = monocytes. Data are representative of three independent experiments.

An increase in absolute numbers for PMN (Ly6Cmedium F4/80−) was observed, which gradually increases along the infection. A similar trend was observed in inflammatory macrophages lineage (Ly6C+ F4/80+). Nine days after inoculation, the changes were evident (Table 1). These results suggest that PMN (Ly6Cmedium F4/80−) and activated macrophages (Ly6C+ F4/80+) can be participating in the immune response against the parasite.
Total count of cell populations in peritoneal washes from mice infected with T. vaginalis

Next, the presence of CD3 and CD19 corresponding to the T and B lymphocytes (T and B cells) was analysed in the double-negative population (Ly6c− F4/80−). The results reveal that B cells decreased 3 days after parasite inoculation, from 2.4 to 1.4 million, but subsequently showed steady increases having a maximum peak 15 days after inoculation (21.4 million cells). On the other hand, T cells showed a rapid increase 3 days after infection, they were from 0.3 to 2.2 million cells, and a gradual decrease along the infection until reached the baseline values (Fig. 4).
Lymphocytes number determined by flow cytometry analysis. Changes in B cell (white bars) and T cell (grey bars) population during the infection period. Data are representative of three independent experiments expressed as the mean ± s.d. Significance was determined by Kruskal–Wallis analysis and Dunn's test (n = 6, ***P < 0.001). ***Data were compared against time 0

According to flow cytometry analysis, neutrophils and inflammatory macrophages showed an increase in cell percentage since day 3 and day 9 post-infection, respectively, reaching the maximum at day 12 for macrophages (Fig. 5). Then, we studied the defence mechanisms proposed for those cell lineages in the physiopathology of the infection.
Timeline for cellular analyses during T. vaginalis infection. Mice were intraperitoneally inoculated with the parasite, image shows the sampling times for: flow cytometry analyses, NETs quantification and NO determination. It includes the graph of the main cell population changes observed during early infection.

Trichomonas vaginalis is resistant to nitric oxide production
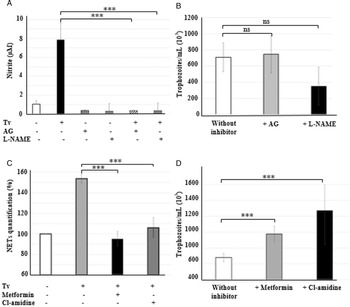
Phagocytic cells have an arsenal of antimicrobial activities, including the production of RNS and NETs formation. To know the impact of the RNS produced by these cells on the T. vaginalis viability, we used two inhibitors: AG and a nitro-L-arginine (L-NAME). As expected, mice treated with AG or L-NAME produced lower NO quantities than uninfected mice (Fig. 6A). Then, we measured the parasite viability in the presence of these inhibitors. The results show that the inhibitor AG allowed the growth of 746 355 ± 229 699 trophozoites per mL whereas in its absence we determined 707 844 ± 178 775 trophozoites per mL, which does not represent a significant difference in the parasite viability. With respect to the effect of L-NAME inhibitor on the parasite viability on infected mice, 350 881 ± 234 913 trophozoites were quantified but the statistical analysis showed no significant difference in the parasite growth obtained from the peritoneal washes (Fig. 6B).
Impact of NO production and NETs formation in the parasite viability. Mice were inoculated with 5 million trophozoites; (A) nitrite was quantified by modified Griess assay (Material and methods) in the presence or absence of NOS2 enzyme inhibitors, aminoguanidine (AG) or L-nitro arginine methyl ester (L-NAME); (B) parasite viability in peritoneal washes from AG or L-NAME-treated or untreated infected mice; (C) NETs were quantified by Quant it DNA kit in peritoneal washes from metformin-treated or Cl-amidine-treated infected mice; (D) parasite viability in peritoneal washes from metformin or Cl-amidine-treated mice. Data are representative of three independent experiments expressed as the mean ± s.d. Significance was determined by Kruskal–Wallis analysis and Dunn's post-test (n = 6, ***P < 0.001). ns = non-significant.

NETs participate in the parasite control in peritoneal infection
To investigate the participation of extracellular traps induced by neutrophils on the parasite control, mice were treated with the NADPH inhibitors, metformin (Wang et al., Reference Wang, Li, Chen, Gu and Ye2015; Carestia et al., Reference Carestia, Frechtel, Cerrone, Linari, Gonzalez, Casais and Schattner2016) or Cl-amidine (Rein et al., Reference Rein, Sullivan and Mandell1980; Candeias et al., Reference Candeias, Patel, Stratford and Wardman1993; Luo et al., Reference Luo, Arita, Bhatia, Knuckley, Lee, Stallcup, Sato and Thompson2006; Song et al., Reference Song, Lim, Moon, Ahn and Ryu2010; Kusunoki et al., Reference Kusunoki, Nakazawa, Shida, Hattanda, Miyoshi, Masuda, Nishio, Tomaru, Atsumi and Ishizu2016), blocking the deimination of arginine residues to citrulline in the histones during NETs formation (Wang et al., Reference Wang, Li, Stadler, Correll, Li, Wang, Hayama, Leonelli, Han, Grigoryev, Allis and Coonrod2009; Leshner et al., Reference Leshner, Wang, Lewis, Zheng, Chen, Santy and Wang2012). Thus, the mice were inoculated with the parasite and free DNA was quantified in the peritoneal washes using the Quant-it DNA Pico green kit (Fig. 6C). Also, we determined viable trophozoites in the peritoneal washes extracted from infected mice treated either with metformin or Cl-amidine. Notably, parasite viability increased to 43% and 86% when they were treated with metformin and Cl-amidine, respectively, compared to the control group (Fig. 6D). These results strongly suggest that the formation of extracellular traps contributes significantly to parasite elimination.
Peritoneal CD4:CD8 lymphocyte ratio increases during the peritoneal infection
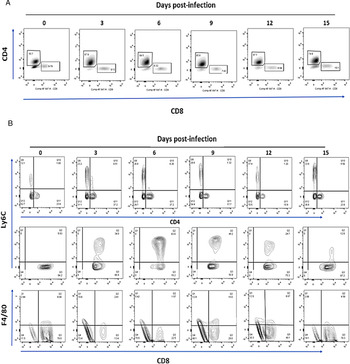
In murine intravaginal infection and human vaginal trichomoniasis, CD4 T lymphocytes are usually associated with an inflammatory process (Critchlow et al., Reference Critchlow, Wolner-Hanssen, Eschenbach, Kiviat, Koutsky, Stevens and Holmes1995; Levine et al., Reference Levine, Pope, Bhoomkar, Tambe, Lewis, Zaidi, Farshy, Mitchell and Talkington1998; Smith and Garber, Reference Smith and Garber2015). CD4 cells are important for B-cell germinal centre formation (MacLennan et al., Reference MacLennan, Gulbranson-Judge, Toellner, Casamayor-Palleja, Chan, Sze, Luther and Orbea1997) and adaptive immunity coordination that help CD8 T lymphocyte and B lymphocyte responses (Gasper et al., Reference Gasper, Tejera and Suresh2014). To investigate the CD4:CD8 lymphocyte ratio changes during the infection, we analysed the proportion of these populations in the positive CD3 gate of peritoneal cells obtained from T. vaginalis-infected group. The flow cytometry analysis revealed that infected mice presented an average increase of CD3+CD4+ cell population reaching 87.1% at day 12, thus representing a significant increase compared with mice cells at 0 time of 55.7%. Later, CD3+CD8+ cells did not exhibit significant changes along the entire infection period as it is appreciated because we determined a 7.7% ratio of this population in uninfected mice and a 7.15% ratio in infected mice (Fig. 7A).
Analysis of lymphocytes populations and subpopulations. Mice were inoculated with 5 million trophozoites and peritoneal washes were obtained at 0, 3, 6, 9, 12 and 15 days after infection. (A) Dot plot of CD4:CD8 T cells, (B) Th1 cells were gated as a CD4+Ly6C+ population (up); activated T cells were gated like a CD8+F4/80+ population (middle), and Tcm cells were gated for the presence of Ly6C marker (CD8+Ly6C+) (down). Images are representative of three independent experiments using n = 6.

Intense proliferation of memory T cells is induced during trichomoniasis
We have previously reported a proinflammatory profile prompted in the host by T. vaginalis infections, which include the production of nitric oxide and various cytokines such as TNF-α, IL-6, IL-10 that may suggest a Th1-type response (Olmos-Ortiz et al., Reference Olmos-Ortiz, Barajas-Mendiola, Barrios-Rodiles, Castellano, Arias-Negrete, Avila and Cuéllar-Mata2017). To clarify the participation of T cells, we analysed cell-specific surface markers, to reveal T. vaginalis-induced activation and differentiation of T effector cells. CD4 T cells differentiate into Th1 cells and the effector Th1 cells express Ly6c marker in specific response to viral infection (Matsuda et al., Reference Matsuda, Zhang, Ndonye, Richardson, Howell and Gapin2006; Marshall et al., Reference Marshall, Chandele, Jung, Meng, Poholek, Parish, Rutishauser, Cui, Kleinstein, Craft and Kaech2011). We determined for the first time if effector CD4+Ly6C+T cells arise during trichomoniasis. Our results show an increased CD4+Ly6C+ cell population during early infection in peritoneal washes, 3 and 6 days post-infection but not 9 days post-infection (Fig. 7B, up).
In addition, it is known that CD8+T cells primarily differentiate into cytotoxic T lymphocytes (CTLs) or memory T cells (Tcm). F4/80 marker expression has been observed on activated CD8+T cells from mice in acute viral infections (Lin et al., Reference Lin, Roberts, Sriram, Cho and Brutkiewicz2003), which indicates the activation of these cells. Because its presence has not been investigated in trichomoniasis, the presence of these cells was explored, and the expression of F4/80 on CD8+T cells was analysed. The peritoneal cells obtained from uninfected mice exhibited a high percentage of F4/80+CD8+T cells (8%) whereas peritoneal cells from infected mice expressed only 2.6 or 1.5% of that cell type, 3 or 6 days after infection, respectively. The F4/80 expression in T cells emerged as 10%, 9 days after infection but reduced until 5% at 15 days after infection (Fig. 7B, down), just after the peak of the CTL response.
On the other hand, Ly6C has been referenced as a characteristic cell-surface marker of Tcm cells and is involved in the migration properties of lymphocytes (Hänninen et al., Reference Hänninen, Maksimow, Alam, Morgan and Jalkanen2011). To know if CD8+T cells matured towards Tcm, we analysed the presence of the Ly6c marker in CD8+T cells. The results showed a notable increase (49.6%) of this marker 3 days after infection, while uninfected cells did not (12.4%); the maximum peak of this expression is observed 6 days after infection (80.3%) and show a decreasing trend 9, 12 and 15 days after infection (48.7, 25.7 and 13.29%, respectively) (Fig. 7B, middle). Those results are according to the previous reports that describe the function of Ly6C marker on the subsets of memory T cells (Hänninen et al., Reference Hänninen, Maksimow, Alam, Morgan and Jalkanen2011). The above means that even though the lymphocytes lineage does not lose its proliferative capacity, most T cells differentiate into Tcm and fewer develop a cytotoxic activated cell (T cytotoxic).
Discussion
We established an intraperitoneal murine model of trichomoniasis for the study of the immune cell populations during their interaction with T. vaginalis allowing the survival for both host and parasite. Our interest was to determine the earliest events of the immune response, rather than the infection mechanism. For that, we assured the infection according to Gomez-Barrio et al. (Reference Gomez-Barrio, Nogal-Ruiz, Montero-Pereira, Rodriguez-Gallego, Romero-Fernández and Escario2002) observing pathologic damages such as visceral necrosis spots and ascites, but we also assured the host survival to allow the manifestation of the intense immune response induced (Nogal Ruiz et al., Reference Nogal Ruiz, Escario, Martinez Diaz and Gomez Barrio1997). Also, we evaluated other infection signs such as weight gain of the animal model, physical condition and changes of lymphocyte number in blood samples (Fig. 1D), as well as the presence and viability of the parasite along all the infection period for our experiments. The spleen–body weight ratio was greater in our evaluation than the difference of previously reported values for the subcutaneous inoculation (Mason and Gwanzura, Reference Mason and Gwanzura1990). Our peritoneal model showed a spleen–body weight ratio of 7.1, whereas this ratio was 5.44 for the subcutaneous inoculation. Previously reported spleen–body weight ratios were obtained during a subcutaneous mouse challenge, with various pieces of information missing, such as the dose and strain of patient-collected T. vaginalis used. Then, we can conclude that our intraperitoneal model induces a strong immune response. It should be noted that in healthy mice the spleen–body weight ratio did not show significant differences in either intraperitoneal or subcutaneous models (3.96 and 4.36, respectively). Furthermore, immunophenotyping performed in peritoneal washes obtained from mice infected with T. vaginalis (Fig. 2) allowed us to establish a dynamic scheme of the immune cell recruitment in response to this parasitic invasion. Our model opens the possibility to perform additional studies about the in vivo host–parasite interaction free from the influence of hormones and vaginal microbiota.
PMN cell and monocyte populations were kept in constant increase during early infection, and they were replaced gradually later by a high presence of inflammatory macrophages 9 days after infection. As IL-8 is a known mediator of the early immune response to T. vaginalis, these could be responsible for the initial neutrophil accumulation observed (Shaio et al., Reference Shaio, Lin, Lee, Hou, Tang and Yang1992, Reference Shaio, Lin, Liu and Tang1994, Reference Shaio, Lin, Liu and Yang1995; Ryu et al., Reference Ryu, Kang, Jung, Shin, Kim, Park and Min2004; Nam et al., Reference Nam, Min, Kim, Lee, Kim, Song and Shin2012).
The inverse correlation observed between the gradual decrease in the numbers of Ly6C+ monocytes and the increase in the numbers of inflammatory macrophages is expected and the result of inflamed-site infiltration by stimulated monocytes which differentiate into inflammatory macrophages and dendritic cells (Nahrendorf et al., Reference Nahrendorf, Swirski, Aikawa, Stangenberg, Wurdinger, Figueiredo, Libby, Weissleder and Pittet2007; Misharin et al., Reference Misharin, Cuda, Saber, Turner, Gierut, Haines, Berdnikovs, Filer, Clark, Buckley, Mutlu, Budinger and Perlman2014; Morias et al., Reference Morias, Abels, Laoui, Van Overmeire, Guilliams, Schouppe, Tacke, deVries, De Baetselier and Beschin2015). Although these two populations express similar surface markers, an adequate panel of antibodies for flow cytometry let us perform an accurate identification of individual cellular subsets (Misharin et al., Reference Misharin, Morales-Nebreda, Mutlu, Budinger and Perlman2013) but it is still necessary to perform a precise and complete identification of the relative and absolute composition of inflammatory cell populations in response to trichomoniasis.
Also, an increase in the CD4:CD8 T lymphocytes ratio has been observed in cervical biopsies from infected women using FACS analyses (Levine et al., Reference Levine, Pope, Bhoomkar, Tambe, Lewis, Zaidi, Farshy, Mitchell and Talkington1998; Reighard et al., Reference Reighard, Sweet, Vicetti Miguel, Vicetti Miguel, Chivukula, Krishnamurti and Cherpes2011). Even if this is a different model, it is possible in human cells to activate the defence in a similar way. Therefore, we propose this host–parasite interaction system to study T. vaginalis early infection and quantify several cell types participating in this process, also to define mechanisms that affect the parasite survival.
The relation between T. vaginalis infection and HIV susceptibility is not clear yet. Several hypotheses have been proposed to explain it, for example, the increase in susceptible leucocytes in the infection site including CD4 lymphocytes, monocytes and Langerhans cells (Edwards and Morris, Reference Edwards and Morris1985; Levine et al., Reference Levine, Pope, Bhoomkar, Tambe, Lewis, Zaidi, Farshy, Mitchell and Talkington1998; Smith and Garber, Reference Smith and Garber2015). Although it has been reported that there is an increase in CD4+ over the development of the infection, the role of those cells in parasite clearance is currently unclear. CD4+ T cells give rise to distinct functional cell types, such as Th1, Th2, Th17 and Treg cells depending on the infection type and cytokines produced. In our work group, the presence of IL-13 and IL-17 has been determined in vaginal washes of infected mice (Olmos-Ortiz et al., Reference Olmos-Ortiz, Barajas-Mendiola, Barrios-Rodiles, Castellano, Arias-Negrete, Avila and Cuéllar-Mata2017). Our observed increase in the CD3+CD4+ T cell compartment up to 3 days post-infection is consistent with low IL-3 and IL-17 at earlier time points.
To the best of our knowledge, there is currently scarce information regarding the role of memory T cells during trichomoniasis infections. Therefore, our results showing the development of memory T cells during the investigated timeframe are highly novel. These memory T cells could provide protection or a faster response upon a reinfection event. Memory cells arise from the differentiation of naïve cells incorporating surface molecules such as Ly6C in T lymphocytes in different systems (Hänninen et al., Reference Hänninen, Maksimow, Alam, Morgan and Jalkanen2011; Marshall et al., Reference Marshall, Chandele, Jung, Meng, Poholek, Parish, Rutishauser, Cui, Kleinstein, Craft and Kaech2011; Terrazas et al., Reference Terrazas, Varikuti, Oghumu, Steinkamp, Ardic, Kimble, Nakhasi and Satoskar2017). Ly6C is a haematopoietic mouse differentiation marker and sends signals for T-cell activation and cytokine production. Similarly, a role of Ly6C marker has been attributed in the T-cell immunity as a T-cell development, and in the helper-T-cell functional division. Ly6C is expressed in both mature CD8 and CD4 T cells and is involved in the homing of memory T cells (Tcm) (Walunas et al., Reference Walunas, Bruce, Dustin, Loh and Bluestone1995; Henderson et al., Reference Henderson, Kamdar and Bamezai2002; Hänninen et al., Reference Hänninen, Maksimow, Alam, Morgan and Jalkanen2011).
Our results showed an early increase in CD4+Ly6C+ population, 3 and 6 days post-inoculation, followed by an increase in CD8+Ly6C+ cells that remain increased during the time of our research. These results are in accordance with a previous report using a model of acute lymphocytic choriomeningitis virus (Marshall et al., Reference Marshall, Chandele, Jung, Meng, Poholek, Parish, Rutishauser, Cui, Kleinstein, Craft and Kaech2011), in the same way that we observed an increase in B lymphocytes at 15 days post-infection, and consistent with reports that refer to the presence of specific immunoglobulins against T. vaginalis (Smith and Garber, Reference Smith and Garber2015). Nevertheless, trichomoniasis results in a constant reinfection (Abraham et al., Reference Abraham, Desjardins, Filion and Garber1996; Petrin et al., Reference Petrin, Delgaty, Bhatt and Garber1998; Smith and Garber, Reference Smith and Garber2015). It will be important to investigate the type of CD4+ or CD8+ T cells generated and differentiated into memory T cells during infection. In addition, it will be important to elucidate the signalling route followed to differentiate into memory T cells and if these memory T cells remain for a long time.
Monocyte-macrophage linage cells showed an increased presence in infected mice, as was revealed by flow cytometry data. These cells possess diverse mechanisms to eliminate the pathogens, such as the RNS production. Our experiments showed a high production of NO in infected mice as other researchers have reported for in vitro assays (Park et al., Reference Park, Ryu and Min1997; Han et al., Reference Han, Goo, Park, Hwang, Kim, Yang, Ahn and Ryu2009; Bogdan, Reference Bogdan2015). Nevertheless, the cytotoxic activity was not efficient in vivo to reduce parasite viability, because we still observed that NO increase up to eight times in infected mice in comparison to the control group. The above suggests that NO produced by iNOS is not a definitive tool of defence against T. vaginalis although it has been described that NO have cytotoxic activity against different parasites such as Schistosomas mansoni, Leishmania major and Toxoplasma gondii (James and Glaven, Reference James and Glaven1989; Green et al., Reference Green, Mellouk, Hoffman, Meltzer and Nacy1990; James and Hibbs, Reference James and Hibbs1990). In vitro experiments using murine peritoneal macrophages have shown guidance to decrease the T. vaginalis viability by NO cytotoxic activity (Park et al., Reference Park, Ryu and Min1997). However, our research showed null activity of NO against the parasite probably due to the different concentrations of NO released by macrophages (18 and 8 μ m, respectively). It is known that NO cause toxicity through the inhibition of hydrogenosomal enzyme activities (Ryu and Lloyd, Reference Ryu and Lloyd1995). Nevertheless, it has been widely reported that the microorganisms have developed various mechanisms to resist cytotoxic activity by NO, such as the consumption of arginine to deprive host cells of nitric oxide synthase 2 (NOS2) (Stadelmann et al., Reference Stadelmann, Hanevik, Andersson, Bruserud and Svärd2013; Cusumano et al., Reference Cusumano, Watson and Caparon2014). In our model, NO can act as a second messenger for T. vaginalis that trigger the cyclic guanosine monophosphate (cGMP) production to stabilize the hydrogenosomal membrane, especially in iron depletion conditions (Cheng et al., Reference Cheng, Huang, Huang, Hsu, Fang, Chiu and Tang2015), promoting the intraperitoneal infection.
One of the mechanisms of neutrophils to trap and kill pathogens is through the formation of NETs (Brinkmann et al., Reference Brinkmann, Reichard, Goosmann, Fauler, Uhlemann, Weiss, Weinrauch and Zychlinsky2004; Urban et al., Reference Urban, Reichard, Brinkmann and Zychlinsky2006; Urban et al., Reference Urban, Ermert, Schmid, Abu-Abed, Goosmann, Nacken, Brinkmann, Jungblut and Zychlinsky2009). Previously, our research group observed that neutrophils undergo NETosis in the presence of T. vaginalis in vitro (Huynh and Ávila-Muro, Reference Huynh and Ávila-Muro2015). NETs formation involves a series of steps, which include the generation of ROS by the NADPH oxidase (Fuchs et al., Reference Fuchs, Abed, Goosmann, Hurwitz, Schulze, Wahn, Weinrauch, Brinkmann and Zychlinsky2007; Röhm et al., Reference Röhm, Grimm, D'Auria, Almyroudis, Segal and Urban2014), and the citrullination of histone H3 that converts arginine residues to citrulline (Wang et al., Reference Wang, Li, Stadler, Correll, Li, Wang, Hayama, Leonelli, Han, Grigoryev, Allis and Coonrod2009). This reaction is catalysed by PAD4 (Leshner et al., Reference Leshner, Wang, Lewis, Zheng, Chen, Santy and Wang2012). When we used metformin and Cl-amidine to inhibit both NADPH oxidase and PAD4, we showed an increased T. vaginalis viability up to 43% using metformin, and 86% using Cl-amidine. Throughout those experiments, we demonstrate the importance of NETs participation to control T. vaginalis growth. NETs are capable to capture and kill pathogens such as bacteria and fungus (Brinkmann et al., Reference Brinkmann, Reichard, Goosmann, Fauler, Uhlemann, Weiss, Weinrauch and Zychlinsky2004; Urban et al., Reference Urban, Reichard, Brinkmann and Zychlinsky2006), because the DNA of NETs is associated with histones and granular proteins with antimicrobial activities (Urban et al., Reference Urban, Ermert, Schmid, Abu-Abed, Goosmann, Nacken, Brinkmann, Jungblut and Zychlinsky2009; Papayannopoulos et al., Reference Papayannopoulos, Metzler, Hakkim and Zychlinsky2010; Metzler et al., Reference Metzler, Goosmann, Lubojemska, Zychlinsky and Papayannopoulos2014). However, recent research has revealed that using DNase I to break NETs in assays in vitro does not affect the ability of PMN cells to kill trichomonas in a system free of other immune cells (Rein et al., Reference Rein, Sullivan and Mandell1980; Mercer et al., Reference Mercer, Ng, Brown, Boatman and Johnson2018). Hence the mechanisms involved require further investigations.
Previously it has been described that ROS inhibition in PMN cells interacting with T. vaginalis improves the ability of the parasite to survive (Rein et al., Reference Rein, Sullivan and Mandell1980). These reports suggest that ROS have a direct activity on the parasite and PMN cells undergo apoptosis in the cell–parasite interaction. We eliminate ROS production induced by trichomonas by the inhibition of NADPH oxidase activity (Song et al., Reference Song, Shin, Ahn, Min, Kim and Ryu2008). Nevertheless, our results show that the ROS effect on the reduction of T. vaginalis viability was indirect probably because NETosis could also be inhibited. Our results, based on new knowledge, suggest that NADPH oxidase-derived ROS trigger the NETosis, and the traps are decorated with antimicrobial peptides promoting parasite death. In spite of previous reports suggesting that NETosis has a little contribution on PMN cells on the parasite elimination in vitro (Mercer et al., Reference Mercer, Ng, Brown, Boatman and Johnson2018), we believe that it is very important to consider the participation of other immune cells or antimicrobial peptides present in the NETs during the in vivo infection, as it happens in our model of trichomoniasis. In consequence, it is necessary to elucidate how NETs-antimicrobial peptides contribute to kill the parasite or how NETs catch the parasite while other cells attack and destroy it.
To our knowledge, this is the first report about the relative and total count of immune cells arriving at the early infection of T. vaginalis in an in vivo model, which has allowed us to explore the role that those cell populations play, both individually and as a team during trichomoniasis. Likewise, the implementation of this in vivo model will allow us to investigate the strategies used by the immune cells on the whole organism for parasite clearance.
Supplementary material
The supplementary material for this article can be found at https://doi.org/10.1017/S0031182021001311
Acknowledgements
The authors thank Dr Felipe Padilla-Vaca and Dr Fernando Anaya-Velazquez for their kind donation of T. vaginalis GT-21 strain.
Author contributions
Cuéllar-Mata and Ávila conceived, designed the study and reviewed the manuscript. Rangel-Mata conducted data gathering and wrote the manuscript. Arriaga-Pizano established the antibodies panel for flow cytometry assays and facilitated the FlowCytometer; Reyes-Martínez and Brunck performed the data analysis. Olmos-Ortiz preserved parasite cultures and reactants.
Financial support
Rangel-Mata was supported by a scholarship from CONACyT, México. The project was supported by CONACyT (CB-2012-01 182671) and the Universidad de Guanajuato (CIUG 2016-2017).
Conflict of interest
None.
Ethical standards
All animals were handled according to the Mexican norm NOM-062-1999. Permission for this research was granted by the Ethics Committee of the University of Guanajuato.