



%20--%3e%3c!DOCTYPE%20svg%20PUBLIC%20'-//W3C//DTD%20SVG%201.0//EN'%20'http://www.w3.org/TR/2001/REC-SVG-20010904/DTD/svg10.dtd'%3e%3csvg%20version='1.0'%20id='Layer_1'%20xmlns='http://www.w3.org/2000/svg'%20xmlns:xlink='http://www.w3.org/1999/xlink'%20x='0px'%20y='0px'%20width='64px'%20height='64px'%20viewBox='5.5%20-3.5%2064%2064'%20enable-background='new%205.5%20-3.5%2064%2064'%20xml:space='preserve'%3e%3cg%3e%3ccircle%20fill='%23FFFFFF'%20fill-opacity='0'%20cx='37.785'%20cy='28.501'%20r='28.836'/%3e%3cpath%20fill='%23595959'%20d='M37.441-3.5c8.951,0,16.572,3.125,22.857,9.372c3.008,3.009,5.295,6.448,6.857,10.314%20c1.561,3.867,2.344,7.971,2.344,12.314c0,4.381-0.773,8.486-2.314,12.313c-1.543,3.828-3.82,7.21-6.828,10.143%20c-3.123,3.085-6.666,5.448-10.629,7.086c-3.961,1.638-8.057,2.457-12.285,2.457s-8.276-0.808-12.143-2.429%20c-3.866-1.618-7.333-3.961-10.4-7.027c-3.067-3.066-5.4-6.524-7-10.372S5.5,32.767,5.5,28.5c0-4.229,0.809-8.295,2.428-12.2%20c1.619-3.905,3.972-7.4,7.057-10.486C21.08-0.394,28.565-3.5,37.441-3.5z%20M37.557,2.272c-7.314,0-13.467,2.553-18.458,7.657%20c-2.515,2.553-4.448,5.419-5.8,8.6c-1.354,3.181-2.029,6.505-2.029,9.972c0,3.429,0.675,6.734,2.029,9.913%20c1.353,3.183,3.285,6.021,5.8,8.516c2.514,2.496,5.351,4.399,8.515,5.715c3.161,1.314,6.476,1.971,9.943,1.971%20c3.428,0,6.75-0.665,9.973-1.999c3.219-1.335,6.121-3.257,8.713-5.771c4.99-4.876,7.484-10.99,7.484-18.344%20c0-3.543-0.648-6.895-1.943-10.057c-1.293-3.162-3.18-5.98-5.654-8.458C50.984,4.844,44.795,2.272,37.557,2.272z%20M37.156,23.187%20l-4.287,2.229c-0.458-0.951-1.019-1.619-1.685-2c-0.667-0.38-1.286-0.571-1.858-0.571c-2.856,0-4.286,1.885-4.286,5.657%20c0,1.714,0.362,3.084,1.085,4.113c0.724,1.029,1.791,1.544,3.201,1.544c1.867,0,3.181-0.915,3.944-2.743l3.942,2%20c-0.838,1.563-2,2.791-3.486,3.686c-1.484,0.896-3.123,1.343-4.914,1.343c-2.857,0-5.163-0.875-6.915-2.629%20c-1.752-1.752-2.628-4.19-2.628-7.313c0-3.048,0.886-5.466,2.657-7.257c1.771-1.79,4.009-2.686,6.715-2.686%20C32.604,18.558,35.441,20.101,37.156,23.187z%20M55.613,23.187l-4.229,2.229c-0.457-0.951-1.02-1.619-1.686-2%20c-0.668-0.38-1.307-0.571-1.914-0.571c-2.857,0-4.287,1.885-4.287,5.657c0,1.714,0.363,3.084,1.086,4.113%20c0.723,1.029,1.789,1.544,3.201,1.544c1.865,0,3.18-0.915,3.941-2.743l4,2c-0.875,1.563-2.057,2.791-3.541,3.686%20c-1.486,0.896-3.105,1.343-4.857,1.343c-2.896,0-5.209-0.875-6.941-2.629c-1.736-1.752-2.602-4.19-2.602-7.313%20c0-3.048,0.885-5.466,2.658-7.257c1.77-1.79,4.008-2.686,6.713-2.686C51.117,18.558,53.938,20.101,55.613,23.187z'/%3e%3c/g%3e%3c/svg%3e)
%20--%3e%3c!DOCTYPE%20svg%20PUBLIC%20'-//W3C//DTD%20SVG%201.0//EN'%20'http://www.w3.org/TR/2001/REC-SVG-20010904/DTD/svg10.dtd'%3e%3csvg%20version='1.0'%20id='Layer_1'%20xmlns='http://www.w3.org/2000/svg'%20xmlns:xlink='http://www.w3.org/1999/xlink'%20x='0px'%20y='0px'%20width='64px'%20height='64px'%20viewBox='5.5%20-3.5%2064%2064'%20enable-background='new%205.5%20-3.5%2064%2064'%20xml:space='preserve'%3e%3cg%3e%3ccircle%20fill='%23FFFFFF'%20fill-opacity='0'%20cx='37.637'%20cy='28.806'%20r='28.276'/%3e%3cg%3e%3cpath%20fill='%23595959'%20d='M37.443-3.5c8.988,0,16.57,3.085,22.742,9.257C66.393,11.967,69.5,19.548,69.5,28.5c0,8.991-3.049,16.476-9.145,22.456%20C53.879,57.319,46.242,60.5,37.443,60.5c-8.649,0-16.153-3.144-22.514-9.43C8.644,44.784,5.5,37.262,5.5,28.5%20c0-8.761,3.144-16.342,9.429-22.742C21.101-0.415,28.604-3.5,37.443-3.5z%20M37.557,2.272c-7.276,0-13.428,2.553-18.457,7.657%20c-5.22,5.334-7.829,11.525-7.829,18.572c0,7.086,2.59,13.22,7.77,18.398c5.181,5.182,11.352,7.771,18.514,7.771%20c7.123,0,13.334-2.607,18.629-7.828c5.029-4.838,7.543-10.952,7.543-18.343c0-7.276-2.553-13.465-7.656-18.571%20C50.967,4.824,44.795,2.272,37.557,2.272z%20M46.129,20.557v13.085h-3.656v15.542h-9.944V33.643h-3.656V20.557%20c0-0.572,0.2-1.057,0.599-1.457c0.401-0.399,0.887-0.6,1.457-0.6h13.144c0.533,0,1.01,0.2,1.428,0.6%20C45.918,19.5,46.129,19.986,46.129,20.557z%20M33.042,12.329c0-3.008,1.485-4.514,4.458-4.514s4.457,1.504,4.457,4.514%20c0,2.971-1.486,4.457-4.457,4.457S33.042,15.3,33.042,12.329z'/%3e%3c/g%3e%3c/g%3e%3c/svg%3e)
1. Introduction
The Local Volume Mapper (LVM) is a key program of the Sloan Digital Sky Survey (SDSS-V; Kollmeier et al. Reference Kollmeier, Rix, Aerts, Aird, Alfaro, Almeida and Anderson2025) designed to map
 $\sim$
4300 square degrees of the sky, primarily covering the southern Milky Way, the Large and Small Magellanic Clouds (LMC and SMC), and Local Group galaxies. Located at Las Campanas Observatory, it utilizes four telescopes, one of which is dedicated to scientific observations and is equipped with a 1801-fiber bundle arranged in hexagonal patterns. Each telescope has a 16.1 cm diameter, covering a field of view of
 $\sim$
30 arcminutes. The spectrographs cover a spectral range from 3600 to 9800
 $\unicode{x00C5}$
, with a resolution of R
 $\sim$
4000 at H
 $\alpha$
(Drory et al. Reference Drory, Blanc, Kreckel, Sánchez, Mejía-Narváez, Johnston and Jones2024). The LVM plays a crucial role in understanding in detail, for example: (i) the structure of star-forming regions (Villa-Durango et al. Reference Villa-Durango, Barrera-Ballesteros, Román-Zúñiga, Moran, Ybarra, Méndez-Delgado and Drory2025), the supernova remnants (Sarbadhicary et al. Reference Sarbadhicary, Long, Raymond, Sankrit, Egorov, Roman-Lopes and Blanc2025); and (ii) the physical properties of the ionized interstellar medium (González-Torà et al. Reference González-Torà, Sander, Egorova, Lefever, Ramachandran, Egorov and Josiek2025). See also the contribution by C. Román-Zúñiga. It also enables multi-component studies of galaxies, allowing simultaneous analyses of their different constituents, such as gas and stars, and complementing data from other instruments and surveys, such as Gaia (Gaia Collaboration et al. Reference Gaia Collaboration, Chemin, Clementini, Delgado, McMillan and Romero-Gómez2021), which provides detailed astrometric information. The combined contributions of data offer unique insights into stellar dynamics, feedback processes, and the interstellar medium of these nearby systems.
2. Observations
Data collection for the Magellanic Clouds with the LVM at 100% fill factor requires nine dithering pointings. Observations were carried out mainly in two phases: from August 2023 to May 2024 and from July to November 2024. In Ibarra-Medel et al. (in prep.), after quality control procedures, 1,205 and 389 tiles were selected for the full data analysis of the LMC and SMC observations, respectively.
3. Data Analysis
The data analysis consists of the following steps: (i) data reduction, (ii) cube reconstruction (including 9-point), and (iii) decomposition of the ionized gas and stellar components.
The data reduction process utilizes version 1.1.1 of the LVM Data Reduction Pipeline (LVM-DRP, Mejía-Narváez et al., in prep.). This procedure includes homogenizing detector gains across different channels, correcting for bias and cosmic rays, tracing and extracting fiber spectra with stray-light corrections, and obtaining wavelength solutions. Additionally, the process addresses fiber transmission differences and performs spectrophotometric calibration using standard stars. The individual channels are then combined into a single calibrated spectrum, and astrometric solutions are applied using guide star images.
Next, the raw stacked spectra are reconstructed into a data cube using the 3DCUBEGEN Python package, which improves upon the methodology introduced by Ibarra-Medel et al. (Reference Ibarra-Medel, Avila-Reese, Sánchez, González-Samaniego and Rodríguez-Puebla2019). The 3DCUBEGEN reconstruction process involves three steps: (1) 2D spatial interpolation of fiber fluxes onto a grid, (2) kernel selection based on fiber diameter and dithering pattern, and (3) 3D cube reconstruction, with spectral interpolation. The resulting data cube integrates all spectra from tiles within the observed field of view, enhancing signal-to-noise and preserving spatial information.
Finally, the reconstructed cube is analyzed using the LVM Data Analysis Pipeline (LVM-DAP, Sánchez et al. Reference Sánchez, Mejía-Narváez, Egorov, Kreckel, Drory, Blanc and Méndez-Delgado2025), which is designed to decouple the stellar and ionized gas components from the spectra observed by the LVM survey. It performs a nonlinear fit to derive key parameters such as stellar velocity, velocity dispersion, and dust attenuation. The stellar continuum is modeled using a combination of synthetic spectra, and the strong emission lines are modeled using a parametric method (Gaussian functions), while the rest of the emission lines are modeled using a non-parametric method (weighted momentum). The analysis also handles a broad dynamic range by utilizing a resolved stellar population (RSP) library, which is adapted to create probability distribution functions for physical parameters (these correspond to resolved populations, defined as sets of stars with the same properties in log g, log T, and metallicity), particularly in regions with limited stellar samples. The final output includes stellar physical parameters, decomposition coefficients, and emission-line properties.
4. Methodology and Preliminar results
Once the flux intensity maps for H
 $\beta$
, H
 $\alpha$
, [OIII]
 $\lambda$
5007, [NII]
 $\lambda$
6583, [SII]
 $\lambda$
6717, 6731, and [OI]
 $\lambda$
6300 lines, as well as the equivalent width of H
 $\alpha$
(EW(H
 $\alpha$
)) and the velocity dispersion of H
 $\alpha$
(
 $\sigma_{H\alpha}$
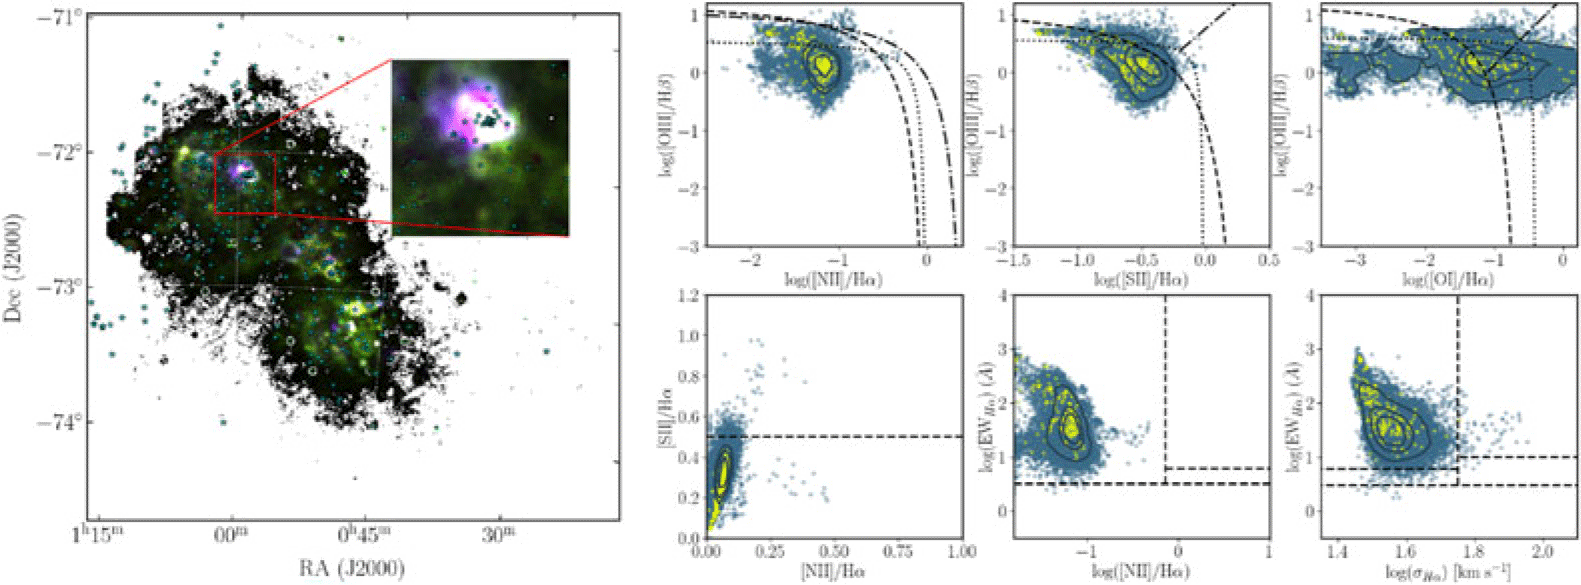
), were obtained, we constructed the corresponding diagnostic diagrams for the Small and Large Magellanic Clouds. Additionally, we used the star catalog of Maíz Apellániz et al. Reference Maíz Apellániz, Holgado, Pantaleoni González and Caballero2023 to select OB star candidates based on the variability on the Gaia DR3 catalog. We cross-matched our candidate list with spectral types from the literature using the SIMBAD database. We obtained 71,038 and 413,405 classified stars for the SMC and LMC, respectively. We then selected only the O-type stars, 305 in the SMC and 1,224 in the LMC to investigate the regions in the LVM maps associated with massive stars. All O-type stars were spatially correlated with the ionized gas maps. In the left panel of Figure 1, we show the correlation for the SMC at the highest physical resolution achievable by the LVM (
 $\sim$
9 pc). In the future, we plan to use a more up-to-date catalog, such as the one presented by Molina-Calzada & Maíz Apellániz Reference Molina-Calzada and Maíz Apellániz2025.
Left panel: Image at a spatial scale of 9 pc, with RGB channels corresponding to the flux intensities of [NII]
 $\lambda$
6583 (red), H
 $\alpha$
(green), and [OIII]
 $\lambda$
5007 (blue), respectively. Blue stars correspond to the positions of O-type stars. Right panel: For each sub-panel, the upper row displays the O3 versus N2 (classic BPT diagram), O3 versus S2, and O3 versus O1 diagrams (from left to right). The bottom row shows the [NII] versus [SII] diagram, the WHAN diagram, and the WHaD diagram (from left to right). Blue points represent all pixels, and yellow stars correspond to gas pixels associated with young O-type stars. In the top panels we used the demarcation lines (black dashed, dot-dashed and dotted lines) described by Kauffmann et al. (Reference Kauffmann, Heckman, Tremonti, Brinchmann, Charlot, White and Ridgway2003), Kewley et al. (Reference Kewley, Dopita, Sutherland, Heisler and Trevena2001), and Espinosa-Ponce et al. (Reference Espinosa-Ponce, Sánchez, Morisset, Barrera-Ballesteros, Galbany, García-Benito and Lacerda2020); while in the bottom panels we used Haffner, et al. (Reference Haffner, Reynolds and Tufte1999), Cid Fernandes et al. (Reference Cid Fernandes, Stasińska, Mateus and Vale Asari2011), and Sánchez et al. (Reference Sánchez, Lugo-Aranda, Sánchez Almeida, Barrera-Ballesteros, Gonzalez-Martín, Salim and Agostino2024). The distributions in all panels are shown as density contours enclosing 15%, 50% and 99% of the pixels, respectively.

In order to illustrate the spatial correlation between stellar positions and the ionized gas maps of the SMC (See right panel in Figure 1), the gas regions associated with the coordinates of O-type stars are indicated as yellow stars in the diagnostic diagrams. A correlation is observed between the positions of the stars and the hardness of the ionized gas (proportion of high-energy photons to low-energy photons), corresponding to the ‘star formation region’ in all six diagnostic diagrams. As a continuation of this work, we aim to characterize sub-samples of O-type stars using photoionization models. Furthermore, we will investigate the physical properties of the ionized gas surrounding massive stars to assess the impact of ionizing photon leakage. Finally, we will study the spatial distribution of stars within clusters and the ionization hardness of stars associated with HII regions or connected to the diffuse ionized gas.
Acknowledgements
A. Z. L. A. acknowledges support from the UNAM Postdoctoral Program and PAPIIT project IG101723. A. W. acknowledges support from UNAM DGAPA PAPIIT IN107725. E. M. acknowledges support by SECIHTI CBF-2025-I-2048 project “Resolviendo la Física Interna de las Galaxias: De las Escalas Locales a la Estructura Global con el SDSS-V Local Volume Mapper” (PI: Méndez-Delgado).
 λ
 α
 λ

 Open access

