

After assuming the governorship of Wisconsin in 2011, Scott Walker worked with his state’s legislature to enact a controversial budget reform agenda that, among other measures, sharply limited the collective bargaining rights of many public sector workers. Progressive advocacy groups and journalists noted that many of the provisions in Walker’s budget bill bore a striking resemblance to policy proposals from a business-backed, conservative group called the American Legislative Exchange Council (ALEC). The budget bill was not the only instance of ALEC legislation in Wisconsin. Both tort reform and telecommunications deregulation bills signed into law by Governor Walker in 2011 drew heavily from model bills developed by ALEC. Footnote 1
By ALEC’s account, Wisconsin is just one example of the group’s influence. ALEC claimed that states enacted 115 bills in 2009 that were based on ALEC proposals (826 were introduced), covering areas as diverse as elections, health care, education, the environment, taxes, and gun rights. As media coverage over the past several years has established, ALEC provides companies the opportunity to work with state lawmakers to draft model bills that are distributed to state legislatures across the country—often with great success for the companies. The New York Times, for example, has concluded that ALEC acts as a “stealth” lobbyist for business, Footnote 2 Bill Moyers opined on an episode of his show dedicated to the group that ALEC is the “most influential corporate-funded political force most of America has never heard of,” Bloomberg Business Week characterized ALEC as a “bill laundry” for corporate policy proposals, Footnote 3 and Fortune called ALEC the big corporate political player “you’ve never heard of.” Footnote 4
I examine ALEC’s influence, arguing that the group provides an important window into business power in American politics, a topic that has long generated debates within political science. Footnote 5 The primary reason ALEC makes such an interesting case is that it is a major avenue through which companies pursue policy change. Businesses as diverse as Amazon, UPS, pharmaceutical firms, private prison operators, Enron, insurance companies, and tobacco manufacturers have all worked through ALEC over its forty-year history to develop and pass legislation across the country. In addition, ALEC operates at the state level, providing an opportunity to examine variation in the legislative success of business across governments embedded in different social, economic, and political contexts. Finally, the structure of ALEC is relatively unusual, providing a case of lobbying that is distinct from other business associations or labor groups since ALEC does not give political contributions or engage in electoral politics. Because of this, ALEC offers a chance to look beyond political campaigning and donations to other mechanisms that businesses use to influence the policymaking process.
In particular, I argue that business interests can take advantage of low policy capacity in state legislatures, offering private policy resources to legislators. By providing pre-written model bills, talking points, and extensive research assistance, businesses can attract support from harried, part-time state officials who are in need of precisely such services. Business influence through low policy capacity should be magnified for lawmakers who are already supportive of business interests. This sort of power is different from the pathways typically described in the business politics literature, which often revolve around campaign donations and other financial inducements, or the structural power that business enjoys in a capitalist economy. I argue that leveraging weak state policy capacity is precisely the strategy that ALEC has employed to influence legislation.
Using a new dataset I have constructed that combines leaked internal ALEC documents with the results of a survey of state legislators (both from 1995), I test this argument and find strong support for my claims. ALEC model legislation was more likely to become law when legislators spent relatively more time on non-policy activities (like campaigning) and less time working on legislation, and had access to fewer legislative resources. “Citizen” legislatures thus appear much more likely to rely on business-drafted bills compared with more professionalized legislatures. ALEC bills were also much more likely to be enacted when legislators viewed business, rather than labor, as their political constituency and when states were governed by conservative lawmakers. I find consistent results in an analysis of another new dataset I assembled of individual legislators who sponsored ALEC model bills in 1995. Ideologically conservative legislators and Republicans were much more likely to propose ALEC bills, as were junior lawmakers who were not in policy leadership positions and thus had access to fewer policy resources. My quantitative results are further buttressed by qualitative evidence I have assembled from a variety of sources, including archival ALEC documents, interviews, and the media record.
Together, the results here engage with a variety of literatures in political science. The paper brings the arguments of Richard Hall and Alan Deardorff Footnote 6 and other interest group scholars Footnote 7 together with the study of business power, which has often neglected non-structural, non-financial, and non-electoral means of influencing legislation, like exploiting low policy capacity. Such a strategy has been a key selling point of ALEC to potential corporate members.
I also speak to the literature on state policymaking, particularly research on state interest groups and policy diffusion. ALEC is an actor that is heavily involved in state interest group “ecosystems,” Footnote 8 bringing resources from national corporations to bear on state legislatures. In so doing, ALEC helps to actively promote policy diffusion across state governments, as lawmakers enact different versions of the same proposals. Footnote 9 While researchers have found other groups that promote model bills across the states, Footnote 10 as I will explain, ALEC’s operations are quite distinct from most other organizations.
My results engage with a growing body of research examining the American political economy as well. Larry Bartels, for example, has shown that the two parties have pursued very different policies at the national level in the postwar era, with Democratic presidents equalizing the income distribution while in office and Republican administrations presiding over growing income inequality. Footnote 11 Similar results have also been identified at the state level. Footnote 12 My paper complements these findings, showing that conservative state governments and state legislators were more likely to introduce and enact ALEC model bills, which policy analysts have argued will generate greater income inequality. Footnote 13 ALEC’s proposals represent one mechanism through which conservative and Republican governments can change the distribution of resources in a state economy.
Focusing on interest group mobilization, Jacob Hacker and Paul Pierson have traced rising economic inequality to changes in the balance of power between business and labor in national politics since the 1970s, Footnote 14 echoing earlier work by David Vogel Footnote 15 and others. Footnote 16 Hacker and Pierson’s work is also buttressed by the careful census of national interest groups performed by Kay Schlozman, Sidney Verba, and Henry Brady. Those authors found that businesses were disproportionately represented in the pressure group system, especially compared to groups lobbying for the public interest and less advantaged citizens. Footnote 17 The account here fits well with those studies, as ALEC is one striking way business mobilized since the 1970s to tilt public policies towards the interests of organized firms. I suggest that scholars of the American political economy, and business power in particular, would do well to shift their focus from Washington, DC, to the states to see how the organizational battle between business and labor has played out through groups like ALEC.
Finally, Larry Bartels Footnote 18 and Martin Gilens Footnote 19 have both highlighted a striking disparity in the responsiveness of legislators to citizens with different incomes. Both researchers have shown that lawmakers tend to be most responsive to the interests of the well-off, to the detriment of their middle- and low-income constituents. To the extent that ALEC represents the preferences of organized business and upper-income citizens, rather than the preferences of lower-income citizens, it could contribute to a representational imbalance in state politics. And independent of the responsiveness of legislators to citizens with different incomes, my results suggest that weak policy capacity and low legislative professionalism have favored the conservative business interests that are associated with ALEC. Footnote 20
What Is ALEC and What Does It Do?
Founded in 1973 by conservative activists, including Paul Weyrich (a co-founder of the Heritage Foundation and the Moral Majority coalition), ALEC was conceived as a group that could promote conservative, pro-business legislation at the state level by bringing private companies together with state legislators. Footnote 21 Today, ALEC reports a membership of about 2,000, largely Republican, state lawmakers (this represents about one-third of all current state lawmakers). Footnote 22 These legislators are joined by several hundred private companies, as well as conservative think tanks and philanthropies. ALEC does not publish the names of its private sector members, but the companies listed on its private-sector board of advisors include PhRMA, Pfizer, Diageo, AT&T, Koch Companies Public Sector, Altria, Exxon, State Farm, and UPS.
ALEC’s public- and private-sector members convene in task forces each year to draft model bills ranging across a diverse set of issue areas. Once a task force authors and approves a model bill, and that model bill is in turn approved by ALEC’s board of directors, ALEC disseminates these proposals through publications, annual events, and its website. ALEC described its task forces in the following way in a 1995 newsletter to its members:
ALEC's National Task Forces serve as public policy laboratories where model legislation and policies are discussed, developed and approved for dissemination to legislators across the country. Task Forces also commission and publish research, write issue papers, and fund workshops at ALEC meetings. As clearinghouses of research, policies and information, they allow members to trade successful strategies and experiences, and provide legislators many opportunities each year to meet with other legislators and their counterparts in the private sector who share their interest in the same issue. Footnote 23
Though ALEC argues that state legislators always have the final say over what model legislation is adopted by the organization, Footnote 24 the New York Times has reported that
The organization’s rules give corporations a great deal of influence on the task forces, where model legislation must first clear a preliminary vote before going to the board. As a result, meeting minutes show, draft bills that are preferred by a majority of lawmakers are sometimes killed by the corporate members at the table . . . ALEC’s bylaws also grant its corporate members greater power over task force appointments. They say lawmakers can be removed from a task force leadership position for any reason, while private-sector members can be removed only “with cause,” like nonpayment of dues. Footnote 25
Private sector members thus appear to have an important veto over what is ultimately drafted and promoted by the group. Indeed, ALEC itself has acknowledged that the main authors of the model legislation are frequently lawyers from its private sector members. According to ALEC’s senior director of policy, “[m]ost of the bills are written by outside sources and companies, attorneys, [and legislative] counsels.” Footnote 26
In general, ALEC’s task forces have recommended model bills to reduce the regulation of business; privatize public sector services; cut taxes, especially for wealthier individuals and companies; and restrict the collective bargaining power and organizing capacity of labor unions, particularly in the public sector. Footnote 27 ALEC’s bills generally coincide closely with the interests of its private sector members. For example, the corporate members of the public safety and criminal justice task force, including the largest private prison firms, have worked to develop and promote legislation that would create mandatory minimum sentences, “three strikes” laws, and “truth in sentencing” laws—all of which would increase the number of incarcerated individuals and thus increase the demand for prison facilities. Footnote 28 Similarly, online educational services providers have drafted ALEC bills requiring public school students to take online-only courses as part of their graduation requirements. Footnote 29 Ammunition and gun distributers also worked through ALEC to promote controversial “stand your ground” legislation legalizing the use of deadly force for self-defense; this same legislation would be referenced in the Trayvon Martin shooting controversy. Footnote 30 And energy companies have pushed for states to weaken their environmental regulations and to hamper efforts to address climate change. Footnote 31
ALEC’s activities are largely financed through its private sector members, who pay between $7,000 and $25,000 in tax-deductible annual dues. State legislators, in contrast, pay $50 each year. Footnote 32 In addition to annual dues, private sector members can pay up to $50,000 for sponsorship of events at ALEC meetings. Footnote 33 As a result, some companies, like AT&T, Pfizer, and Reynolds America, could have contributed as much as $398,000. Footnote 34 ALEC’s system of model bill production and promotion is a key selling point to its private-sector members. One member-only newsletter recounted ALEC’s legislative successes and argued that ALEC made a “good investment” for companies, boasting that “nowhere else can you get a return that high.” Footnote 35
Complementing these benefits for corporate members are an extensive array of services for state lawmakers. ALEC provides legislators with a portfolio of policy ideas that it has developed, with the specific legislative language necessary to implement those proposals. These bills are disseminated through ALEC’s publications and events each year. Footnote 36 All that is left for legislators is to introduce the model bills when they return to their home states. As former Wisconsin state legislator (and later governor) Tommy Thompson recalled fondly: “Myself, I always loved going to these [ALEC] meetings because I always found new ideas. Then I’d take them back to Wisconsin, disguise them a little bit, and declare that ‘It’s mine.’” Footnote 37
In addition to the ideas for legislation, ALEC provides expertise to state legislators. Legislators who have questions about a particular proposal can turn to the task forces that ALEC organizes or to ALEC’s bill tracking and research services. One publication from the early 1990s crowed that ALEC responded to 100 to 200 research requests from state legislators each month, many times offering advice in a matter of hours. Footnote 38 ALEC, according to that publication, was becoming the “first” and “last” call for state legislators when researching policy. Aside from direct research assistance to lawmakers themselves, ALEC offers its members and staff as expert witnesses who can testify on behalf of its model bills (or against opposing bills) in legislative hearings. Footnote 39
ALEC also organizes multiple events each year that provide opportunities for members to learn about specific policy issues. For example, at the 2012 ALEC policy summit, the tax and fiscal policy task force held briefings on public pension and fiscal policy reform, and offered discussions with economists and representatives from a variety of policy groups and think tanks. Footnote 40 Newly elected members are offered special orientations at these summits, too. Footnote 41
Finally, ALEC makes its package of policy ideas and research especially appealing by offering it as part of a broader opportunity for state legislators to meet and network with other political leaders and representatives of major corporations. State legislators’ expenses for these meetings are frequently paid for by the corporate members of ALEC through scholarship funds. Footnote 42 As a further incentive for state legislators to attend ALEC events, elected officials are encouraged to bring their families; ALEC even offers subsidized childcare during the meetings and political training sessions for legislative spouses. Footnote 43 As one corporate member of ALEC put it: “[w]e do a nice job with special events. We just kind of take it on ourselves because I want things to be nice for these guys who make 24,000 dollars a year.” Footnote 44 Indeed, social events at these meetings included parties at MLB baseball games (sponsored by Time Warner), cigar parties (sponsored by Reynolds Tobacco), wine and cheese tastings (sponsored by liquor company Diageo), and gun shooting outings (sponsored by the National Rifle Association). Footnote 45
In sum, ALEC provides businesses with an opportunity to articulate and promote their preferences for public policy across the states, and provides state legislators an opportunity to gain access to policy ideas and legislative assistance provided by those business interests. In the following section, I describe how this relationship serves as an important mechanism for corporate influence and discuss how it fits into debates over business power in American politics.
What ALEC Can Teach Us about Business Power
Political scientists have long been attracted to the study of business power in American politics. A recurring theme is the tension between pluralist and elitist perspectives on business power. Represented best by some of the earlier work of Robert Dahl, Footnote 46 the pluralists argued that business is an interest group like any other, and receives no special treatment within the political arena; other interests and actors can provide a check on the influence of corporations.
Contemporary work in the pluralist tradition includes Mark Smith Footnote 47 and Gunnar Trumbull. Footnote 48 Smith argues that organized business interests tend to win in American politics only when they enjoy support from the public. The issues that business tends to unite around, Smith argues, are precisely the issues that tend to receive the most public attention, and therefore are policy debates in which citizens are well-equipped to hold their public officials accountable. To Smith’s mind, organized business possesses independent power only in so much as it can shape public attitudes. Trumbull makes a congruent claim, arguing that businesses need the support of broad-based citizen groups to succeed in politics.
In contrast to the optimistic assessments of the pluralists is the scholarship from elitists, who argue that business holds a privileged place in politics and is unlike other interest groups. One important reason for this power, according to Fred Block Footnote 49 and the later work of Robert Dahl and Charles Lindblom, Footnote 50 is that businesses are responsible for employment and investment in a capitalist economy. Politicians thus need to appease business interests to maintain a healthy economy. In addition, business also possesses a greater number of easily deployable power resources, especially financial contributions, which it can bring to bear on the policymaking process. Footnote 51 A final important lever that business can exploit, according to elite theorists, is limiting the terms of political debate to avoid even discussing issues that go against business interests. Footnote 52 Jeffrey Winters and Benjamin Page’s work captures the elitist perspective in more recent years; the authors argue that the United States can currently be characterized as a political oligarchy, with wealthy Americans exerting vastly greater control than ordinary Americans in key domains of policy. Footnote 53
Between these two poles is a third set of scholars who argue that neither the pluralist nor elitist perspectives capture the full range of American politics. Rather, this third set of researchers contends that the pluralist tradition describes American politics in some periods and arenas of politics, while elitists are correct in other periods and policies. David Vogel, for example, has argued that business power ebbs and flows, corresponding to the public’s perception of the economy. Footnote 54 Business gains strength when the public perceives the economy as weak, while business loses strength when the public perceives the economy as strong and thus can tolerate more intervention and regulation. Jacob Hacker and Paul Pierson concur with Vogel that business power is a variable, not a constant, arguing that it is conditioned by institutional and economic factors. Footnote 55 Business influence, for example, is maximized when firms can threaten capital flight, such as in a decentralized system of policymaking. Footnote 56 In later work, Hacker and Pierson have also stressed the importance of a strong organized labor movement in checking the power of business. Footnote 57
Here I follow the third set of authors in charting a middle course between elitist and pluralist approaches. Like the elitists, I argue that business power may well be asymmetric, especially when organized labor or other comparable groups are weak and incapable of generating countervailing pressure against business or when legislators are predisposed to supporting business interests. At the same time, following the pluralist perspective, I see business power as flowing not just from business’s structural position in the economy, but also from other more traditional strategies employed by interest groups.
Drawing on the work of Richard Hall and Alan Deardorff Footnote 58 and other interest group scholars, Footnote 59 I argue that one powerful way that businesses can influence the policymaking process is by providing policy resources to legislators who might otherwise lack such resources. Hall and Deardorff argue that lobbying is not about trying to exchange money for votes, or to persuade opposing legislators to change their positions. Rather, effective lobbyists provide “matching grants” of information, talking points, polling, and policy resources to similar-minded legislators to support policy development. Despite offering a persuasive argument consistent with observed interest group behavior, the business power literature has largely not engaged with Hall and Deardorff’s claim about the importance of policy resources and capacity. While rightly calling on researchers to focus more on policy and less on “electoral spectacle,” Hacker and Pierson’s recent work, for example, still emphasizes financial and electoral pressures as the main mechanisms for business influence. Footnote 60
My argument starts from the premise that legislators seek to enact laws, especially if those laws correspond to the preferences of legislators’ constituents, interest group supporters, and their own personal beliefs. Crafting legislation, however, requires a series of costly inputs. These inputs include ideas for legislation, references to relevant scholarly work, research assistance examining the implications of proposed legislation, expert witnesses who can testify in favor of (or against) bills, and polling data about public opinion towards different proposals. I hypothesize that businesses can therefore influence the policymaking process by providing those policy inputs to legislators who would otherwise lack such resources. Corporate interests, in essence, are lowering the cost of passing business-friendly bills relative to the cost of passing non-business friendly bills. Footnote 61 Provided with cheaper business-friendly bills, we ought to see resource-constrained legislators enact more of those bills.
This effect is likely to be especially strong for resource-constrained legislators who are already receptive to business’s proposals, either because of their individual ideology or their interest group or voter constituencies. There may also be a signaling effect at play, too: by drafting model bills and providing related resources, corporate interests can signal to conservative or business-friendly legislators what kinds of policies count as pro-business. Footnote 62 Although others have made similar claims relating low policy capacity to interest group influence, that work has generally not done so in the context of debates over business power, nor has it examined whether low policy capacity affects actual policy outcomes. Footnote 63 I address both of these limitations here.
Interestingly, the predictions from my theory run against other work examining the influence of interest groups in state politics. Lynda Powell, for example, has argued that interest groups are likely to carry more sway in highly professionalized state legislatures where legislators work full-time and have access to a variety of legislative resources. Footnote 64 This is because the value of a seat in professionalized legislatures is higher than the value of a seat in a legislature with fewer resources, and thus the cost of a campaign—and campaign donations—changes accordingly.
But campaign contributions are not the only avenue for corporate influence, and ALEC offers an excellent empirical case to consider the ways that business can leverage non-electoral and non-financial means of influencing legislators by exploiting weak policy capacity. Footnote 65 Although ALEC represents business interests in politics, much like other business and trade associations, its strategies and structure are distinct from most other business groups (and indeed, distinct from most other groups representing labor and progressive issues, too). The first fact that makes ALEC unusual is that it does not appear to engage in elections (with a brief exception in the 1980s), Footnote 66 does not offer political contributions, Footnote 67 and does not generally advertise to the public—unlike groups like the Chamber of Commerce or the National Federation of Independent Business (and unlike most other lobbying groups). Rather, ALEC focuses on disseminating very specific policy proposals to its legislative members.
While other outlets for distributing pro-business state policy proposals exist, what makes ALEC different from such organizations is its size and multi-issue scope, as well as the fact that legislators themselves are directly involved in ALEC’s operations. Although lawmakers may be the targets of groups like the Business Roundtable or the Pharmaceutical Research and Manufacturers of America, lawmakers are not official members of these groups. Indeed, major national business associations (like the pharmaceutical industry association) are often themselves ALEC members, using ALEC as their lever for legislative influence in the states precisely because of ALEC’s unique relationship to state legislators. For example, when the National Restaurant Association sought to stymie paid sick leave measures passed by cities and localities, it worked with ALEC to distribute a model bill preempting such programs. Footnote 68
A final important way that ALEC is distinct from other business groups is that it has not been hampered by the diversity of its membership. Cathie Jo Martin, Footnote 69 Mark Smith, Footnote 70 and Mark Mizruchi Footnote 71 have all argued that the ability of contemporary national business groups to proactively promote policy proposals is severely limited by sectoral divisions and a desire to please all of their members. As Martin sums up, “Because these umbrella [business] groups vie with one another for prestige and members, they tend to ignore activists of any ilk within their ranks. Decision making in these umbrella groups usually entails a least-common-denominator politics; in an effort to offend no one, groups search for neutral positions and seldom move beyond empty platitudes.” Footnote 72
In contrast to these national associations, ALEC has aggressively pursued policies that benefit specific firms from a variety of different sectors. The accommodation of diverse firms is institutionalized in the different task forces that perform the bulk of ALEC’s work. Firms can thus pursue policies that fit with their own interests in each task force, free from the need to appease all ALEC members. ALEC is further aided by the fact that it is not competing with other business groups for its services. Since there are virtually no other groups that can offer firms the same ability to author model bills and disseminate those bills to a broad body of state legislators, ALEC needs to worry less about alienating its membership compared to national business groups that are vying for each other’s members.
In sum, while the interests that ALEC represents are similar to other business groups in politics, it functions very differently from those organizations. ALEC thus matters as an interesting case of business mobilization in its own right, given its success over the past four decades and its unique political structure. It also is an interesting case since it presents an opportunity for closely examining how policy resources matter for business influence.
More practically, ALEC makes for a useful case because of the availability of leaked documentation regarding its model bills. These materials provide an unusually clear picture of the organization’s operations, as well as records of what business interests wanted from state policy behind closed doors. Although the documents I use do not solve the problems associated with pinning down businesses’ first-order (rather than strategic) preferences, or with identifying the causal effect of firms on policy, they do provide richer and more accurate measures of businesses’ preferences and political activities than are often employed in the literature on interest group lobbying or business politics. Footnote 73
When Do Legislators Rely on Business’s Model Bills?
If my theory regarding policy resources were correct, we ought to observe that ALEC was most successful where legislators had fewer resources to dedicate towards policymaking, particularly where legislators were also already supportive of business interests. I assess these predictions across three different datasets I have assembled: a quantitative analysis of the correlates of ALEC bill enactments across the states, a quantitative analysis of the characteristics of individual legislators who authored and sponsored ALEC model bills, and a review of qualitative materials from the group’s members, leadership, and critics.
ALEC Bill Enactments across the States
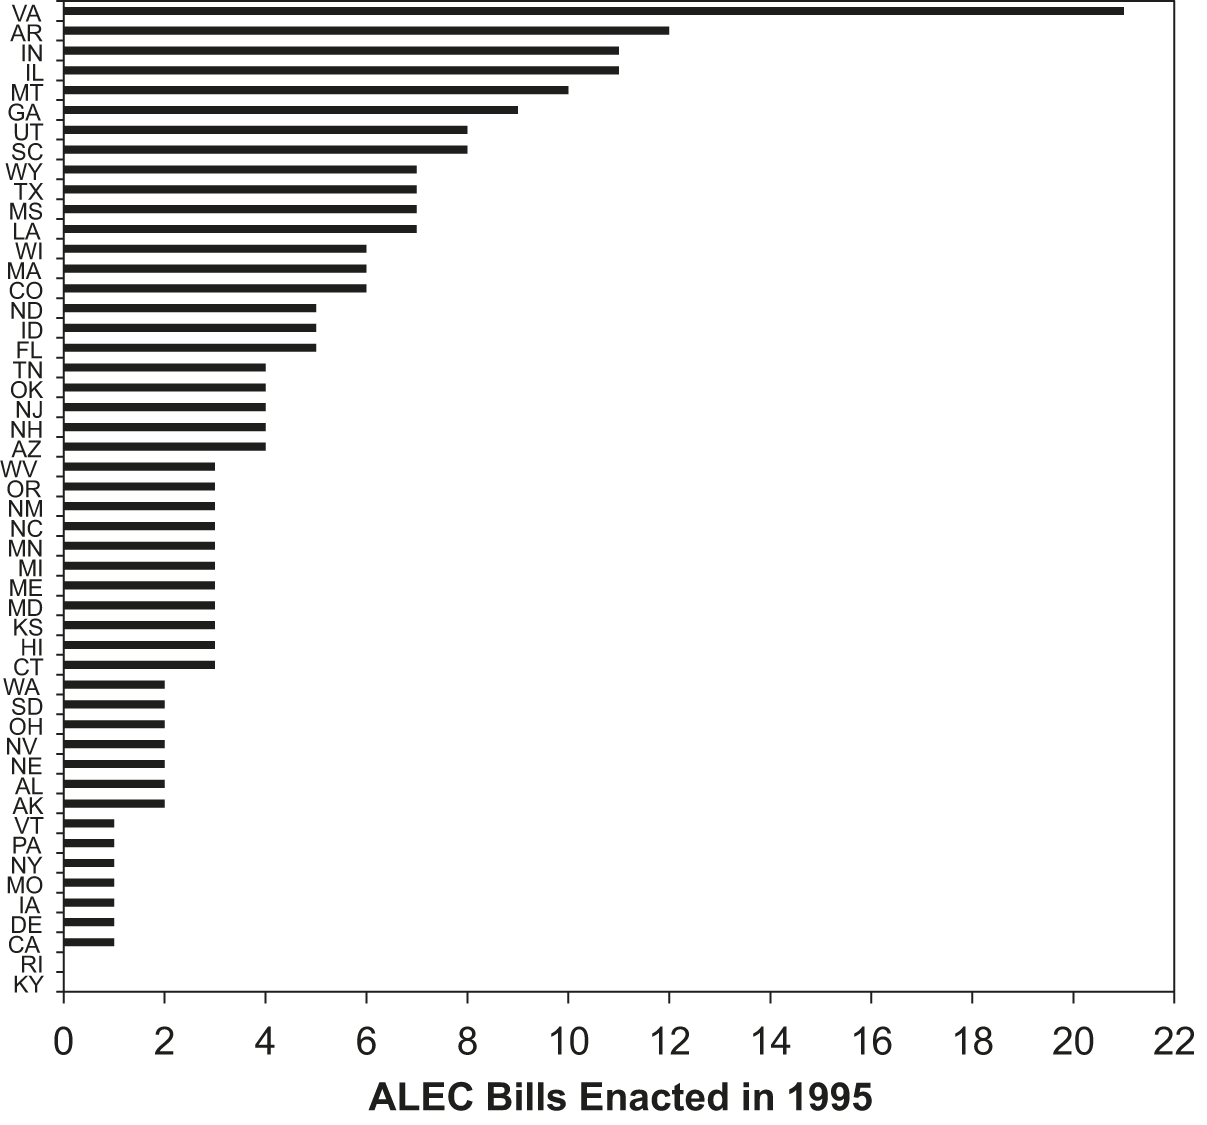
My first analysis looks at the characteristics of states that enacted ALEC bills. My outcome measure in this analysis comes from an internal ALEC publication that lists which states enacted legislation based on ALEC’s model bills in 1995. Footnote 74 Figure 1 shows these bill totals for each state in 1995. In all, ALEC could claim 231 state enactments that year. The states with the most ALEC bill enactments in 1995 included Virginia (with 21 bills), Arkansas (12), Indiana (11), Illinois (11), and Montana (10). The states with the most ALEC bill introductions included Illinois (52 bills), California (41), Hawaii (38), New York (37) and Louisiana (33). The states with especially high success rates—ALEC bill enactments as a share of introductions—included Indiana, Montana, Virginia, and Idaho.
ALEC bill enactments in 1995

To capture the characteristics of state legislators, the main explanatory variables in my analysis, I rely on a survey of state legislators conducted in 1995 by John Carey, Richard Niemi, and Lynda Powell. Footnote 75 With proper weighting the survey is representative of the entire population of state legislators in 1995. The survey included a variety of questions that are highly relevant for my own study. In particular I am interested in three variables from the survey: two tap into the concept of legislative resources and policy capacity, and one captures the interest groups that legislators view as their primary constituency.
To measure the amount of time legislators spent focused on policy-relevant activities, I used legislators’ answers to the question “How much time do you actually spend on each of the following activities?” Respondents used a five-point scale to indicate their time spent on eight different options. I then calculated state averages for policy related activities, which included studying and developing legislation and building cross- and intra-party coalitions for legislation, and non-policy related activities, which included campaigning, casework, constituent communication, and district projects. Footnote 76 I operationalize this variable as the ratio of time spent on non-policy related activities to policy related activities. I expect this variable to be positively correlated with ALEC bill enactments.
To measure the overall level of legislative resources available to state legislators to evaluate and develop public policies, I used an estimate of legislative branch expenditures per legislative member, excluding legislator salaries (expressed in thousands of dollars). This data is from the National Conference of State Legislatures and is included in the 1995 survey dataset. I expect this variable to be negatively correlated with ALEC bill enactments.
Finally, to gauge the organized interests to which legislators are most attentive, I estimated the share of legislators in each state who reported that businesses or labor unions were among their strongest supporters. Footnote 77 The responses to this question are preferable to aggregate measures of group mobilization at the state level (like union density or the number of business lobbyists) because the responses capture legislators’ own perceptions of the interest groups that they see as being most politically relevant; ultimately this perception, and not the actual number or density of groups, is what matters for how legislators incorporate interest group demands into their legislative behavior. Footnote 78 I combine the labor and business supporter questions by calculating the share of legislators with business supporters minus the share of legislators with labor supporters, and expect that this variable will be positively correlated with ALEC bill enactments.
In addition to these three variables, I also include several other measures. I use an index of “legislative professionalism,” as calculated by John Carey and his collaborators, which combines legislator salaries, spending on legislative resources, and the length of the legislative session. Footnote 79 It is a common operationalization of legislative capacity in the state politics literature. Footnote 80 Higher values indicate greater professionalism of a state legislature, and so I expect a negative correlation between this variable and ALEC bill enactments. To capture the ideological orientation of state legislatures, I use an index of state government liberalism produced by William Berry and his collaborators. Footnote 81 Higher values of this index indicate greater liberalism; I expect a negative correlation between this variable and ALEC bill enactments. For parsimony, I report only the results with the government ideology variable, though I find similar results using Democratic control of state government as well.
In robustness check models, I control for lagged state legislative productivity (measured as the average number of bills enacted over the past two legislative cycles). This data is from the Council of State Government’s Book of the States dataset. Footnote 82 I also control for features of a state’s economy, including the unemployment rate (from the US Bureau of Labor Statistics) and state budget conditions (state spending minus revenues as a share of revenues; from the Urban Institute-Brookings Institute Tax Policy Center Footnote 83 ), given that past scholars have argued that economic factors mediate business power. Footnote 84 Finally, I account for public attitudes towards business using the American National Election Studies survey (ANES) from 1994, given that other scholars have attributed an important role for public opinion in shaping business power. Footnote 85 I use the average response to a feelings thermometer on “big business” in each state. Footnote 86 Responses to the thermometer could range from zero to one hundred, with higher values indicating a more favorable attitude toward business. I expect that states whose citizens are more favorable to “big business” will be more likely to enact legislation from ALEC. I estimated the attitudes of citizens toward business in each state using multilevel regression and poststratification (MRP), though I find similar results simply pooling ANES data across the 1990s and averaging by state. Footnote 87
Given that my outcome is a count, I estimate negative binomial models. Footnote 88 I use heteroskedasticity robust standard errors, though my results are similar with bootstrapped standard errors. The unit of analysis in the regressions is a state in 1995, with 49 total observations. There are no ALEC enactment data for Kentucky because that legislature was not in session. While it would be ideal to add many more covariates to my model, I deliberately restrict my set of independent variables given my very small sample size. I also show that my core results hold in more basic models before adding additional variables. Footnote 89
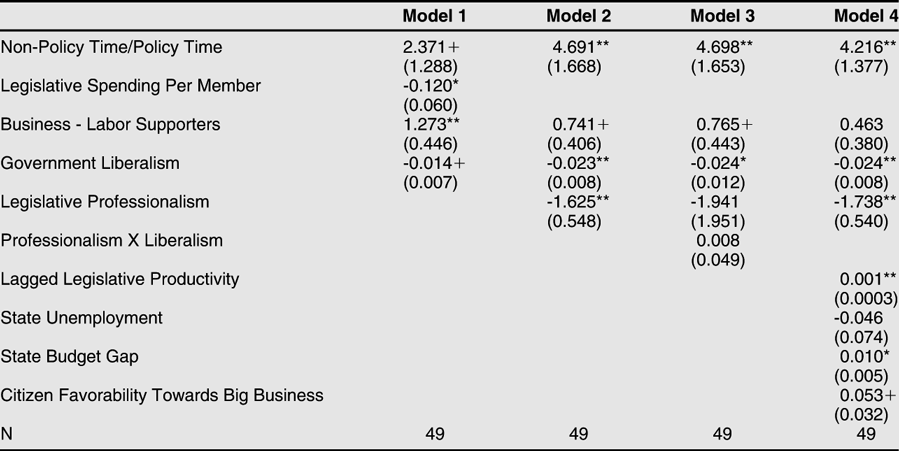
The regression results appear in table 1. Model 1 presents the baseline model; model 2 uses the index of legislative professionalism as a broader measure of legislative capacity; model 3 tests an interactive term between policy capacity and legislator ideology; and model 4 adds additional covariates. The basic models—shown in columns 1 and 2—both indicate that ALEC bills were more likely to be enacted in states where legislators spent less time on policy-relevant activities, where legislators had fewer financial resources to spend on legislative activities, where legislators viewed business, rather than labor, as their main constituency, and where legislators were more ideologically conservative.
Explaining ALEC bill enactments in 1995

All models estimated with a negative binomial regression.
Robust standard errors below coefficient estimates.
Significance levels: + 0.10 * 0.05 ** 0.01
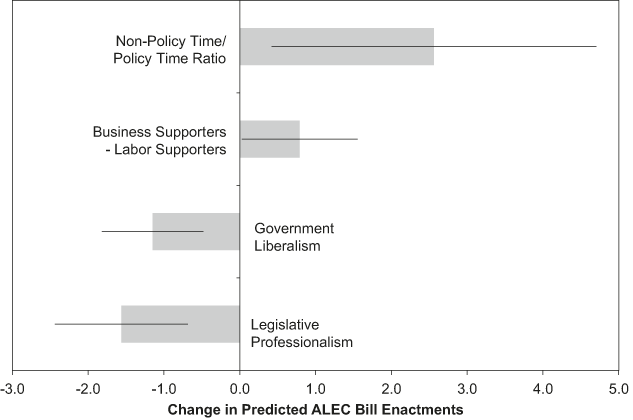
All of the variables in these two basic models are statistically significant at conventional levels of significance and possess sizeable substantive effects. Figure 2 shows the predicted effects of a one standard deviation increase from the means of the four main variables, using data from model 2. Model 2 predicts that legislators spending the least time on policy relevant activities will enact 14 ALEC bills, while legislators spending the most time on policy will enact about two ALEC bills. Footnote 90 As figure 2 shows, a standard deviation increase in time spent on non-policy activities increases ALEC enactments by nearly three bills. Footnote 91 Model 2 predicts that states where the largest proportion of legislators viewed business, rather than labor, as a strong supporter will enact six ALEC bills, while a state with the largest proportion of legislators backed by labor, instead of business, will enact three. Footnote 92 A standard deviation increase in business support for legislators is predicted to increase ALEC enactments by one bill. Footnote 93 Moving to political ideology, model 2 predicts that a state with the most conservative legislature will enact eight bills, while a state with the most liberal legislature will enact three bills. Footnote 94 A standard deviation increase in liberalism is predicted to decrease ALEC bill enactments by one bill. Footnote 95 Finally, a standard deviation increase in legislative professionalism is predicted to decrease the number of ALEC bill enactments by nearly two bills. Footnote 96 To put these predictions in context, consider that the median state enacted three ALEC bills (the mean was five bills).
Predicted effects of policy capacity, legislator ideology, and interest group support on ALEC bill enactments
Note: Predictions from Model 2 in table 1. Figure shows the change in the predicted number of ALEC bill enactments in 1995 associated with a one standard deviation increase from the mean of various variables, holding all other variables at their observed values in turn. Black lines indicate 90 percent confidence intervals for predictions.

Model 3 adds an interactive term between political ideology and legislative professionalism to test whether ALEC influence is magnified under the joint conditions of low policy capacity and ideological conservatism. The interaction term suggests that ALEC bill enactments are indeed especially prevalent in states with low policy capacity and higher pre-existing support for business by state legislators, as indicated by ideological conservatism. The gap between the number of ALEC bill enactments predicted under the highest and the lowest levels of legislative professionalism is eleven in the most conservative state, but only three in the most liberal state (and the latter difference is not statistically distinguishable from zero at conventional levels of significance).
In the final column of table 1, model 4, I assess the robustness of my main findings to a variety of other potential explanations for ALEC’s influence. The variables measuring policy capacity and government ideology continue to be statistically significant even in these more saturated models, though the business support variable is no longer significant at conventional levels of significance. That my results are robust to including lagged legislative productivity addresses concerns that more productive legislatures may simply introduce and enact more ALEC bills compared to less productive states. Similarly reassuring is the fact that my main models are also generally robust to using ALEC bills as a share of all bills enacted in 1995 as my outcome and estimating my regressions using a fractional logit model. Footnote 97
While state unemployment is not correlated with ALEC enactments in model 4, state budget conditions and average citizen attitudes towards big business both are. These findings are consistent with past research indicating a role for public opinion in shaping business influence. They also suggest that fiscal conditions may be an important moderator of business power; ALEC was more successful in states with larger budget gaps.
ALEC Bill Introductions and Sponsorships
The preceding analysis examined the relationship between aggregated characteristics of lawmakers and ALEC legislative successes, but does my theory about policy capacity continue to hold at the level of individual legislators? Such a test is especially important because of the well-known ecological inference problem: conclusions about correlations between aggregated data may not hold for individual level data. Footnote 98 To address this question, I used the 1995 scorecard to identify the ALEC bills passed by each state, as well as the legislators who either introduced or sponsored those model bills, and the total number of bills introduced or sponsored by each legislator using data from LexisNexis State Capital and state legislature historical databases and archival materials.
I next merged these introduction and sponsorship records with the new dataset of state legislator ideological ideal points compiled by Boris Shor and Nolan McCarty. Footnote 99 Because of limitations on the availability of bill sponsorships, as well as Shor and McCarty’s ideal point estimates, I only have ALEC bill sponsorship data for ten states in 1995: Alaska, California, Delaware, North Carolina, South Carolina, Texas, Utah, Vermont, Washington, and Wisconsin. Still, these states represent an interesting crosssection of legislatures with ample variation on both my independent and dependent variables. Slightly more than half of the legislators in my sample (53 percent) authored or sponsored an ALEC model bill. The ALEC bill sponsorship rate in 1995 was highest for legislators in North Carolina and lowest for Alaskan legislators.
If my theory were correct, we ought to observe that legislators who were both ideologically conservative and had access to fewer policy resources would have been more likely to author and sponsor ALEC bills. While Shor and McCarty’s ideal points provide a clear indication of a legislator’s favorability toward conservative policies, measures of legislator-level policy resources are much harder to identify and compile across different states. I settle on using the number of leadership positions a legislator holds on state legislative committees, using data from Carroll’s State Directory supplemented with state legislative records.
This measure has the practical advantage of being relatively straightforward to measure, and is available across all ten states in my sample. Legislators serving as the chair or vice-chair of a policy committee ought to have access to more policy resources and have a lower demand for private policy capacity from ALEC compared to legislators not in such leadership positions for at least two reasons. First, state legislative committees generally have more policy resources compared to the offices of individual members. According to data from 1994–1995, while access to staff for individual lawmakers was highly variable across the states, nearly all states had staff members for standing committees, and these staff members often came from the committee chair’s office. Footnote 100 Second, many legislative scholars have argued that committees and their leaders have a strong incentive to specialize to be effective in the policymaking process. Footnote 101 This means that committee leaders ought to generally have a greater level of policy expertise on the issues relevant to their committees compared to non-committee leaders, further dampening their demand for policy capacity from private groups like ALEC. Footnote 102 I top code this variable at three committee leadership roles or more.
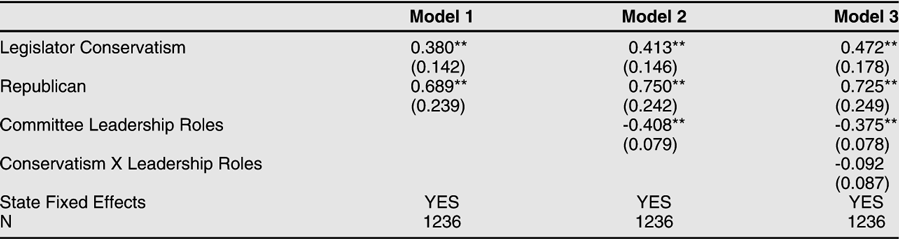
Table 2 shows a series of fractional logistic regressions that test my argument using the individual legislator data. Footnote 103 The outcome is the share of all legislation introduced or sponsored by a particular legislator in 1995 that matches an ALEC model bill, ranging from 0 to 1. On average, about 15 percent of legislators’ sponsored bills matched ALEC legislation in the ten states I examine (the median was considerably lower at 3 percent). I include state fixed effects in all three models to capture state-specific effects, and employ robust standard errors. Model 1 shows the correlation between the share of ALEC bills a legislator used and political ideology and partisanship. Conservative legislators relied on ALEC model bills for a greater share of their total legislation, as did Republicans. Footnote 104 Interestingly, the effect of ideology is much greater than the effect of partisanship. Moving from the most liberal to the most conservative legislator is predicted to increase use of ALEC bills by 22 percentage points, while shifting from a Republican to a non-Republican legislator only increases ALEC bill use by 7 percentage points. Footnote 105 This reflects the fact that a non-trivial number of Democrats and Independents in my sample introduced and sponsored ALEC bills (about 36 percent of non-Republicans). Reliance on ALEC model bills, then, appears to be more of an ideological, rather than a partisan, affair.
Explaining ALEC bill authorship and sponsorship in ten states (1995)

All models estimated with fractional logit regression.
Robust standard errors below coefficient estimates.
Significance levels: + 0.10 * 0.05 ** 0.01
Model 2 adds a variable measuring the number of committee leadership roles held by a particular legislator (top coded at three), and indicates that this variable is negatively related to a legislator’s use of ALEC model bills, as my argument predicts. Junior legislators who hold no policy leadership positions are predicted to rely on ALEC bills for about 17 percent of their legislation, while more senior legislators serving in three or more leadership positions are predicted to use ALEC bills for only 7 percent of their legislation. Footnote 106 In regressions not shown, I find consistent results if I dichotomize the leadership roles variable. Footnote 107
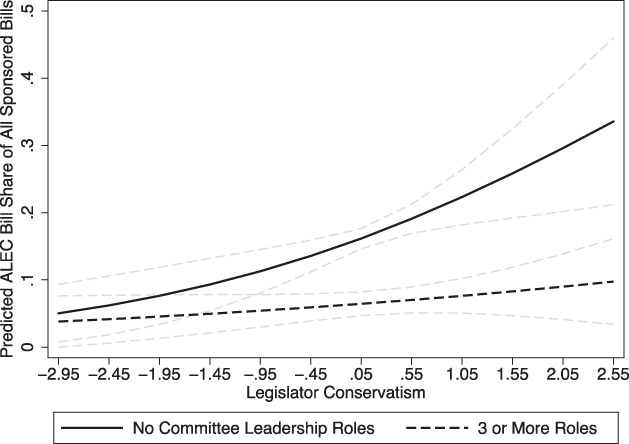
Model 3 tests for the presence of an interactive effect between access to policy resources—as operationalized by committee leadership roles—and legislator ideology. Consistent with the state-level results I presented in the previous section, I find evidence of an interaction within the legislator-level data. Conservative political ideology magnifies the effect of low policy capacity. Figure 3 plots the predictions of ALEC bill use for the joint interaction of legislator ideology and committee leadership roles. There is no statistically distinguishable effect of policy capacity for the most liberal legislators, but as a legislator grows more conservative, the effect of policy capacity increases. For the most conservative legislator, moving from at least three committee leadership roles to no committee leadership roles is predicted to increase reliance on ALEC bills from 10 percent to 35 percent. Footnote 108 The interactive effect holds for the dichotomized version of the committee leadership roles variable, too.
The effect of legislator ideology and access to policy resources on ALEC bill sponsorships
Note: Predictions from Model 3 in table 2, holding all other variables at their observed values. Figure shows the predicted number of ALEC bills introduced or sponsored by a state legislator as a share of all legislation introduced or sponsored by that legislator for various values of legislator conservatism and the number of committee leadership roles held by that legislator. The figure shows that the effect of low policy capacity—as measured by the number of committee leadership roles held by a legislator—on ALEC bill use is magnified at higher levels of legislator conservatism. Gray dashed lines indicate 90 percent confidence intervals for predictions.

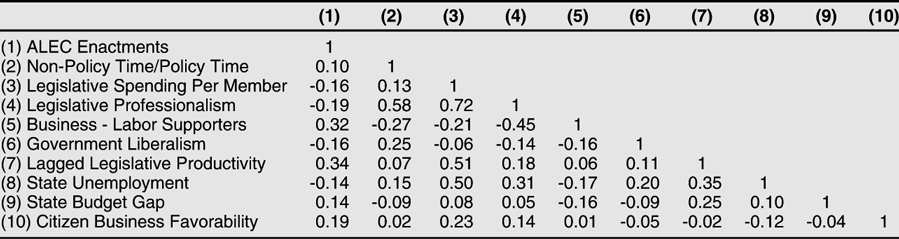
Correlation table for state-level variables

One concern with this analysis is that legislators might introduce or sponsor some ALEC model bills knowing full well that those bills will not pass; those legislators might use ALEC proposals as a form of “cheap talk” to signal their commitment to business. Are my results being driven by such cheap talk, or is there systematic variation in legislators’ reliance on ALEC proposals for substantive legislative activity, too? To answer this question, I repeat my fractional logit regressions on the subset of bills that were eventually enacted in 1995. Those results continue to show a statistically and substantively significant effect for committee leadership roles, and I also find evidence of the interaction effect between ideology and committee leadership roles.
In sum, the analysis of individual legislator behavior closely matches the findings across states, and strongly supports my argument that business influence, as exercised through ALEC, is high when legislators lack policy resources, and especially when those legislators are also more receptive to businesses’ interests.
Evidence from the Historical Record
The quantitative analyses present compelling correlational data, but do we know that legislators would not have enacted ALEC bills had they possessed high policy capacity or if they did not view business favorably? Without finding plausible exogenous variation in policy capacity or business support, I cannot answer this question with quantitative evidence given the fundamental problem of causal inference. The approach I employ here is thus to turn to the historical record for qualitative data that supports the mechanisms implied by my argument.
Perhaps the most compelling evidence in support of the policy capacity argument comes from ALEC members themselves. When asked about his involvement with ALEC in 2012, Oregon state representative Gene Whisnant explained that the group “is ‘a great resource’ for a part-time legislator whose staff is comprised of his wife, who works half-time, and an aide who works three days a week when lawmakers are not in session.” Footnote 109 According to Whisnant, “We have such limited staff that this [ALEC] helps us look at things and consider them.” Such perceptions by ALEC’s legislative members are not new. In a 1981 fundraising letter for ALEC, Virginia state legislator Lawrence Pratt explained that “[a]ny legislator, and particularly those of us in a citizens' legislature like the Virginia General Assembly, gets overwhelmed by the volume of bills that is introduced and voted on . . . I can tell you from experience that even if a legislator tries (and a lot of them don’t) it is simply not possible for one person to read every word of over 1,600 complicated documents in 5 short weeks.” Pratt then made the pitch for ALEC’s services: “For just $4,000 [about $10,000 in 2012 dollars], ALEC can provide the staff needed to read the bills, and then give regular reports to key legislators about what they're being asked to vote for . . . help us secure a conservative research assistant for our legislators.” Footnote 110
ALEC’s leaders also recognized the importance of weak policy capacity in the states. For example, in a corporate grant proposal in the 1980s ALEC argued the following about its services (focusing specifically on economic policy): “[s]tate legislator’s [sic] today are confronted with a wide array of complex tax and fiscal policy issues. A typical legislator must be able to make many important decisions on issues ranging from economic development to increased demands for new and expanded state programs and services . . . Yet, most state legislators lack the staff and resources to be truly informed on all these issues . . . ALEC is uniquely qualified to provide the information services necessary for the success of effective and responsible state tax and fiscal policy.” Footnote 111
A 1985 interview with ALEC’s director, Kathy Teague, discussing ALEC’s effectiveness also confirms this recognition. Teague highlighted the resources the group provided to legislators who would otherwise lack such capacities: “For the great majority of state legislators, being a lawmaker is their second career . . . And so, the need for information is acute. Also in the majority of the states the state legislator has no or very little staff support. In most of the states there is a majority and a minority legislative research office, and that research office has to provide research background information for all of the state legislators in that state.” Footnote 112 In another revealing interview, ALEC’s national legislative chairman explained that state legislators were more receptive to business lobbying groups, such as ALEC, compared to national lawmakers because of the lack of staff at the state level: “I think that state legislators are more accessible than Congressmen; they're very close to the lobbying bodies, trade associations, etc. … Congressmen interact with professional Washington lobbyists through their staffs, whereas State Legislators have a more direct line of communication with actual industry people. This is one advantage or opportunity that business should recognize in the lessening of federal interference through federalism.” Footnote 113
It is not just ALEC members and leadership that acknowledged the linkage between policy capacity and business influence; ALEC’s critics have offered similar assessments. For example, the Natural Resources Defense Council and Defenders of Wildlife—two groups that have been highly critical of ALEC’s role in weakening environmental standards—offered an analysis congruent with the evidence from ALEC itself in 2002: “ALEC exploits a weakness of state legislatures. Forty-one states have only part-time legislators, and 33 of those have no paid legislative staff. Many state lawmakers are overwhelmed by the hectic, often-frenzied pace of annual sessions. ALEC’s ‘model’ bills and packets of background information on key issues frequently shape the supposed solutions to a wide range of state problems and issues.” Footnote 114 And Charles Monaco, a spokesman for the Progressive States Network, a group established to represent progressive state legislators, echoed this sentiment about ALEC’s strengths, stating that “[t]here’s a real need in a lot of legislatures that are not full-time or fully staffed to share best practices.” Footnote 115
Virginia Delegate Patrick Hope combined low policy capacity with the desire of legislators to appear pro-business as an explanation for why even his fellow progressives sometimes introduced or sponsored ALEC bills: “‘I’m co-chair of the Virginia Progressive Caucus,’ said Hope at a 2013 event, ‘I see some of our own members introducing some of these [ALEC] bills that are considered to be pro-business. And you have to take a look back and say: what were they thinking? And because they’ve come in with this model, saying well this is just a pro-business bill, we haven’t heard the other side of how this might impact the workers . . . we don't have the staff, we don’t know what we don’t know, and if we’re only hearing one side . . . it’s easy to get caught and not realize what you’re doing . . . I mean, probably before you even found out what this bill would do, the governor has already signed it, and it’s already law.’” Footnote 116
Assessing the Limits of the Analysis
Although I have leveraged a variety of data and approaches to test my argument, there are several important limitations to the analysis that merit discussion. One concern with my outcome data is that it was produced by the organization that I am studying. This might be problematic if ALEC had an incentive to overstate its influence in order to attract more legislative and corporate members. There are two reasons why I think this bias is not significant. Importantly, the scorecard that I obtained was intended for internal ALEC use. This partially mitigates the incentives ALEC might have to inflate its success rates. Furthermore, the scorecard included the specific names of the ALEC proposals that states had passed in 1995. This permitted me to check a number of states to ensure that they actually passed legislation resembling ALEC proposals. I did this for the ten states that I examined in the legislator-level analysis, and was able to successful match nearly all of the ALEC proposals to actual legislation.
A second concern with my analysis is that I do not include a comparison group for ALEC. In large part this is because there are essentially no other groups representing the left or labor that operate in a similar manner or scale as ALEC, a fact that makes ALEC all the more interesting as an empirical case. ALICE, a new group founded by Joel Rogers, a professor at the University of Wisconsin, aims to remedy this imbalance, but ALICE is hardly a counterweight to ALEC (and, according to ALICE staff, the group is not intended to be a direct counterweight). Footnote 117 Although ALICE offers a bill clearinghouse for state lawmakers, it does not have legislators who are official members, nor does it have the financial resources of ALEC. As I have described, the financial resources of ALEC are important to provide the trips, conferences, and resources that bring legislators together with corporate representatives. ALICE is also relatively new (founded in 2012), compared to ALEC, which has existed for forty years.
In light of the lack of a counterweight to ALEC, can I still argue that low policy capacity favors business interests, especially the conservative interests affiliated with ALEC? I argue that I can because one would be hard pressed to find ALEC bills that labor unions or progressive groups could embrace. Footnote 118 ALEC bills generally represent the opposite of most progressive priorities: weakening labor unions, privatizing public services, weakening environmental and consumer regulations, restricting voter registration and participation, and loosening gun regulations. I thus argue that ALEC bills represent not only a victory for ALEC, and the business interests it represents, but also a loss for labor and liberal groups. So the more legislative successes ALEC enjoys, the more legislative losses we can reasonably assume labor and the left have experienced.
The study of power in the context of a single group can also be justified on theoretical grounds. In an intervention in the community power debate, Jeffrey Isaac argued that the pluralists and elitists were both wrong to limit their scope of inquiry to instances of observed conflicts between actors with different preferences and interests. Footnote 119 Rather, Isaac called on scholars to consider power in structural terms, as the ways in which “enduring social relationships” shape behavioral regularities. One need not observe conflicts in the preferences or interests between a teacher and a student, or between the teacher and other actors, Isaac argued, to say that the teacher is in a position of power relative to the student. Placing my analysis in this framework, one could say that low state policy capacity creates an environment where business is in a position of power relative to legislators, possessing resources that legislators need to create and pass bills.
Another concern is that ALEC bill enactments are not wholly independent events. Like all political organizations, ALEC is strategic and has focused its attention on particular issues and states in different years. For instance, in 1994 ALEC focused considerable attention on crime policy, while in 1997 ALEC proposed an extensive campaign related to state litigation against the tobacco industry. Without having a systematic method of capturing this variation in strategic effort, however, I cannot incorporate it into the quantitative analysis. Still, this sort of strategic bias ought to operate mostly at the level of the states, rather than individual lawmakers, so the supportive results from my analysis of variation across individual legislators helps to mitigate this concern.
Perhaps the most significant limitation is that I only have the scorecard data for one year. Statistically, this limits the power of my analysis given that I have fewer observations for both the state and legislator regressions. But it also creates the worry that my results might be biased if some states chose not to enact model bills in 1995 because they already enacted bills in previous years, or were planning to do so in a following year. If this behavior were distributed randomly across the states, it would not present a problem for my analysis. If, however, states with high policy capacity were disproportionally the states that enacted ALEC bills in previous sessions and thus abstained from enacting more bills in 1995, it would create a spurious correlation between low policy capacity and ALEC bill enactment for the data that I do have.
Two factors help mitigate this bias. First, ALEC’s task forces produce a new set of model bills every year, meaning that even if a state implemented a number of ALEC bills in one year, there would still be a new stock of potential legislation for that state to introduce and enact in the following year. Second, the standout states in 1995 are generally the states that have historically enacted a number of ALEC bills in other years, according to ALEC archives. A publication from 1990, for example, emphasized that Indiana, Virginia, and Georgia were all leaders in enacting ALEC criminal justice legislation. Footnote 120 Similarly, a publication from 1992 listed ALEC’s top states in terms of model bill enactment as Arizona, Virginia, Mississippi, Alabama, Florida, and Texas—all states with high numbers of ALEC bills in 1995. Perhaps most importantly, the 1995 data is correlated with more recent (public) ALEC scorecards. Footnote 121 The Pearson’s correlation coefficient for the 1995 enactments and 2009 enactments is 0.43, and the coefficient for 2008 enactments is 0.21. This suggests that the same states tended to enact ALEC bills throughout the 1990s and 2000s.
Conclusion
How do businesses influence the policymaking process? Much of the past literature on business power has suggested that corporate interests hold sway over American politics because of their structural position in the economy or because of tactical donations and electoral pressures that push legislators to support businesses’ preferred policies. These perceptions in the academic literature, especially the emphasis on political giving, are also shared by many politicians, pundits, journalists, and citizens, who regularly attribute the outsized influence of business in politics to corporations’ large capacity for campaign donations. Footnote 122 The focus on money in politics as the primary mechanism for business influence has only been reinforced by the 2010 Citizens United decision by the Supreme Court, which permitted unlimited (independent) political spending by corporations, associations, and labor unions, as well as the ensuing progressive backlash to the Court’s decision. As political journalist Matt Bai summarized, “The oft-repeated narrative . . . goes like this: Citizens United unleashed a torrent of money from businesses and the multimillionaires who run them, and as a result we are now seeing the corporate takeover of American politics.” Footnote 123
Without directly challenging these perspectives, I illustrate the importance of another, underappreciated mechanism for business influence, especially across the states: weak policy capacity. Faced with constraints on their time and resources, legislators turn to private groups for policy ideas, research assistance, and administrative support. By offering these bundles of policy resources—especially in an appealing manner through free trips and conferences—businesses can have great legislative success, particularly when legislators are already ideologically oriented towards the policies business is promoting. This strategy is likely to be especially successful when groups offering perspectives opposed to those of business are weak or absent.
I have tested this argument by studying the behavior of one specific business group—ALEC—that primarily engages in policy capacity-related lobbying across the states, allowing me to isolate these mechanisms from other avenues of influence through elections or donations. Indeed, the appeal of ALEC to many corporate interests was a realization that the states represented an untapped opportunity for businesses to build relationships with lawmakers who were looking for new legislation and in need of policy resources. Footnote 124 I find strong support for the policy capacity arguments in the new datasets I have assembled: ALEC bills were more likely to be enacted in states where legislators had access to fewer policy resources, and ALEC bills were more likely to be introduced and authored by junior legislators with less policy expertise. Consistent with the notion that policy capacity interacts with prior ideological convictions, I also find that ALEC bills were more likely to be introduced and enacted by conservative legislators under conditions of low policy capacity.
Together, my findings suggest that citizens, advocacy groups, and journalists interested in understanding the role of business in politics ought to focus on policy capacity, in addition to the usual suspects of political contributions and electoral campaigns. They also suggest that scholars and citizens concerned with economic and political inequality ought to pay just as much attention to the states as to the federal government. As ALEC demonstrates quite vividly, the battles between organized business and labor are just as pitched—and consequential—in American statehouses as they are in Washington, DC. The need for greater attention to businesses’ role in state policymaking is further underscored by the fact that the decision by corporations to mobilize in state government was a strategic one; corporate representatives and ALEC staff recognized that they possessed strategic advantages in statehouses that they otherwise lacked in national politics (recall, for example, the quote from ALEC’s national chairman describing how state legislators were more receptive to business interests than national lawmakers).
Although ALEC’s structure may be unique, my arguments about policy capacity could still apply to other business groups, a proposition that warrants future investigation. It may well be that while ALEC occupies one end of the spectrum of policy capacity-based lobbying, other groups like the Chamber of Commerce or trade associations exploit low policy capacity too, in addition to other, more traditional political strategies associated with businesses. Given that policy capacity in the national Congress is considerably higher than in most states, we might expect that policy capacity-based lobbying will be more prevalent in state, rather than national, business campaigns. Examining when and why businesses deploy these different strategies and how they complement one another, especially across different policy domains and arenas of policymaking, would be an especially fruitful avenue for research.
It is also worth researching the effects that ALEC may have on businesses, in addition to legislators. By keeping its corporate members abreast of policy issues in different states, ALEC could help mobilize firms to take on issues that those firms might not otherwise have addressed. What is more, given findings that participation in business associations can change firms’ preferences, Footnote 125 researchers should examine whether ALEC exerts an independent causal effect on firms’ behavior, too. For instance, ALEC could have contributed to the shift in corporate political activity away from policies that benefit the overall economy to policies focused on particular firms and sectors. Footnote 126
A final line of research might investigate how ALEC fits into the broader mobilization of business and conservative groups since the 1970s. For instance, journalists have noted that ALEC’s model bills closely match the research and commentary of conservative think tanks associated with a group called the State Policy Network. Footnote 127 Tracing the evolution and operation of these networks, especially in comparison with their counterparts on the left, and in comparison to such coalitions in other countries with other institutional arrangements, would greatly illuminate our understanding of corporate political mobilization.
More than four decades ago, political scientists engaged in a path breaking debate over the nature and distribution of political power in American democracy, including substantial research on the role of business in politics. Rather ironically, that debate occurred against a backdrop of remarkable economic equality, and all but ended as the United States entered an era of dramatic disparities in wealth and income. Now, as scholars and citizens grapple with the causes and consequences of economic inequality for American democracy, questions of business power—and careful investigations into the strategies, structure, and success of groups representing corporate interests, such as ALEC—should return to the forefront of research on the American political economy.