Introduction
Bilinguals face the need to constantly maintain, manage, and select from, multiple languages. This has led to the claim that the constant practice in doing so might convey broader advantages in executive functions (EFs), i.e., those skills required to set, maintain and switch between goals, inhibit inappropriate stimuli and responses, make decisions, etc. Positive evidence for such a “bilingual advantage” (BA) has been reported in studies with children (e.g., Bialystok & Martin, Reference Bialystok and Martin2004), young adults (e.g., Costa, Hernández & Sebastián-Gallés, Reference Costa, Hernandez and Sebastian-Galles2008), and older adults (e.g., Gold, Kim, Johnson, Kryscio & Smith, Reference Gold, Kim, Johnson, Kryscio and Smith2013) in a variety of EF tasks (see Bialystok, Reference Bialystok2017, for a comprehensive overview). More recently, however, the hypothesis of a BA has come under severe attack. Most prominently, Paap and colleagues (e.g., Paap & Greenberg, Reference Paap and Greenberg2013; Paap & Liu, Reference Paap and Liu2014; Paap, Reference Paap2014, Reference Paap2015; Paap, Johnson & Sawi, 2014, Reference Paap, Johnson and Sawi2015; Paap, Myuz, Anders, Bockelman, Mikulinsky & Sawi, Reference Paap, Myuz, Anders, Bockelman, Mikulinsky and Sawi2017) have highlighted a substantial range of weaknesses in research on BA, including a confirmation bias, publication bias (the tendency to leave results unpublished which would contradict the claim), statistically underpowered studies, and widely cited yet unreplicable studies. Hence, at present the possibility has to be seriously considered that executive advantages conveyed by bilingualism “. . .either do not exist or are restricted to very specific and undetermined circumstances” (Paap et al., Reference Paap, Johnson and Sawi2015).
Determining the specific circumstances under which a BA reliably emerges has proven elusive. Executive functions are widely held to fractionate into dissociable components. According to the widely popular framework by Miyake and colleagues (Miyake, Friedman, Emerson, Witzki, Howerter & Wager, Reference Miyake, Friedman, Emerson, Witzki, Howerter and Wager2000; Miyake & Friedman, Reference Miyake and Friedman2012), three components can be distinguished: inhibiting, shifting/switching, and updating. All of these, separately or in conjunction, might be affected by a BA, and indeed studies have reported such advantages. For instance, in classic tasks thought to measure inhibitory control such as the Simon task, bilingual children (Martin-Rhee & Bialystok, Reference Martin-Rhee and Bialystok2008) and adults (e.g., Bialystok, Craik, Klein & Viswanathan, Reference Bialystok, Craik, Klein and Viswanathan2004) have been reported to show smaller congruency effects (i.e., interactions between attended and irrelevant dimension) than monolinguals, which presumably reflects bilinguals’ enhanced ability to suppress irrelevant information. However, the empirical evidence is far from clear (see Hilchey & Klein, Reference Hilchey and Klein2011, and Paap & Greenberg, Reference Paap and Greenberg2013, for overviews), with a large number of studies showing very similar congruency effects in mono- and bilinguals. A selective BA in task shifting/switching has also been reported (Prior & MacWhinney, Reference Prior and MacWhinney2010) but this effect was difficult or impossible to replicate in subsequent studies (Paap et al., Reference Paap, Myuz, Anders, Bockelman, Mikulinsky and Sawi2017). Updating captures a working memory component of EF, and again the array of empirical findings concerning a potential BA is complex (see Calvo, Ibáñez & García, Reference Calvo, Ibáñez and García2016 for a recent review). Finally, an additional and perhaps broader aspect of EF is variously referred to as “monitoring” or “attentional control”. This refers to the ability to maintain focused attentional control on a given activity, and a BA in monitoring should primarily manifest itself in a “global RT advantage” on various experimental tasks, i.e., overall faster response times and/or higher accuracy for bilinguals compared to monolinguals. Such global effects have indeed been reported, for instance in the Flanker task (e.g., Costa et al., Reference Costa, Hernandez and Sebastian-Galles2008) but again contrast with null findings (e.g., Paap & Greenberg, Reference Paap and Greenberg2013). Overall, as highlighted by Paap and colleagues (e.g., Paap et al., Reference Paap, Johnson and Sawi2015) and others, rather than reflecting a broad EF advantage, the BA might be elusive to capture and probably quite specific to particular components of EF and task contexts.
The bulk of the literature on the BA in young adults is based on measurement of response latencies, and recently Zhou and Krott (Reference Zhou and Krott2016a, Reference Zhou and Krott2016b) highlighted a fact that might account for at least some of the empirical inconsistency. It has long been known that human response latencies have a rightward skew, with a relatively long tail end of slow responses. In studies on reaction times, data trimming is typically performed, with long response times being deleted from analysis based on some absolute or relative criterion (Heathcote, Popiel & Mewhort, Reference Heathcote, Popiel and Mewhort1991; Ulrich & Miller, Reference Ulrich and Miller1994; Van Selst & Jolicoeur, Reference Van Selst and Jolicoeur1994). Zhou and Krott tested the possibility that a BA resides specifically in the tail end of relatively slow responses. The logic is that if the BA emerges as a broad attentional enhancement, then bilinguals should have a reduced tail end of latencies, relative to those found in monolinguals. If so, then overly aggressive data trimming might obscure a BA that emerges only if data trimming is less severe. Indeed, Zhou and Krott (Reference Zhou and Krott2016a) showed this to be the case: in a review of 68 experiments from 33 articles with three commonly-used interference tasks (Simon, Spatial Stroop and Flanker), studies which included longer responses in their analysis tended to find a BA, whereas those with more severe data trimming did not. Zhou and Krott (Reference Zhou and Krott2016b) provided a more direct exploration of the possibility that the BA might primarily emerge in the form of a reduced tail end of response latencies. They compared English to Chinese–English participants in three interference tasks (Flanker, Simon, and Spatial Stroop), and performed a so-called ex-Gaussian analysis on response latencies. This technique (Heathcote, Brown & Cousineau, Reference Heathcote, Brown and Cousineau2004) involves decomposing response latencies into two separate components: a normally distributed portion (μ) consisting of the bulk of response times, and an exponentially distributed portion (τ) corresponding to the right tail end. The authors found that mono- and bilingual participants exhibited comparable effects of stimulus-response congruency on the Gaussian part of response distributions. Critically, however, a BA emerged in the distribution tail, with reduced tails for bilingual speakers particularly in the more demanding incongruent condition. This pattern was interpreted as reflecting enhanced ability for attentional control in bilinguals compared to monolinguals.
Exploring the bilingual advantage via response dynamics
Zhou and Krott's (Reference Zhou and Krott2016a, Reference Zhou and Krott2016b) work makes the broader point that response latencies might, under certain circumstances, obscure a genuine BA. In the current work, we pursued a different approach, namely the measurement of response dynamics of computer mouse movements. In psychological studies, key-press responses represent the discrete end state of a complex chain of processing stages, and reflect the time it took the individual to arrive at a decision. However, modern cognitive theories conceive of processing as a continuous, graded state in which mind, body and environment interact (e.g., Spivey & Dale, Reference Spivey and Dale2004). Motor responses are part of a complex feedback system in which actions dynamically link to underlying cognitive states (e.g., Freeman, Dale & Farmer, Reference Freeman, Dale and Farmer2011; Spivey, Richardson & Dale, Reference Spivey, Richardson, Dale, Morsella, Bargh and Gollwitzer2009). The mousetracking methodological paradigm captures this dynamic interplay between cognition and action and better reflects the underlying cognitive processes. In a typical mousetracking paradigm, participants initiate a trial by clicking on a “Start” button at the bottom of the screen. A target display is shown in the centre of the screen, which participants are asked to categorise, and participants indicate their response by moving the mouse to, and clicking on, one of two response areas in the upper left and right corners of the screen. Mouse position is continuously recorded, and various measures of the response trajectory can be computed. These include movement initiation time (time interval until participants began moving the mouse) as well as response latency (time required to move the mouse to a response area and click on it). However, perhaps more interestingly, the curvature of the trajectory itself can be measured (as well as the velocity and acceleration of the response).
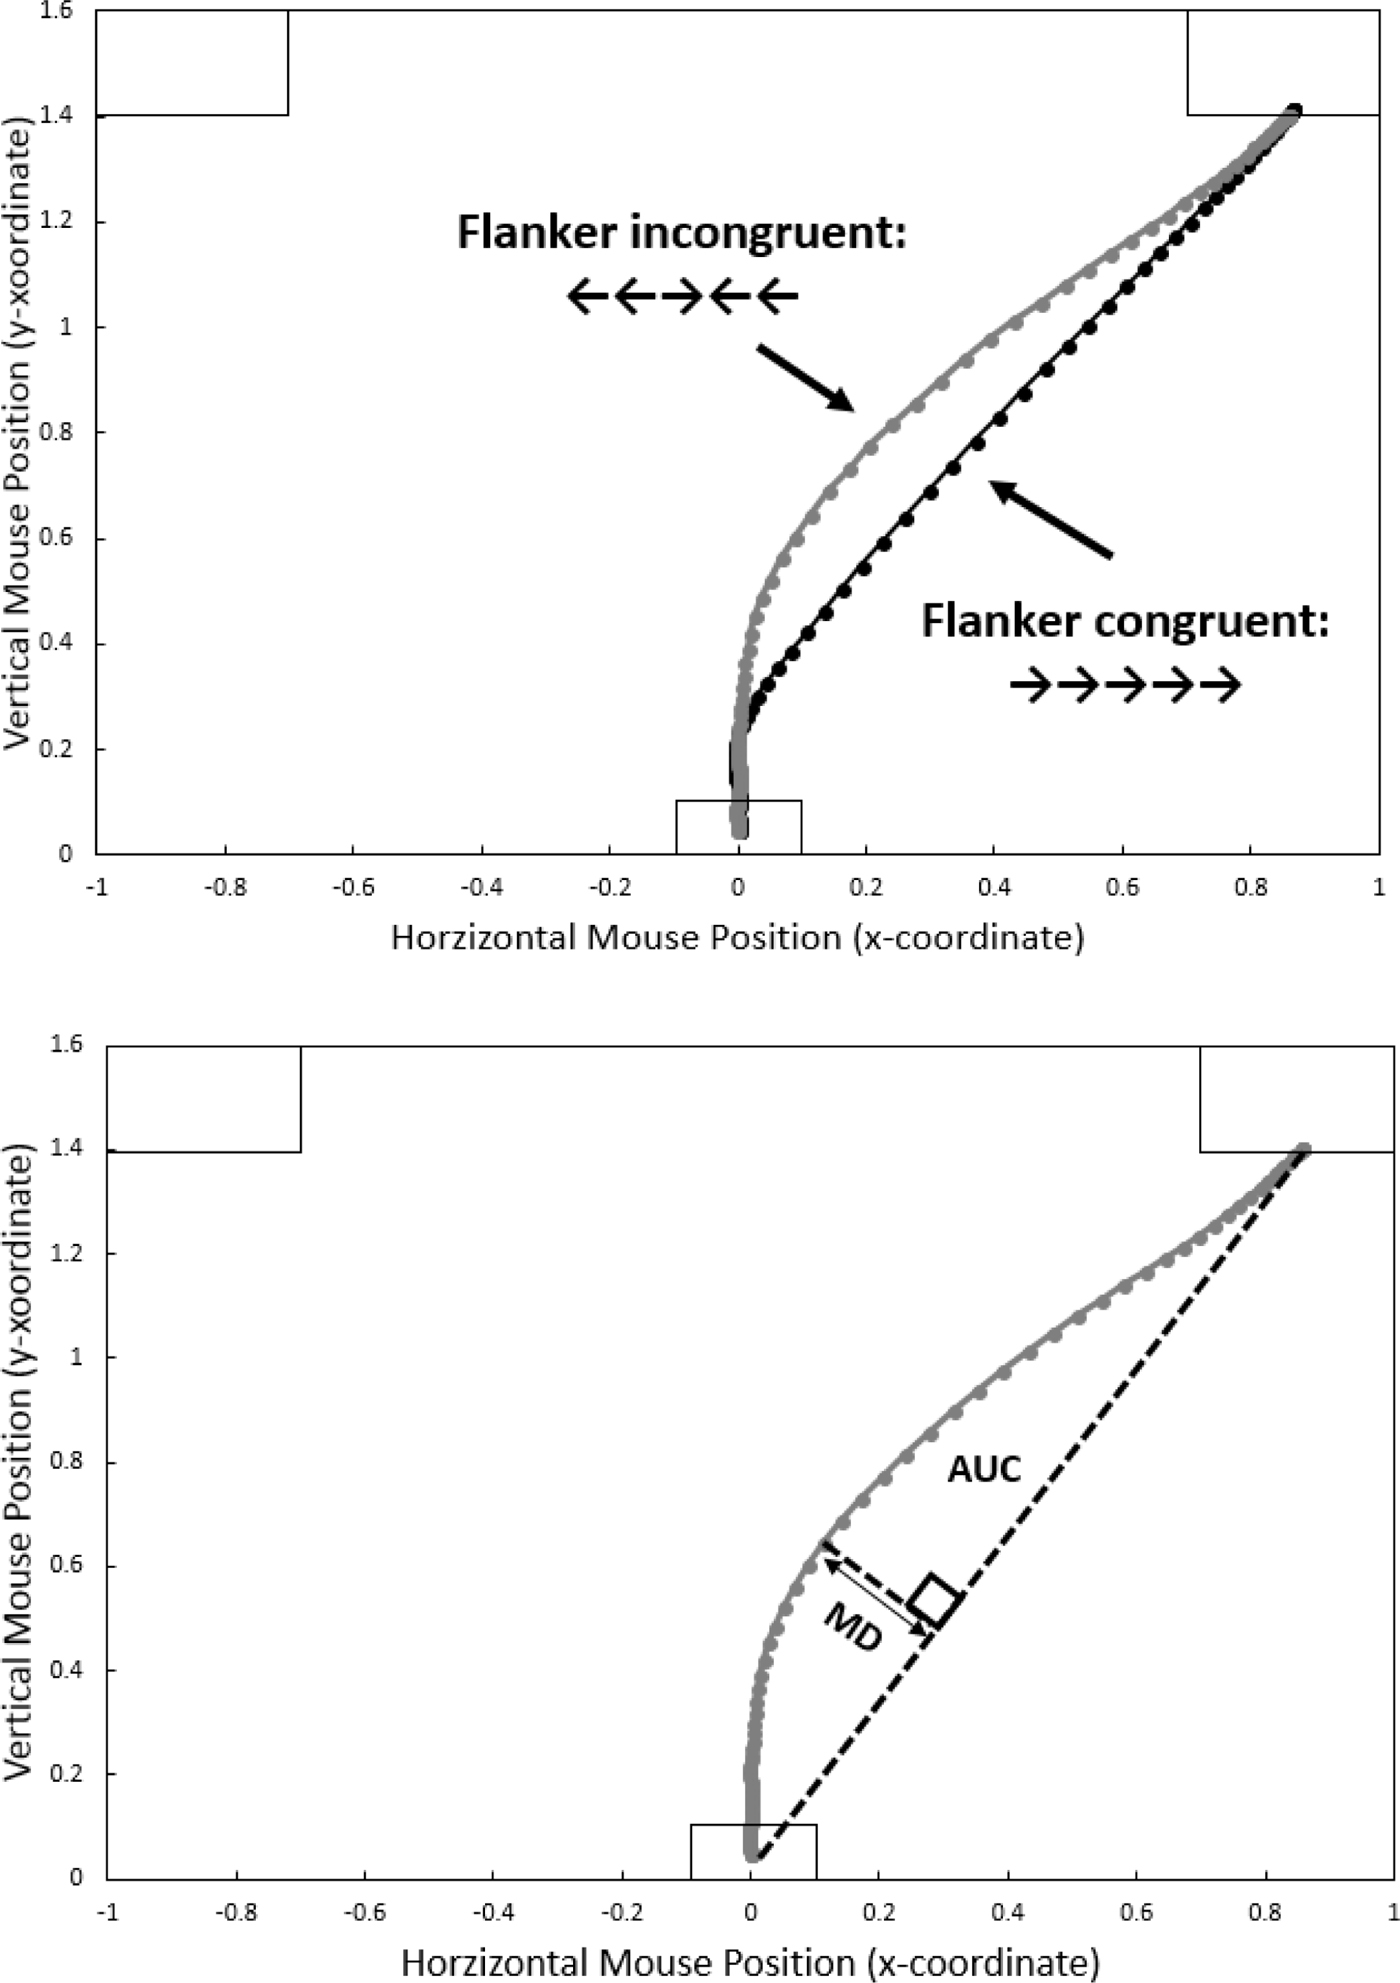
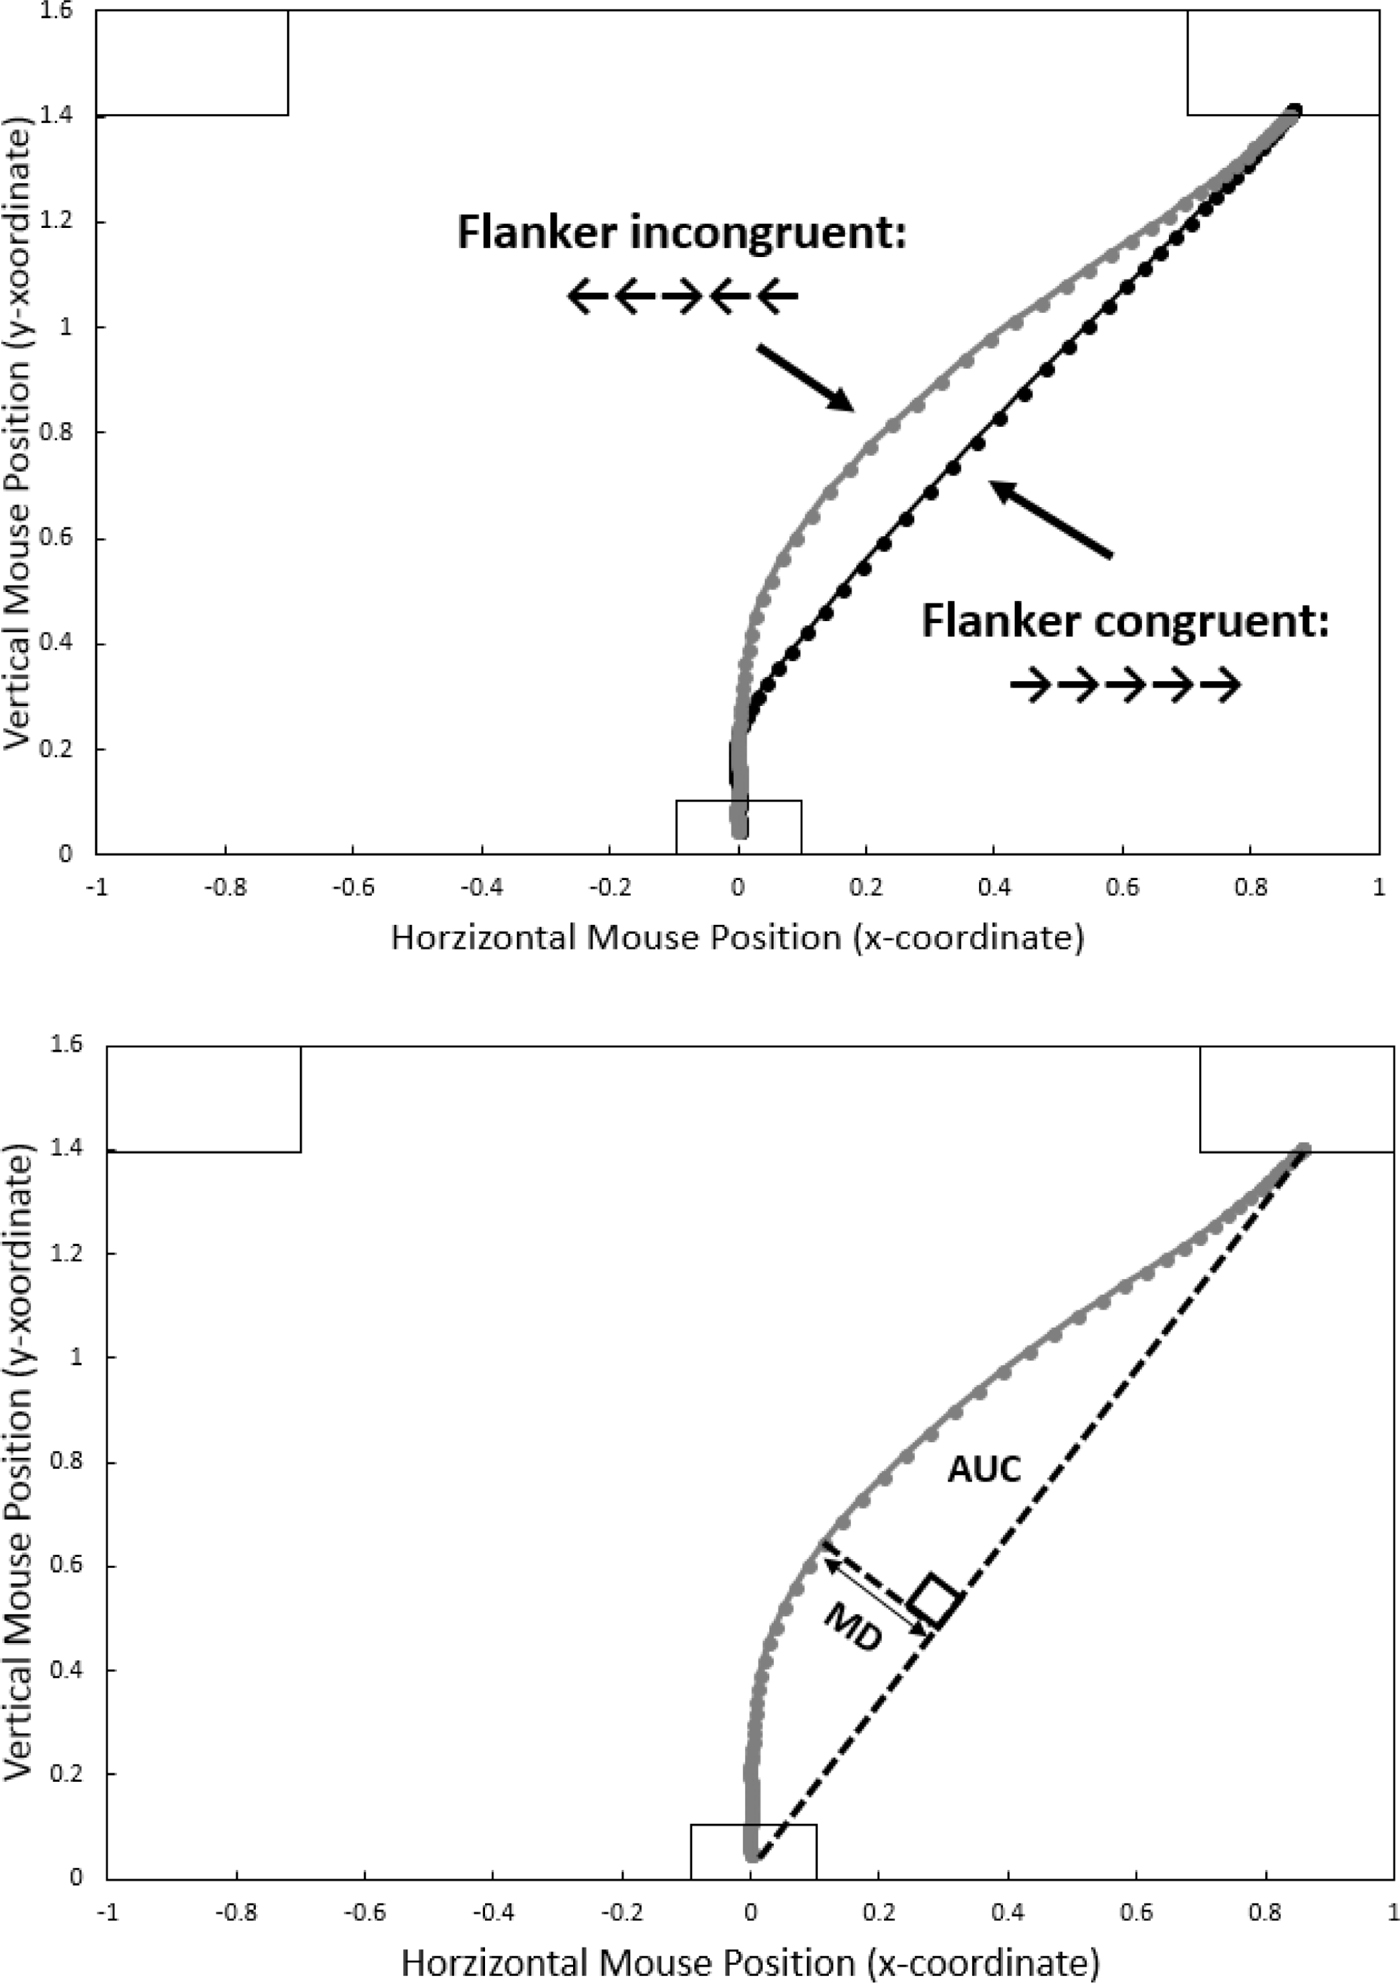
Figure 1 (top panel) demonstrates this approach via results from a Flanker task. The two lines represent average trajectories for the two experimental conditions (“congruent”: the flanking arrows point in the same direction as the central target arrow; and “incongruent”: the flanking arrows point in the wrong direction). As is commonly done when analysing mousetracking data, leftward trajectories have been horizontally remapped to appear pointing rightward. The difference is visible to the naked eye: average congruent trajectories proceed in a fairly straight path from start to response button, whereas average incongruent trajectories exhibit a deflection toward the incorrect response. This “spatial attraction” can be characterised by drawing an idealised response trajectory, i.e., a straight line from start to response button (see Figure 1, bottom panel). Maximum Deviation (MD) can be computed as the largest perpendicular deviation between the actual and the idealised trajectory. The Area Under Curve (AUC) is the geometric area between the actual and the idealised trajectories. Both MD and AUC are typically used interchangeably, but according to Freeman and Ambady (Reference Freeman and Ambady2010, p. 230), MD might be a better indicator for maximum attraction whereas the AUC is a better indicator of the overall attraction towards the unselected alternatives.
Representative results from a Flanker task. On each trial, the starting position of the mouse is at the bottom centre of the screen, and participants carry out a response by moving the mouse towards, and clicking on, one of two response fields in the top left and right corners of the screen. Top panel: Average mouse movement trajectories for the incongruent (grey line) and congruent (black line) condition. Leftward responses have been re-mapped to appear rightward. Dots represent normalised time steps (101). Bottom panel: measures of “spatial attraction”. For a given trajectory, Maximum Deviation (MD) is the largest perpendicular deviation between the actual and an idealised trajectory between starting and response position. Area Under Curve (AUC) is the geometric area between the actual and the idealised trajectory.
If in tasks of this type, individuals first completed their decision, and only then initiated the response, trajectories should be unaffected by the experimental manipulation and should be close to the idealised straight trajectory. The fact that trajectories tend to reflect experimental manipulations instead suggests that decision making “cascades” into motor execution (see Lepora & Pezzulo, 2015, for a theoretical perspective). Hence, analysis of mouse movements provides an important tool to gain insight into the decision making process. Based on this logic, the mousetracking technique has recently been used successfully in studies of language (e.g., Tomlinson, Bailey & Bott, Reference Tomlinson, Bailey and Bott2013), prospective memory (e.g., Abney, McBride, Conte & Vinson, Reference Abney, McBride, Conte and Vinson2015), decision making (McKinstry, Dale & Spivey, Reference McKinstry, Dale and Spivey2008), social cognition (e.g., Freeman & Ambady, Reference Freeman and Ambady2009), and other research domains. Freely available software such as MouseTracker (Freeman & Ambady, Reference Freeman and Ambady2010) makes trajectory measurements straightforward.
We are aware of only two studies so far which have explored a potential BA via mousetracking, and these studies have revealed intriguing results. First, Incera and McLennan (Reference Incera and McLennan2016) constructed a version of the Stroop task in which, rather than naming the colour of the target, participants classified four colours into two responses (e.g., click on left response area if colour is blue or green; click on right response area if colour is red or yellow). Three group of participants were compared: English monolinguals, English–Spanish bilinguals, and English–Other bilinguals. Two group differences were found; first, bilingual participants showed slower response initiation times than the monolingual control group. Second, bilinguals carried out faster movements, as evidenced by an analysis that centred on the x-coordinates (i.e., the horizontal component) of the movements, and explored the slope of the rise in x-coordinates across time (“growth curve”, Mirman, 2014). Overall, compared to monolinguals, bilinguals delayed mouse movement initiation, but then compensated with a more efficient response. According to the authors, the processing style of delaying, and then carrying out an efficient response, is what characterises experts in various domains, particularly in athletic disciplines. Hence, “bilinguals behave like experts”. Although the authors did not report response latencies in their Stroop task, their findings open up the intriguing possibility that a BA obscured in response latencies may be revealed through response dynamics of mousetracking.
Second, in a very recent article that appeared only after the work reported here was conducted, Incera and McLennan (Reference Incera and McLennan2017) explored the joint effects of various degrees of bilingualism and age on cognitive control. Age is commonly associated with a loss of cognitive control, and it has previously been suggested that bilingualism might provide a “cognitive reserve” which to some degree protects against this loss (e.g., Bialystok et al., Reference Bialystok, Craik, Klein and Viswanathan2004). A bilingual Stroop task and a Flanker task were used as measures of cognitive control, and participants from various age bands (from 18–60+ years) and with varying levels of bilingualism were recruited. Both Flanker and Stroop effects emerged in response latencies. As evidenced by growth curve analysis (see previous passage), the Stroop effect was reduced with increasing levels of bilingualism, and enlarged with increasing age, but the two variables had additive effects (contrary to e.g., Bialystok et al., Reference Bialystok, Craik, Klein and Viswanathan2004, but in line with more recent findings such as Zahodne, Glymour, Sparks, Bontempo, Dixon, MacDonald & Manly, Reference Zahodne, Glymour, Sparks, Bontempo, Dixon, MacDonald and Manly2011). In the Flanker task, growth curves were affected neither by bilingualism nor by age. The discrepancies in outcomes between the two tasks were discussed by the authors in terms of potential differences in difficulty, verbal vs. nonverbal characteristics (the Stroop task included colour words), and involvement of different executive components.
The present study
In the present study, we compared English monolinguals to Chinese–English bilinguals in their performance on three “standard” interference task: Flanker, Simon, and Spatial Stroop. We adapted tasks, procedure and design as closely as possible from Zhou and Krott (Reference Zhou and Krott2016b) but with mouse movements rather than key press responses. The three tasks were chosen because a substantial literature exists in which a potential BA has been explored in these tasks (e.g., Hilchey & Klein, Reference Hilchey and Klein2011; Zhou & Krott, Reference Zhou and Krott2016a, Reference Zhou and Krott2016b). All three are paradigmatic nonverbal tasks that primarily assess the ability to suppress irrelevant information, and along with other tasks such as anti-saccade, go/no-go and stop-signal tasks, they are often used interchangeably in the literature (see Diamond, Reference Diamond2013, for a comprehensive analysis). Compared to Spatial Stroop and Flanker tasks in which memory components are minimal, the Simon task requires individuals to keep the stimulus-response assignments in memory for the duration of the experiment. Despite this minor difference, all three tasks are typically assumed to capture common aspects of an individual's inhibitory control. At the same time, it is unlikely that a single task provides a pure measure of a particular cognitive function (the “task impurity” problem, Rabbitt, Reference Rabbitt and Rabbitt1997) hence we follow recent suggestions (e.g., Paap & Greenberg, Reference Paap and Greenberg2013) always to employ multiple tasks in studies of this type.
Based on the background literature summarised above, we made the following predictions: in all three tasks, congruency effects should emerge in response latencies (although probably not to the same degree: e.g., Zhou and Krott, Reference Zhou and Krott2016b, reported monolingual effects of 131 ms, 41 ms, and 32 ms for Flanker, Simon, and Spatial Stroop interference respectively). If a BA mainly emerges in differential ability to inhibit irrelevant dimensions, then the congruency effect in response latencies should be smaller in bilinguals than in monolinguals. By contrast, if a BA manifests itself as enhanced attentional control, then overall latencies should be faster in bilinguals than in monolinguals. To this point, these are the standard predictions derived from the literature on the BA (e.g., Paap & Greenberg, Reference Paap and Greenberg2013).
Predictions regarding the mouse trajectories are perhaps less obvious. If a BA is due to bilinguals’ superior inhibitory control, then trajectories on incongruent trials should differ between mono- and bilinguals, with bilinguals exhibiting less of a deflection toward the incorrect response. Trajectories on congruent trials, on the other hand should be similar for mono- and bilinguals, given that here the irrelevant dimension does not induce the incorrect response. By contrast, if a BA manifests itself as enhanced attentional control, then bilinguals’ overall trajectories should be more “efficient”. Enhanced efficiency of responses might be reflected in trajectories that are overall carried out with less deflection (i.e., with reduced curvature toward the incorrect response), and/or with higher velocity and acceleration. Critically, this efficiency should be largely independent of congruency: both congruent and incongruent trajectories should appear more “efficient” in bilinguals than in monolinguals. This latter prediction is also in line with the specific proposal by Incera and McLennan (Reference Incera and McLennan2016): if bilinguals “behave like experts”, then bilingual responses should be more “efficient” (faster and/or more “ideal”) than monolingual responses are. An additional and specific prediction from the “bilinguals as experts” claim is that bilinguals should begin moving the mouse later than monolinguals do.
Method
Participants
51 young adult undergraduate students at the University of Bristol were recruited and volunteered for this study. Monolingual participants (N = 25) all confirmed on their consent form that they were native English speakers and were “not fluent in any other language”. Bilingual participants (N = 26), all native speakers of Mandarin or Cantonese, responded negatively to the question about English as their native language on their consent form. They were asked to complete a language questionnaire adapted from Silverberg and Samuel (Reference Silverberg and Samuel2004) also used by Zhou and Krott (Reference Zhou and Krott2016b), in which they provided information relating to self-reported proficiency, age of acquisition, and the current use of English and Chinese (e.g. pattern of use, situation). Table 1 presents an overview of the characteristics of mono- and bilingual participants.
Demographic data of mono- and bilingual speakers.

General design and procedure
We adapted the procedure for the three tasks used in Zhou and Krott (2016), namely Flanker, Simon, and Spatial Stroop task, from their work in as great detail as possible (including slight differences between tasks in the temporal structure of trials, an issue which will be taken up in the General Discussion), except that participants provided their responses via mouse movements and response clicks rather than key presses. Note that all three tasks implemented a fixation cross (400 ms in the Flanker task, and 800 ms in the Simon and Spatial Stroop task) and a blank period (250 ms; in Simon and Spatial Stroop tasks only) before the target appeared. Hence in all three tasks participants were able to initiate a mouse movement before the target itself appeared on the screen. In the results reported below, we computed responses relative to onset of the target display. In mousetracking tasks, participants tend to move the mouse before the target display appears when this is possible, and for this reason average initiation times in our data are negative.
The order in which participants completed the three tasks was rotated. They were seated approximately 60 cm from the computer screen (resolution of 1920 x 1080 with a 22" flat screen). MouseTracker software (Freeman & Ambady, Reference Freeman and Ambady2010) was used for presentation. In all three tasks, participants were instructed to click on a grey box (192 x 108 pixels) in the bottom centre of the screen to initiate a trial, and they responded by moving their mouse to, and clicking on, one of two response button areas (288 x 144 pixels) on either the top left or the top right corner of the screen. MouseTracker collected the raw data of each mouse trajectory, recording x and y coordinates of the trajectory of the mouse movement every 13–16 ms.
Following completion of the three tasks, bilingual participants completed the language history questionnaire described above. The entire session took approximately 30 min per participant.
1. Flanker task
Materials and design
The Erikson Flanker paradigm (Eriksen & Eriksen, Reference Eriksen and Eriksen1974) was implemented in the form used by Costa, Hernández, Costa-Faidella, and Sebastián-Gallés (Reference Costa, Hernández, Costa-Faidella and Sebastián-Gallés2009). Participants judged the direction in which a central arrow pointed, and were instructed to ignore four flanker arrows (two on each side) which either pointed in a direction congruent with the target (→ → → → → or ←←←←←), or in a direction incongruent with the target (←←→←← or → → ← → →). Each arrow occupied .55 degrees of visual angle, and the distance between adjacent arrows was .06 degrees.
Procedure
Participants were instructed to respond to the central arrow by clicking the response box area on either the top left or the top, and to ignore the flanker arrows as much as possible. Each trial was initiated by the participant by clicking on the “Start” area at the bottom of the screen. A fixation cross was presented in the middle of the screen for 400 ms, followed by the stimulus display. The stimulus disappeared with the response or after 1,700 ms if there was no response. Stimuli appeared randomly either slightly above or below the fixation cross with a 50/50 chance. To increase the difficulty of the task (see Costa et al., Reference Costa, Hernández, Costa-Faidella and Sebastián-Gallés2009), 75% of trials were congruent, and 25% were incongruent. There was a total of 120 trials, which included a block of 24 practice trials and two experimental blocks of 48 test trials. Breaks were provided between the practice trials and the test blocks. The stimuli were presented in a fresh random sequence for each participant.
2. Simon task
Materials and design
Blue and red squares (2.2 cm x 2.2 cm) were presented on a computer screen, and participants responded by clicking the box on the top left of the screen when a target was red, or the box on the top right of the screen when a target was blue. Targets were presented either 7 cm to the left, or 7 cm to the right, of the fixation cross, hence generating congruent trials (i.e., red square presented to the left; blue square presented to the right) or incongruent trials (red square presented to the right; blue square presented to the left).
Procedure
Participants were instructed to judge the colour of each target square by clicking on the two corresponding response areas at the top of the screen, and to ignore the position of the target display. Each trial was initiated by the participant by clicking on the “Start” area at the bottom of the screen. A fixation cross was presented in the middle of the screen for 800 ms, followed by a blank screen for 250 ms, and then the target stimulus. The target disappeared with the response, or after 1,000 ms in cases where no response was made.
There were in total 96 trials, including two blocks of 16 practice trials and a block of 64 test trials. In the first practice block, the words “red” and “blue were shown in the left and right response boxes respectively, so that the participants could memorise the association between colours and response buttons. The next practice block no longer showed the indicated colour on the boxes, hence participants had to base their responses on memory. Finally, the experimental block was administered. Breaks were provided between the practice trials and the test blocks. The stimuli were presented in a fresh random sequence for each participant; each colour and spatial condition occurred with equal likelihood.
3. Spatial Stroop task
Materials and design
A modified version of the Simon task designed by Bialystok (Reference Bialystok2006) was implemented in which participants judged the direction in which a single arrow pointed. The arrow was 6.5 cm in length, and with a tail width of 0.5 cm. The widest point of the arrow was 1.5 cm. The arrow was presented either 7 cm to the left or to the right of the centre, hence generating congruency (← presented to the left, or → presented to the right) or incongruency (← presented to the right, or → presented to the left) between response and spatial position.
Procedure
Participants were instructed to judge the direction of the target arrow by clicking on the corresponding response areas at the left or right top of the screen, and to ignore the spatial position of the target arrow. Each trial was initiated by the participant clicking on the “Start” area at the bottom of the screen. A fixation cross was presented in the middle of the screen for 800 ms, followed by a blank screen for 250 ms, and then the target stimulus. The target disappeared with the response, or after 1,000 ms in cases where no response was made.
Each participant completed a total of 80 trials, which included a block of 16 practice trials and a block of 64 experimental trials, with a break in between. The stimuli were presented in a fresh random sequence for each participant, with congruent and incongruent trials equally likely to occur.
Results
Overall accuracy was very high (Flanker task: 98.5%, Simon task: 98.2%, Spatial Stroop task: 98.9%), possibly because the mousetracking paradigm allows participants to correct initially incorrect mouse movements. Accuracy was therefore not further analysed. Data from trials on which participants had made an error were excluded from further analysis. Furthermore, in line with previous research using mousetracking (Incera & McLennan, Reference Incera and McLennan2016), data from trials with initiation times longer than 500 ms past onset of the target display were deleted (Flanker task: 0.02%; Simon task: 0.03%; Spatial Stroop task: 0.03%).
1. Initiation and response times
For each trajectory, MouseTracker computed accuracy, initiation time (the time at which a participant started moving the mouse, following the click on the “Start” button), and response latencies (the time interval between onset of the target display, and the participant clicking on the response field). We additionally computed response duration as the total time of mouse movement (i.e., response latency minus initiation time).
Table 2 presents averages of initiation times, response latencies, and response durations for each of the three tasks, and separately for each group (mono- vs bilinguals) and congruency (congruent vs incongruent). As outlined above, because responses are reported relative to onset of the target display, average initiation times in our data are negative.
Initiation times, response durations, and latencies (in milliseconds), separately for each task (Flanker, Simon, Spatial Stroop), participant group (monolingual vs. bilingual) and condition (congruent vs. incongruent). Standard error of the mean in parentheses.

Note. ***p < .001; **p < .01; *p < .05. For all statistical comparisons, df1 = 1, df2 = 49.
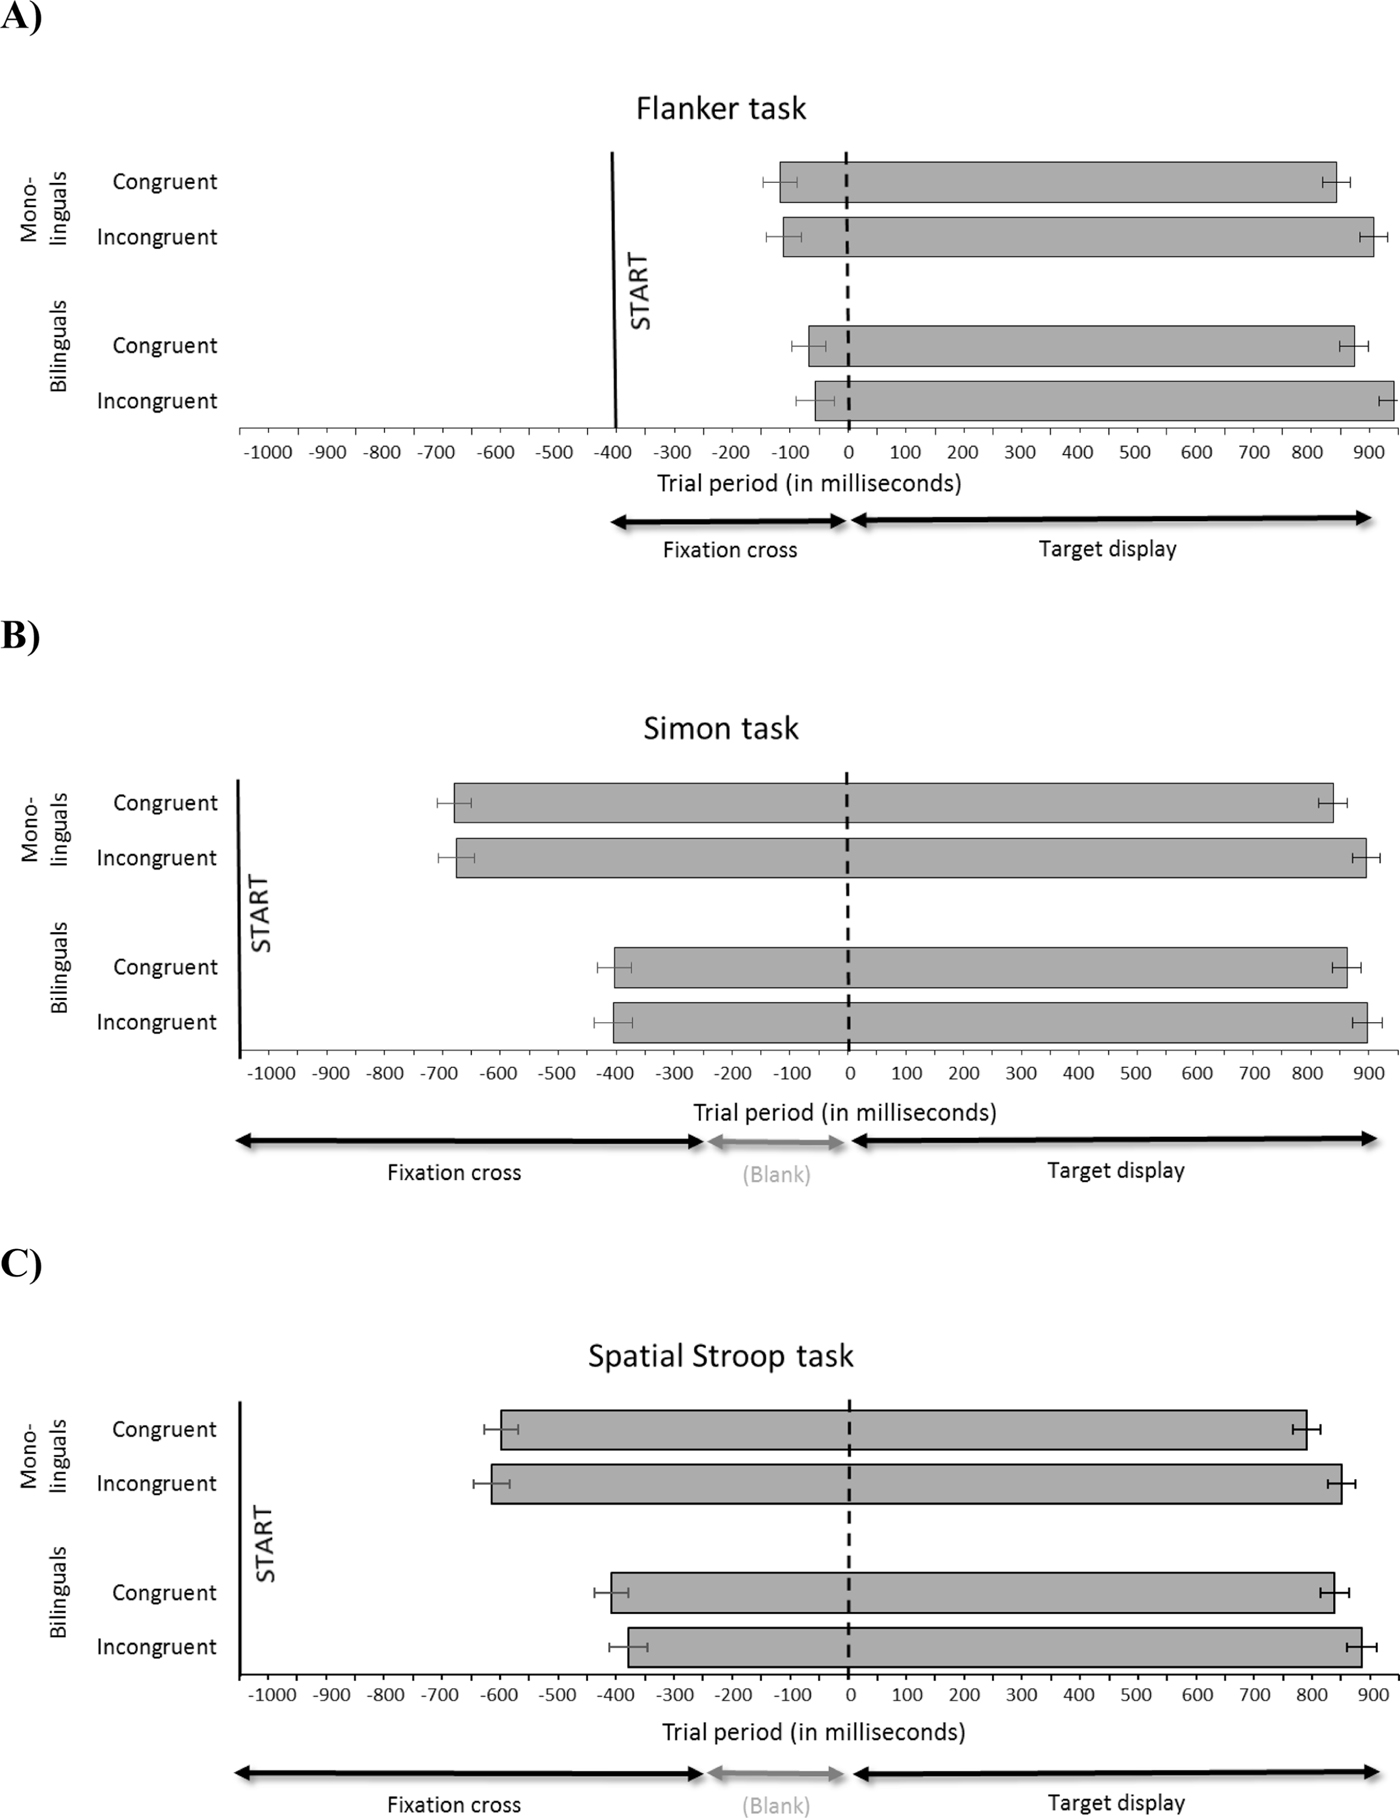
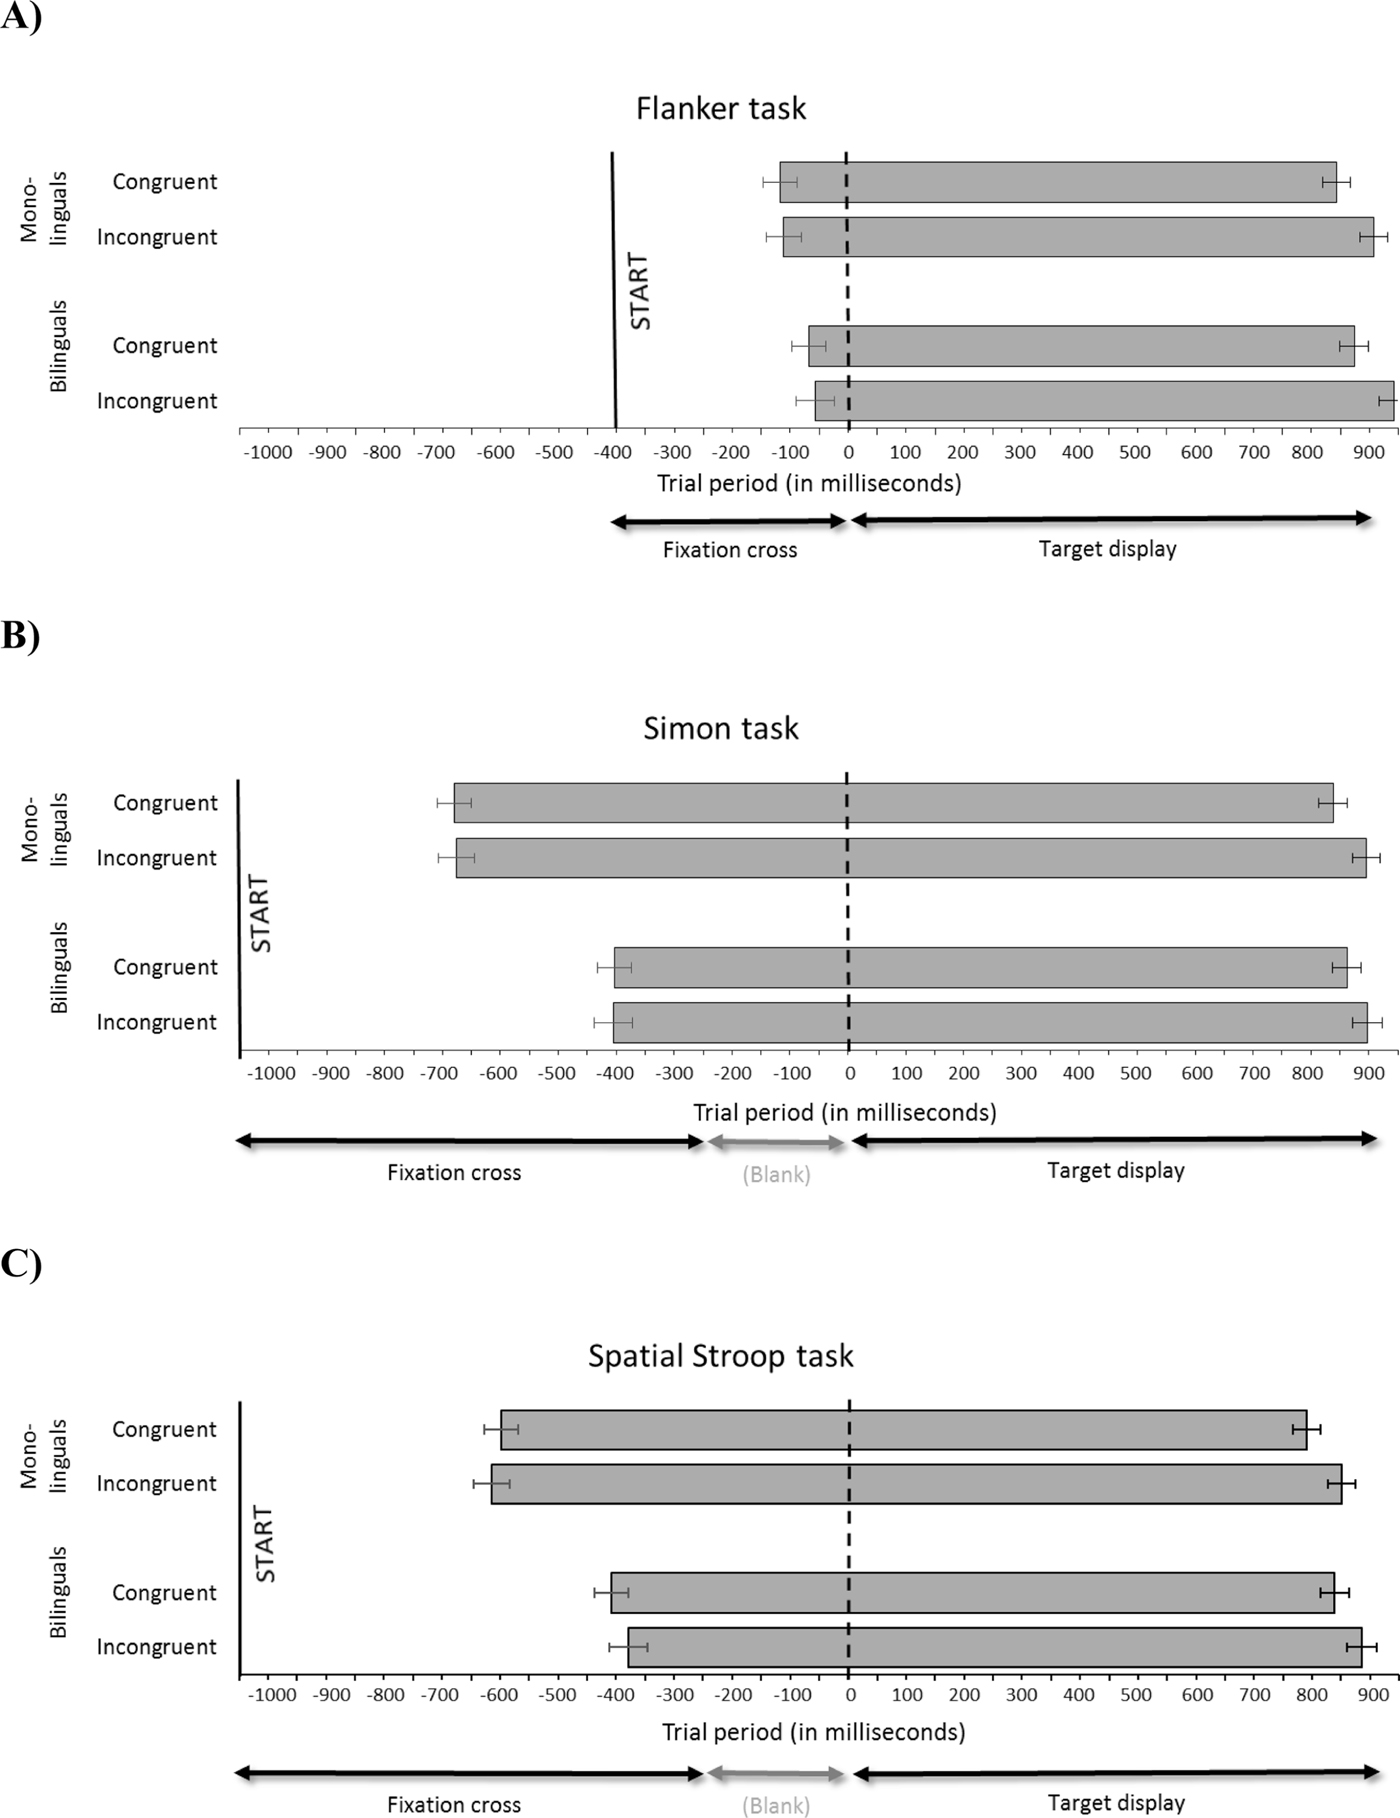
Initiation times, durations, and latencies were statistically analysed by using a group (bilingual vs monolingual) x congruency (congruent vs incongruent) two-way Analysis of Variance (ANOVA), conducted separately for each task (Flanker, Simon, Spatial Stroop). The corresponding statistical results are reported at the bottom of each column of Table 2. Figure 2 additionally provides a visual impression of the relation between response initiation and response latency, and the associated response duration. In this Figure, the vertical dashed line indicates onset of the target display.
Flanker task (panel A), Simon task (panel B), and Spatial Stroop task (panel C): Trial period (in milliseconds). Grey bars represent mouse movements, separately for group (monolinguals vs. bilinguals) and congruency (congruent vs. incongruent). The solid vertical line represents the point in time when participants click on the “Start” button to initiate a trial; the dotted line represents target display onset. Error bars represent standard error of the mean.
Flanker task (Figure 2, panel A)
Participants started mouse movement slightly before target onset (average initiation time: −88 ms). The analyses of initiation times revealed no effect of group, congruency, nor an interaction. By contrast, response durations and latencies showed a highly significant effect of congruency, which is also clearly visible in Figure 2. Neither measure showed a main effect of group, nor was there an interaction of group and congruency.
Simon task (Figure 2, panel B)
Participants started moving the mouse considerably earlier than in the Flanker task (average initiation time: −541 ms). There was a significant main effect of group on initiation times, with monolinguals beginning to move the mouse substantially earlier (by 275 ms) than bilinguals, a pattern which is clearly visible in the Figure. By contrast, no significant effect of congruency, nor an interaction between group and congruency, was found in initiation times. A significant main effect of group was found in response durations, with monolinguals taking substantially longer (261 ms) than bilinguals to carry out the response (a pattern which again emerges clearly in the Figure), as well as a significant main effect of congruency. Interestingly, the later initiation times and shorter response duration in bilinguals compared to monolinguals compensated each other, such that response latencies were closely matched between the two groups, as reflected in a main effect of congruency but no significant interaction with group.
Spatial Stroop task (Figure 2, panel C)
Participants started moving the mouse on average 500 ms prior to target onset. As in the Simon task, a significant main effect of group was found: monolinguals initiated mouse movements earlier (by 213 ms) than bilinguals. A significant effect of congruency, as well as one of group, was found in response durations. A highly significant congruency effect was found in response latencies, but as in the Simon task, no group effect appeared in latencies: mono- and bilinguals’ latencies were closely matched, despite the fact that the former initiated their response more than 200 ms earlier than the latter.
Overall, in all three tasks, global response latencies did not differ between mono- and bilinguals. Congruency affected response latencies but not initiation times. In the Simon and Spatial Stroop task, but not in the Flanker task, monolinguals initiated their responses significantly earlier than bilinguals (although this pattern was numerically present even in the Flanker task). Importantly, there was no interaction between group and congruency found in any of the measures across the three tasks. If response latencies were to be taken as the sole indicator of a potential BA (as they typically are in the literature), our findings would be interpreted as a null finding: neither are congruency effects statistically reduced in bilinguals compared to monolinguals, nor do the two groups differ in “global” response latencies. However, analysis of initiation times and response durations show rather clear group differences. This underscores the value of exploring mouse trajectories rather than key presses to explore the issue.
2. Analysis of mouse movement trajectories
Trajectories collected by MouseTracker were rescaled into a standard coordinate space, with an x coordinate range of −1 to 1, and a y coordinate range of 1 to 1.5. Trajectories were normalised into 101 time steps using linear interpolation. All leftward responses were re-mapped to the right side to permit direct comparison between conditions.
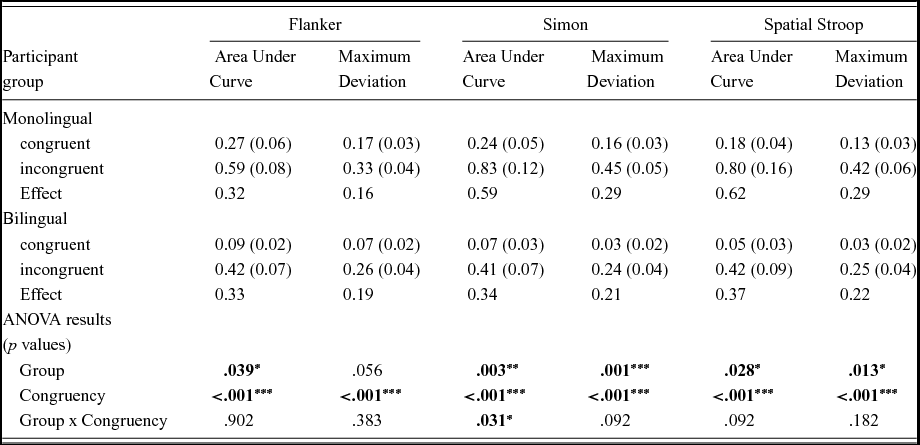
To quantify the degree to which participants were influenced by the irrelevant dimension in each task, for each trajectory we computed the “Area under Curve” (AUC) and “Maximum Deviation” (MD; see Introduction). Table 3 presents AUC and MD results, again for each of the three tasks, and separately for each group (mono- vs bilinguals) and congruency (congruent vs incongruent). As for initiation times, durations, and latencies (see previous section), the bottom of Table 3 presents the results of two-way ANOVAs, with group (bilingual vs monolingual) and congruency (congruent vs incongruent) as the factors. Figures 2–4 additionally present average mouse trajectories for each of the three tasks, and separately by congruency and group.
Area under Curve (AUC) and Maximum Deviation (MD), separately for each task (Flanker, Simon, Spatial Stroop), participant group (monolingual vs. bilingual) and condition (congruent vs. incongruent). Units for AUC are squared standard coordinates; units for MD are standard coordinates. Standard error of the mean in parentheses.

Note. ***p < .001; **p < .01; *p < .05. For all statistical comparisons, df1 = 1, df2 = 49.
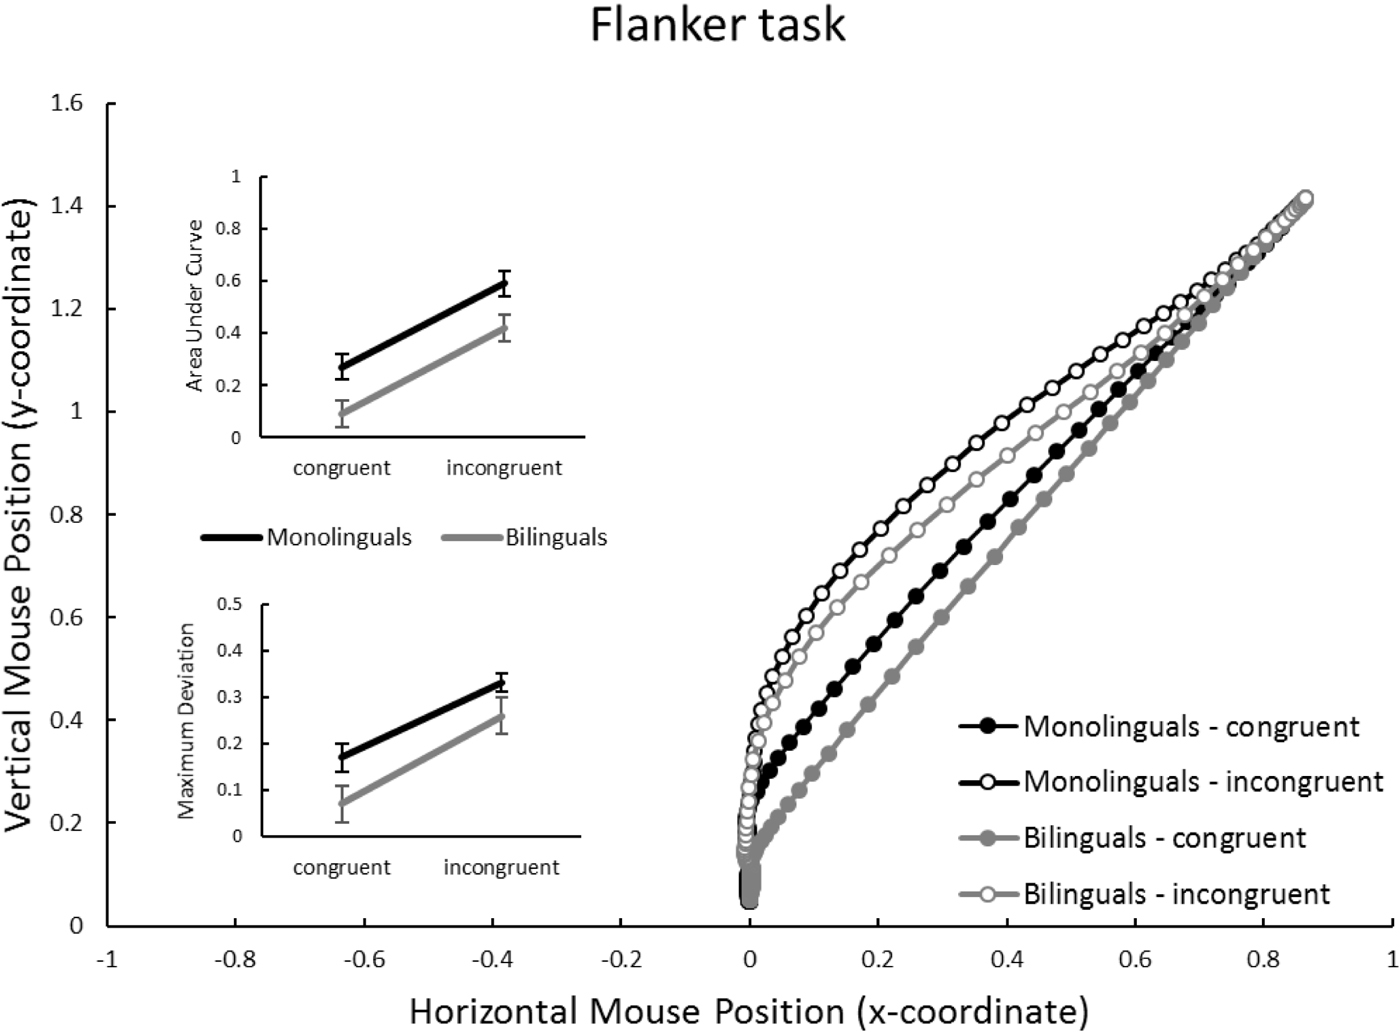
Flanker task: Mouse trajectories in x-y coordinate space, separately for group (monolinguals vs. bilinguals) and congruency (congruent vs. incongruent). Inset panels represent average Area under Curve, and Maximal Deviation, dependent on group and congruency. Units for AUC are squared standard coordinates; units for MD are standard coordinates. Error bars in inset panels represent standard error of the mean.

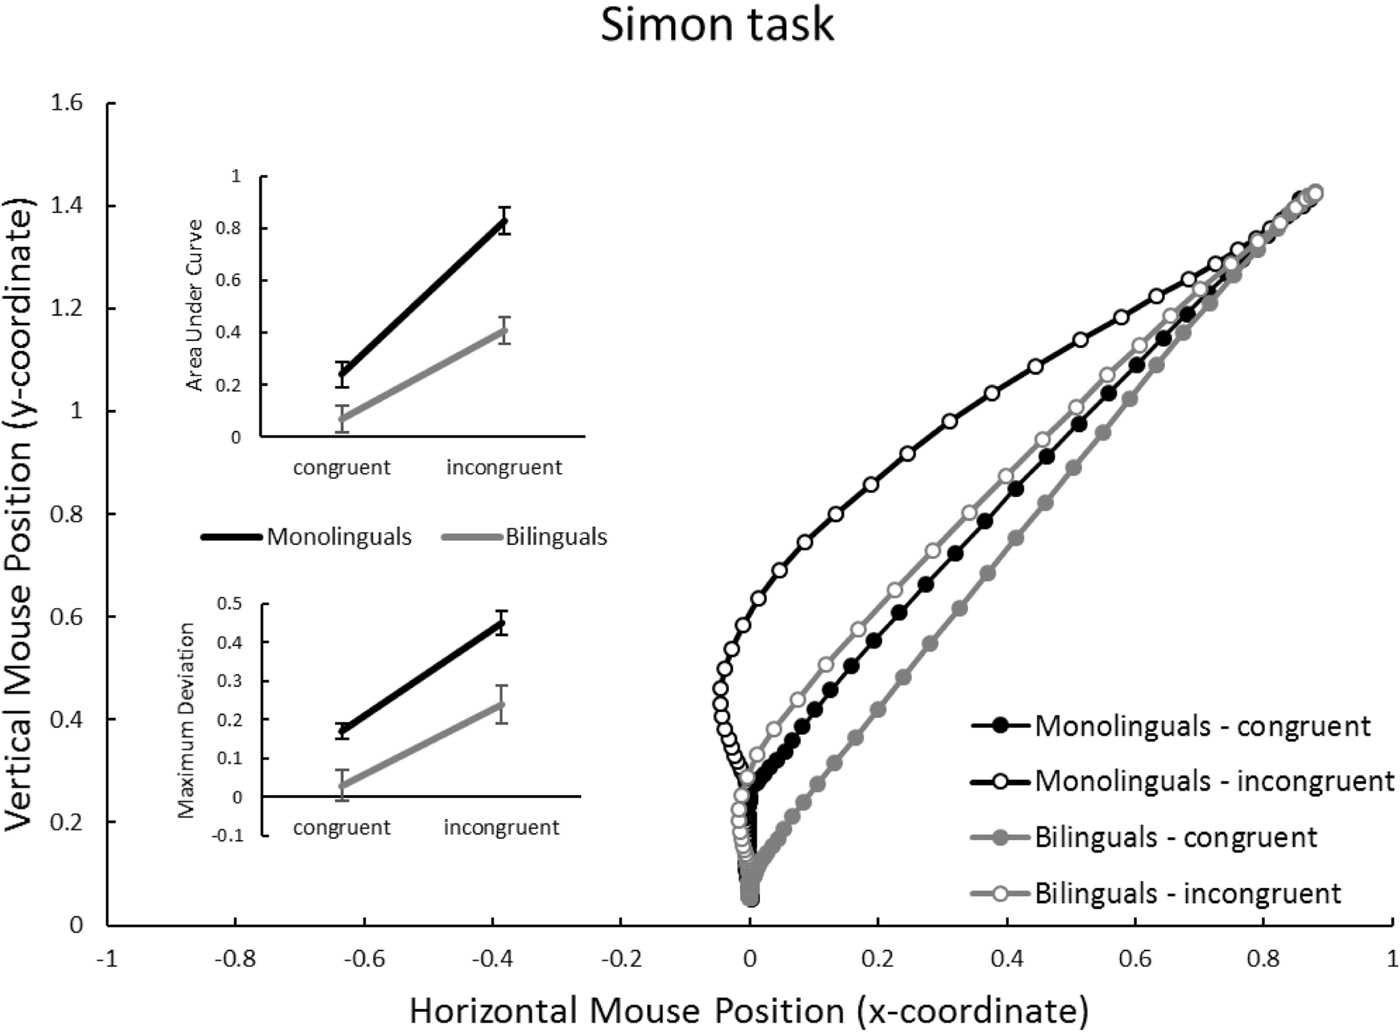
Simon task: Mouse trajectories in x-y coordinate space, separately for group (monolinguals vs. bilinguals) and congruency (congruent vs. incongruent). Inset panels represent average Area under Curve, and Maximal Deviation, dependent on group and congruency. Units for AUC are squared standard coordinates; units for MD are standard coordinates. Error bars in inset panels represent standard error of the mean.

Flanker task (Figure 3)
Congruency affected trajectories as would be expected, with incongruent responses showing a larger deviation from the “ideal” (i.e., closer to a straight line from start to finish) trajectory than congruent ones. This is reflected in highly significant effects of congruency on both AUC and MD (bottom of Table 2). Bilinguals overall tended to have more “ideal” responses than monolinguals, which is reflected in a significant group effect on AUC, and a marginally significant effect on MD. However, no group x congruency interaction emerged for AUC and MD (see also the inset panels in Figure 2): bilinguals carried out more “ideal” responses for both congruent and incongruent trials.
Simon task (Figure 4)
Again congruency affected trajectories, reflected in a highly significant effect on AUC and MD (bottom of Table 2). Similarly, group significantly affected both AUC and MD, with monolinguals showing substantially larger values than bilinguals. An interaction between group and congruency was found on AUC, and a trend was found on MD (also see the inset panels of Figure 4): monolinguals seemed particularly affected by the incongruent condition, where they exhibited particularly large values.
Spatial Stroop task (Figure 4)
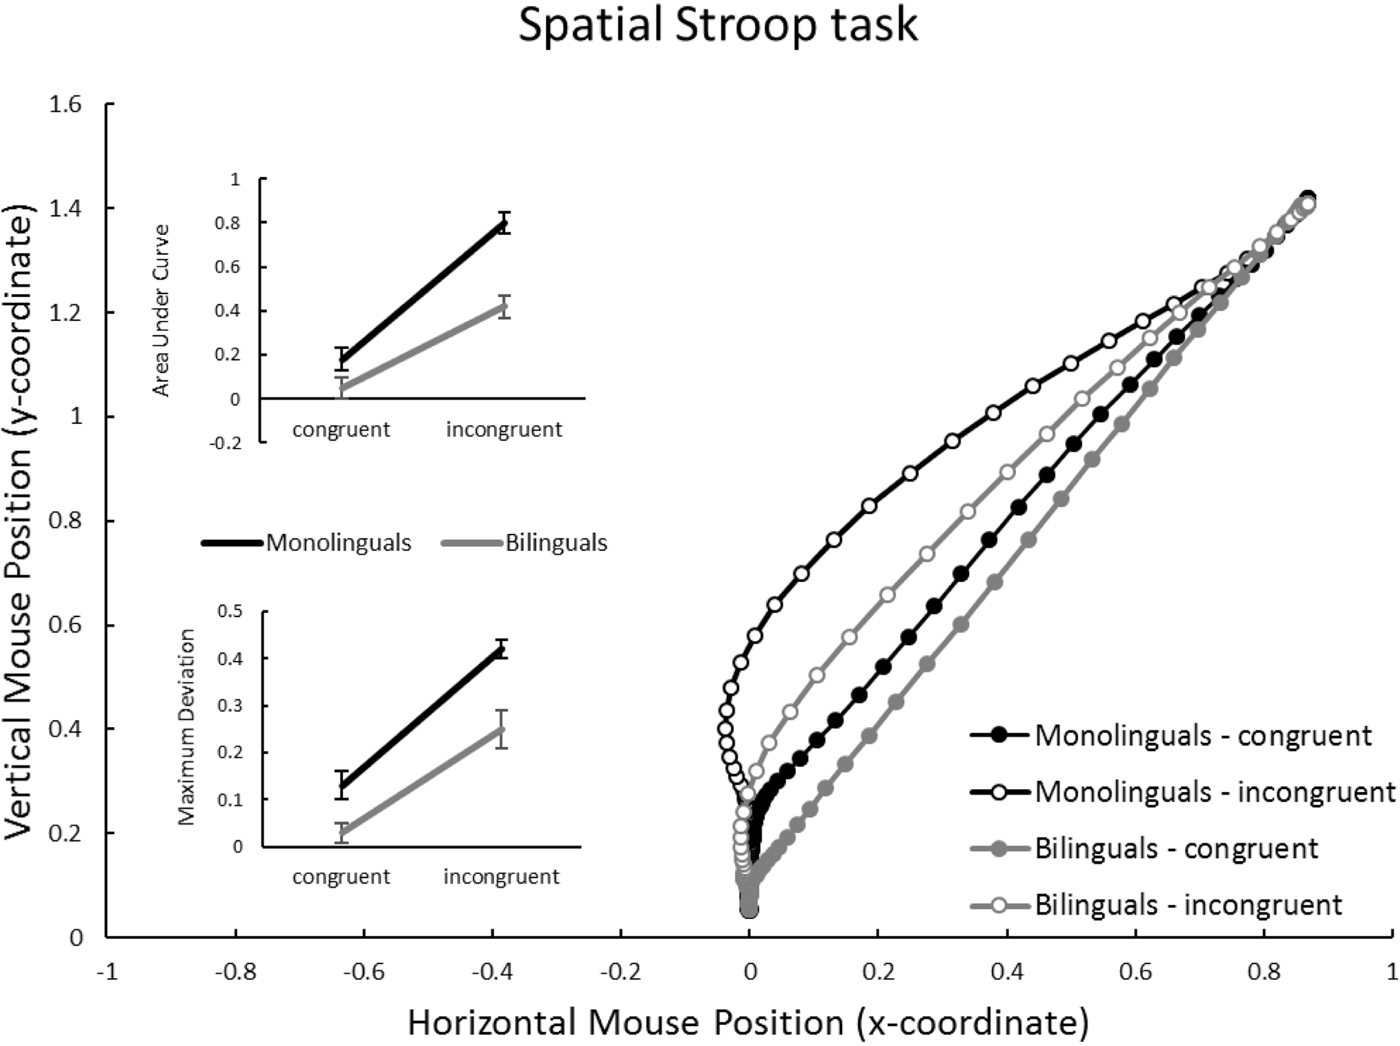
Again congruency affected trajectories, reflected in a highly significant effect on AUC and MD (bottom of Table 2). Group also affected both measures significantly, with monolinguals showing larger values than bilinguals. However, on this task group and congruency did not significantly interact (see inset panels of Figure 5).
Spatial Stroop task: Mouse trajectories in x-y coordinate space, separately for group (monolinguals vs. bilinguals) and congruency (congruent vs. incongruent). Inset panels represent average Area under Curve, and Maximal Deviation, dependent on group and congruency. Units for AUC are squared standard coordinates; units for MD are standard coordinates. Error bars in inset panels represent standard error of the mean.
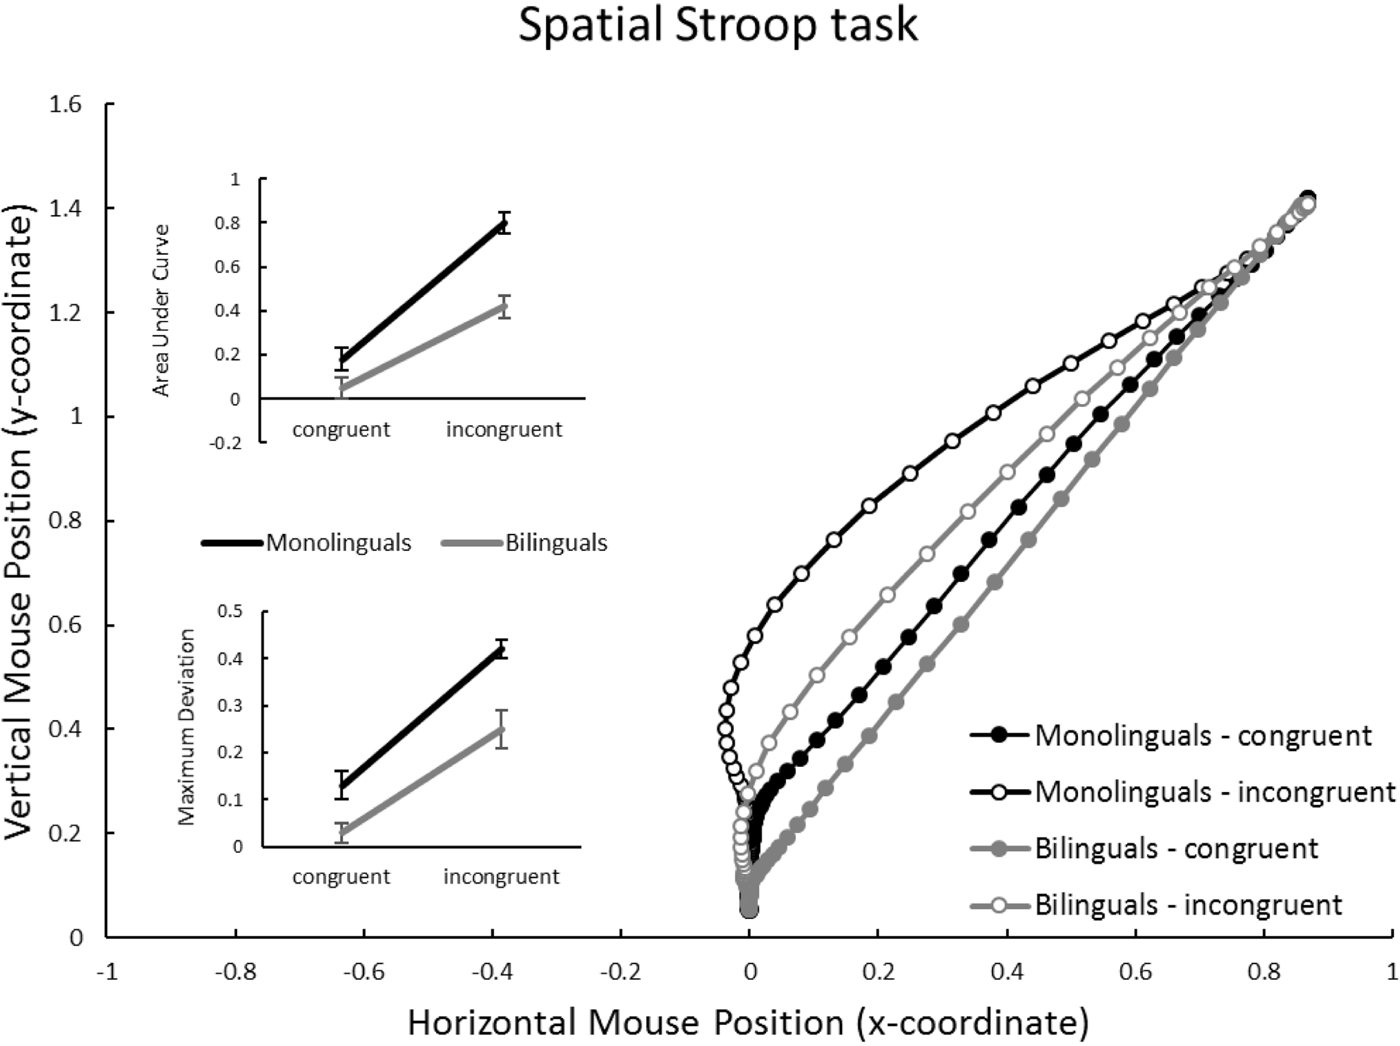
In summary, a congruency effect clearly emerged in the movement trajectories in all three tasks. Furthermore, trajectories were overall closer to the “ideal” (straight) response trajectory in bi- compare to monolingual participants, as reflected in a main effect of group. However, in the Flanker and the Stroop task, no interaction between Group and Congruency was found – mono- and bilinguals appeared similarly affected by Congruency. Only in the Simon task was the interaction significant, and only in the AUC, but not in the MD, measure.
Indeed, in Figures 3–5 it is apparent that not only the incongruent, but also the congruent, trajectories appear to differ between mono- and bilinguals. In other words, bilinguals not only suffer less from irrelevant information than monolinguals, but they also appear to carry out more efficient (i.e., straighter) movements on congruent trials. This was statistically confirmed in an analysis that compared, for each task, AUC on congruent trials between mono- and bilinguals. All comparisons reached significance, Flanker: t(49) = 2.60, p = .012; Simon: t(49) = 2.98, p = .005; Spatial Stroop: t(49) = 2.62, p = .012. Hence, when the congruent and incongruent trials are presented in a randomised manner, the cognitive advantage associated with bilingualism clearly affects congruent, and not just incongruent, mouse trajectories.
Distributional analysis of trajectories
Figures 3–5 show averaged trajectories for each task, group and condition. In experiments of this type, such trajectories can potentially convey a spurious impression because they might result from averaging across many trials on which little or no “attraction” toward the incorrect response emerged, with a smaller number of trials which showed rather extreme attraction (i.e., a movement toward the incorrect response, followed by a mid-flight change of direction). Hence, trajectories should be inspected for potential bimodality (e.g., Freeman & Ambady, Reference Freeman and Ambady2010). To address this issue, we generated kernel density plots that show, separately for each task, condition, and group, the distribution of raw AUC measures. The supplementary Appendix S1 (Supplementary Materials) presents the results. No evidence of bimodality is visible in the density curves. Furthermore, a direct visual comparison between the two groups shows that density plots in each sub-panel are virtually identical, suggesting that mono- and bilinguals did not substantially differ in their distribution of movement trajectories and hence it is legitimate to compare average trajectories between the two groups.Footnote 1
Bilinguals as “experts”?
As summarised in the Introduction, Incera and McLennan (Reference Incera and McLennan2016) observed in a mousetracking study that, compared to monolinguals, bilinguals tended to withhold responses for longer, but then carried out a more efficient response. We checked whether a similar pattern could be found in our own results. Regarding initiation times, results from the Flanker task summarised in Table 1 showed that bilinguals responded on average 52 ms later than monolinguals, although the group effect was not significant. By contrast, in the Simon and the Spatial Stroop task, bilinguals initiated their response clearly and significantly slower than monolinguals (by 275 ms and 213 ms, respectively). At the same time, overall response latencies were closely matched between bi- and monolinguals (cf. the null effect of a group difference on latencies at the bottom of Table 2). Figures 3–5 suggest a “more efficient” mouse trajectories of bilinguals, as reflected in trajectories which are overall close to the “ideal” (straight) trajectory. Apart from shape, efficiency of trajectories might additionally be reflected in speedier mouse movements. The MouseTracker software allows for the computation of velocity and acceleration profiles of movement trajectories. This type of analysis is conducted on raw time, i.e., without time normalisation. Raw data are partitioned into an optional number of “time bins” within a chosen time interval, and velocity and acceleration are calculated for each time bin. Velocity is calculated as distance (in standard coordinates) between subsequent coordinates at different raw time points, and acceleration corresponds to changes in velocity across subsequent time points. We computed response profiles for the post-target trial period of 0–1000 ms, with 20 time bins within this interval, for each task and group. The results are displayed in the supplementary Appendices S2-4 (Supplementary Materials). In all three tasks, velocity reached its peak approximately 400– 500 ms post target display, with maximal acceleration around 350 ms. Velocity and acceleration profiles, which look relatively similar between the two groups, were compared between mono- to bilingual participants under each task via Kolmogorov-Smirnov tests, but none were significant, Ds ≤ .35, ps ≥ .175.
Overall, we interpret these findings to show that bilinguals tended to delay their responses relative to monolinguals, and then carried out more efficient movements. However, the enhanced efficiency was mainly reflected in the shape of the trajectories, and less so or not at all in velocity or acceleration.
3. Ex-Gaussian analysis of response latencies
As described in the Introduction, Zhou and Krott (Reference Zhou and Krott2016b) suggested that in their Flanker, Simon, and Spatial Stroop tasks from which we adapted our own experiments, the cognitive bilingual advantage manifested itself mainly in the tail end of response time distributions: group differences on μ (the normal portion of the response time distribution) were negligible, but the BA manifested itself in a reduced τ (tail portion) of bilinguals’ responses, compared to those of monolinguals. To explore whether this pattern also emerged in our data, response times of accurate responses were fitted with ex-Gaussian distributions for each participant in each task and condition. Parameters μ and τ were estimated using QMPE (Brown & Heathcote, Reference Brown and Heathcote2003) via the quantile maximum likelihood estimation method. Parameters were estimated for each participant and condition using five quintiles. All ex-Gaussian parameters were successfully computed with an average iteration of 10.3. All exit codes were below 128, which according to the QMPE technical manual suggests trustworthy estimates.
Table 4 shows the results. In all three tasks, the congruency manipulation manifested itself mainly in the normal part of the response time distribution, with a highly significant effect of congruency in each case. By contrast, the tail end of the distribution contributed relatively less to the congruency effect, and only in the Flanker task was the main effect of congruency significant. Crucially, for neither μ nor τ was there a Group x Congruency interaction. In other words, contrary to what Zhou and Krott (Reference Zhou and Krott2016b) found for key press response times, in the mouse response latencies there was no evidence for a cognitive bilingual advantage specific to the τ parameter.
Ex-Gaussian analysis of response latencies. Estimated parameters μ (Gaussian component) and τ (tail of the response time duration) in milliseconds, separately for each task (Flanker, Simon, Spatial Stroop), participant group (monolingual vs. bilingual) and condition (congruent vs. incongruent).

Note. ***p < .001; **p < .01; *p < .05. For all statistical comparisons, df1 = 1, df2 = 49
Discussion
We investigated the possibility of advantages in cognitive control conveyed by bilingualism in three “classic” executive functions tasks: Flanker, Simon, and Spatial Stroop. We compared English monolingual participants to Chinese (Mandarin or Cantonese)–English bilinguals. Contrary to most previously conducted research, in our studies participants carried out responses via computer mouse rather than button press. The results are complex but can be summarised as follows.
As expected based on a voluminous literature on the three tasks, “incongruent” trials resulted in longer response latencies (the time it took participants to click on the appropriate response box at the top of the screen) than “congruent” trials did. In all three tasks, congruency also affected the dynamics of mouse movement trajectories: “incongruent” target displays induced a deflection in trajectories toward the inappropriate response. These results are as expected based on previous mousetracking studies with congruency manipulations (e.g., Freeman & Ambady, Reference Freeman and Ambady2009). In all tasks, participants began moving the mouse before the critical target display appeared.
With regard to a potential bilingual advantage, in the response latencies there was only weak support for the possibility that bilinguals, resulting from a hypothesised enhanced cognitive control, might suffer less from incongruency than monolinguals do: in the Simon and Spatial Stroop task, but not in the Flanker task, congruency effects appearing in response latencies were numerically smaller in bilinguals than in monolinguals, but no statistical interaction between group and congruency was found. In all three tasks, mono- and bilinguals exhibited similar and statistically matched overall (“global”) response latencies. However, monolinguals tended to initiate mouse movements earlier than bilinguals, significantly so in the Simon and Spatial Stroop tasks but not in the Flanker task. Movement trajectories of bilinguals were overall more “ideal” (closer to a straight line between start and response button) than those of monolinguals, as reflected in significant effects of group on Area under Curve and Maximum Deviation (two measures of trajectory curvature). As was the case for response latencies, there was only weak support for the claim that congruency differentially affected monolinguals more than bilinguals: in the Simon task but not in the other two tasks, a significant group by congruency interaction was found on AUC (and marginally so on MD). There were negligible group differences in velocity or acceleration profiles of the mouse trajectories.
The overall picture is therefore as follows: mono- and bilinguals arrived at the correct response at approximately the same speed, but in substantially different ways: bilinguals tended to withhold initiation of their responses when compared to monolinguals, but then carried out a more “efficient” (i.e., closer to the ideal straight trajectory) response. There was only weak evidence that bilinguals might have enhanced inhibitory control, i.e., the ability to suppress irrelevant information: depending on task, congruency effects in latencies as well as AUC/MD were somewhat smaller in bi- than in monolinguals, but the pattern was not particularly striking. By contrast, we interpret the overall pattern as lending support to the view that bilinguals have enhanced “monitoring abilities” compared to the monolinguals, i.e., the ability to form and maintain goal-directed behaviour. This group difference emerged primarily in the trajectory curvatures of all three tasks. Interestingly, however, the hypothesised monitoring superiority did not lead to faster overall response times (“global RT advantage”) in bilinguals: both groups generated overall response latencies which were strikingly similar.
As outlined in the Introduction, we are aware of only two published studies in which a potential bilingual advantage was explored via mousetracking. Incera and McLennan (Reference Incera and McLennan2016) conducted a Stroop task with mouse movement responses, and reported a pattern of “bilinguals as experts”: compared to monolinguals, bilinguals tended to withhold responses for longer than bilinguals, but then carried out more efficient responses. This sort of “expert behaviour” (delaying a response, which is subsequently carried out efficiently) has been documented in various areas of expertise, particularly in athletic domains such as baseball and football. What we found in our three EF tasks is fully in line with the hypothesis that bilinguals, when compared to monolinguals, perform as “experts” on tests of executive functions. Incera and McLennan (Reference Incera and McLennan2017) used a bilingual Stroop task and a Flanker task. An effect of bilingualism on mouse trajectories, as measured by “growth curve analysis”, emerged in the Stroop task but not in the Flanker task. Differences in participants, procedure and analysis protocol make it difficult to compare these findings directly to our own. For instance, in line with Costa et al. (Reference Costa, Hernández, Costa-Faidella and Sebastián-Gallés2009) and Zhou and Krott (Reference Zhou and Krott2016b), 75% of our Flanker trials were congruent, and only 25% were incongruent, to create a “high monitoring” context. By contrast, Incera and McLennan included equal proportions of congruent, incongruent, and neutral trials. Future research will have to determine whether the two sets of results can be squared with one another.
It is acknowledged that the pattern obtained with the Flanker task (Figure 2 Panel A, and 3) differs somewhat from those that we obtained with Simon and Spatial Stroop (Figure 2 Panel B and C, and 4–5): whereas the latter two tasks appeared relatively similar with regard to response characteristics, in the former participants withheld their responses for longer relative to target display onset, and as a result, initiation times of mono- and bilinguals were more similar than in the other two tasks. This might be due to genuine processing differences among the tasks. However, a more likely cause is that our aim was to replicate the task design of the experiments reported in Zhou and Krott (2016) as closely as possible, which resulted in a somewhat different trial structure between the tasks. Specifically, in the Flanker task the target display appeared 400 ms after participants initiated a trial, whereas in the Simon and Stroop task, it appeared 1,050 ms after trial initiation. It would be unsurprising if the time available before target display influenced participants’ willingness to initiate mouse movements. In hindsight, it might have been preferable to render the pre-target interval identical in all three tasks, and we predict that with matching pre-target intervals, response profiles of the three tasks would more closely resemble each other. Indeed, the most obvious trial structure would be one without a pre-target period (i.e., the target appears as soon as participants initiate trial), as was the case in Incera and McLennan (Reference Incera and McLennan2016, Reference Incera and McLennan2017). We are currently conducting the corresponding experiments in our lab.
What are the theoretical implications of these findings? Alongside a range of recent results (e.g., Paap & Greenberg, Reference Paap and Greenberg2013), our findings lend only limited support to the hypothesis that, compared to monolinguals, bilinguals enjoy an enhanced ability to suppress irrelevant information. If true, this should have resulted in the characteristic group x congruency interactions on the dependent variables, but these interactions were weak or absent. Hence our findings add to a growing list of empirical studies failing to find support for the BA manifesting itself primarily in enhanced inhibitory control (Paap et al., Reference Paap, Johnson and Sawi2015). The concern voiced by Paap and others about the potential lack of statistical power in many existing studies is acknowledged: it is quite possible that with sample sizes considerably larger than those in our study, group x congruency interactions would have emerged on latencies or mouse trajectories.
An alternative or possibly complementary possibility is that the BA emerges primarily in enhanced “monitoring abilities” (Costa et al., Reference Costa, Hernandez and Sebastian-Galles2008) or “attentional control” (Zhou & Krott, Reference Zhou and Krott2016b). Enhanced monitoring/attention would manifest itself as a “global RT advantage” in bilinguals compared to monolinguals (i.e., a main group effect on latencies). Interestingly, response latencies in our mousetracking paradigm also failed to support this prediction (but see discussion below): overall latencies were closely matched between mono- and bilinguals. Most importantly, however, mono- and bilinguals clearly differed in their response profiles, with bilinguals withholding their responses for longer, but then carrying out a more efficient response. This finding lends some support to the claim that mono- and bilinguals differ substantially with regard to cognitive processing.
How should “monitoring abilities” or “attentional control” be conceptualised? Recently, Bialystok (Reference Bialystok2017) suggested “executive attention” as the unitary theoretical construct that might be able to account for the existing findings on the BA. The term “executive attention” (Engle, 2002) characterises the notion of a domain-free limitation to attentional control, with working memory capacity constraining an individual's ability to maintain or suppress information. Because it has been suggested that executive attention exhibits training effects (e.g., Harrison, Shipstead, Hicks, Hambrick, Redick & Engle, Reference Harrison, Shipstead, Hicks, Hambrick, Redick and Engle2013), it is not implausible that bilingualism could result in enhanced attentional control.
It is an interesting and perhaps controversial question whether it is appropriate to characterise the observed pattern as a “bilingual advantage”. Bilinguals “behaving as experts” (Incera & McLennan, Reference Incera and McLennan2016) in our study took approximately the same amount of time to arrive at relevant responses than monolinguals. If one takes response latencies to be the ultimate criterion of cognitive performance, then the former did not enjoy a processing advantage. By contrast, if “efficiency” of the response is taken to be the critical measure, then bilinguals showed superior performance when compared to monolinguals. Notwithstanding this point, the overall pattern rather clearly suggests to us that mono- and bilinguals differ substantially with regard to their response characteristics, with bilinguals enjoying enhanced “monitoring” abilities that allow to them to generate expert-like behaviour when compared to monolinguals.
Above, we highlighted the fact that response latencies (the time it took participants to move the mouse from the start to the response box, and click on the latter) showed congruency effects but no group effects, nor a clear interaction between group and congruency. Are latencies in the mousetracking paradigm analogous to those in conventional button-press tasks? Because our procedure closely replicated the one used in Zhou and Krott (Reference Zhou and Krott2016b), we can compare overall latencies directly. Zhou and Krott reported average latencies (without elimination of outliers) of 501 ms, 386 ms, and 412 ms for Flanker, Simon, and Spatial Stroop tasks. These compare with 895 ms, 873 ms, and 842 ms in our mousetracking tasks. Hence overall latencies take roughly twice as long in mousetracking than in key press experiments, which makes it problematic to compare latencies across the two response paradigms. This point is also highlighted by the results of the ex-Gaussian analysis conducted by Zhou and Krott, as well as on our response latencies. Zhou and Krott found a difference between mono- and bilinguals manifesting itself in the tail end of the response time distribution, which was reduced for bilinguals compared to monolinguals and which according to the authors implies that bilinguals enjoy enhanced attentional control. By contrast, ex-Gaussian analysis of our response latencies reported in Table 4 showed no corresponding group x congruency interaction on the exponential portion of the latencies (nor on the Gaussian portion). Further research is needed to resolve the discrepancy between key press and mousetracking latencies.
Research on potential processing differences between mono- and bilingual populations is fraught with methodological difficulties because it is based on the assumption that the two groups are closely matched on all relevant variables other than language abilities. This is difficult if not impossible to ensure, as repeatedly pointed out in the literature (e.g., Paap et al., Reference Paap, Johnson and Sawi2015). In our specific case, we compared English and Chinese–English undergraduate students within a narrow age and education range (young undergraduate students). It could be argued that a group difference other than linguality generated the observed differences in response profiles in our mousetracking tasks. In evaluating this issue, it needs to be highlighted that despite our bilinguals showing more “expert-like” behaviour than the monolinguals, both groups showed very similar overall response latencies. Hence it is clearly not the case that (perhaps as a result of cultural background, educational background, or a range of other reasons) the bilinguals were simply “better” than the monolinguals. But perhaps cultural differences exist between UK and Chinese students that might favour particular types of behaviour. For instance, did our bilingual Chinese participants withhold responses for longer due to a tendency toward risk avoidance, whereas our UK participants were more willing to initiate a swift response, at the risk of having to correct it later? Cross-cultural psychological differences are well-documented (e.g., Berry, Poortinga, Breugelmans, Chasiotis & Sam, Reference Berry, Poortinga, Breugelmans, Chasiotis and Sam2011; Hofstede, Reference Hofstede2001); however, our reading of this literate is that, in an experimental context, Chinese participants are willing to engage in “riskier” behaviour than their English counterparts (e.g., Lau & Ranyard, Reference Lau and Ranyard2005), which if true would run contrary to the pattern observed in our results. Finally, it has to be kept in mind that Incera and McLennan (Reference Incera and McLennan2016) found the “expert” behaviour profile of bilinguals compared to monolinguals but in their case with English–Spanish bilinguals. This makes it rather unlikely that a cultural confound could explain the differences which they, and we, attribute to bilingualism.
In summary, in a mousetracking version of the Flanker, Simon, and Spatial Stroop task, we found clear differences in response profiles between mono- and bilingual young adults. These findings lend some support to the possibility that bilingualism exerts a positive effect on executive functions. However, this bilingual advantage emerges not as previously claimed in an enhanced ability to suppress irrelevant information, but rather in superior monitoring/attentional capabilities which leads to “expert-like” responses, with delayed movement onset but more efficient response execution.
Supplementary material
To view supplementary material for this article, please visit https://doi.org/10.1017/S1366728918000901