Introduction
Attention-deficit/hyperactivity disorder (ADHD) is characterized by a pervasive pattern of developmentally inappropriate inattentive, impulsive and hyperactive behaviours that typically begin during the preschool years and often persist into adulthood (American Psychiatric Association, 2000; Fayyad et al. Reference Fayyad, De Graaf, Kessler, Alonso, Angermeyer, Demyttenaere, De Girolamo, Haro, Karam, Lara, Lepine, Ormel, Posada-Villa, Zaslavsky and Jin2007; Polanczyk et al. Reference Polanczyk, de Lima, Horta, Biederman and Rohde2007; Simon et al. Reference Simon, Czobor, Balint, Meszaros and Bitter2009). Attention-deficit symptoms cover problems in directing and sustaining attention, whereas hyperactivity and impulsivity symptoms cover a surplus of motor activity in general and an inability to suppress motor activity when unwanted or socially inappropriate.
A longstanding hypothesis characterizes ADHD as a disorder of cognitive and behavioural inhibition (for reviews, see Barkley, Reference Barkley1997; Sergeant et al. Reference Sergeant, Geurts, Huijbregts, Scheres and Oosterlaan2003; Nigg, Reference Nigg2005; Adams et al. Reference Adams, Derefinko, Milich and Fillmore2008; Boonstra et al. Reference Boonstra, Kooij, Oosterlaan, Sergeant and Buitelaar2010). Top-down controlled oscillations in the α band (8–12 Hz) are thought to play a key role in functional inhibition of cortical areas (for reviews, see, for example, Klimesch et al. Reference Klimesch, Sauseng and Hanslmayr2007; Jensen & Mazaheri, Reference Jensen and Mazaheri2010; Foxe & Snyder, Reference Foxe and Snyder2011). In a prior study we reported evidence that failure to regulate cortical α activity is related to attentional problems in ADHD. Aberrant posterior hemispheric α lateralization was shown to be associated with visuospatial attention problems in adults with ADHD (ter Huurne et al. Reference ter Huurne, Onnink, Kan, Franke, Buitelaar and Jensen2013). We now investigate whether these problems in orchestrating α band oscillations extend to the sensorimotor domain, as problems in inhibiting motor actions is part of the pathology of ADHD.
As in visual areas, oscillations in the α band are also observed in the sensorimotor cortex known as the μ rhythm. The functional role of the μ rhythm seems to be similar to the visual α rhythm. When a motor act is prepared, observed, imagined or executed robust modulations of the μ rhythm are seen over the sensorimotor cortex (Salmelin & Hari, Reference Salmelin and Hari1994, Pfurtscheller & Neuper, Reference Pfurtscheller and Neuper1994; Pfurtscheller et al. Reference Pfurtscheller, Pregenzer and Neuper1994, Reference Pfurtscheller, Brunner, Schlogl and Lopes da Silva2006; Stancak & Pfurtscheller, Reference Stancak and Pfurtscheller1996; Babiloni et al. Reference Babiloni, Brancucci, Arendt-Nielsen, Babiloni, Capotosto, Carducci, Cincotti, Romano, Chen and Rossini2004; Muthukumaraswamy et al. Reference Muthukumaraswamy, Johnson and McNair2004). A decrease in μ is observed in sensorimotor areas that are involved in performing the motor action, while at the same time an increase is observed in sensorimotor areas ipsilateral to the engaged body part. With this, it is thought that sensorimotor μ has a similar function as α in the sensory cortex, to functionally inhibit cortical areas (Salmelin & Hari, Reference Salmelin and Hari1994; Neuper et al. Reference Neuper, Wortz and Pfurtscheller2006).
Although μ modulation has been related to failing suppression of motor responses in healthy subjects (Mazaheri et al. Reference Mazaheri, Nieuwenhuis, van Dijk and Jensen2009), little research has been done on the μ rhythm in ADHD patients. Yordanova et al. (Reference Yordanova, Kolev and Rothenberger2013) measured mid-line electroencephalographic μ band activity during motor responses in an auditory attention task in children with ADHD. Although there were no differences in μ suppression during motor response generation, the ADHD group did show μ suppression after stimuli that did not require motor responses (Yordanova et al. Reference Yordanova, Kolev and Rothenberger2013). This could support the idea that diminished μ modulation is involved in impulsive motor responding in ADHD. Another magnetoencephalography (MEG) study investigated somatosensory μ modulation after median nerve stimulation in adults with ADHD, showing diminished μ reactivity in ADHD, especially with unpredictable stimulation (Dockstader et al. Reference Dockstader, Gaetz, Cheyne and Tannock2009).
Notably, in both patient studies, deviant μ modulation was related to preparation and anticipation. When anticipating and preparing a goal-directed motor action task relevant motor regions should be ready to engage on demand, while at the same time activity in task-irrelevant motor areas should be suppressed. In ADHD, μ modulation could be impaired resulting in insufficient inhibition of task-irrelevant cortical areas causing unwanted and disruptive motor output. To test this hypothesis we set out to investigate: (1) whether preparatory sensorimotor μ modulation is impaired in patients with ADHD by evaluating hemispheric μ lateralization; and (2) whether the ability to modulate sensorimotor μ relates to the ability to suppress disruptive motor actions, as expressed by ADHD symptom severity in daily life. To this end analyses were conducted on pre-existing MEG data recorded in a group of adults with and without ADHD when performing a visual–spatial attention task that required (preparing for) motor responses.
Method
The dataset that was used for the analysis was published before elsewhere; for more details, see ter Huurne et al. (Reference ter Huurne, Onnink, Kan, Franke, Buitelaar and Jensen2013). The study was approved by the local medical–ethical committee (Committee for Protection of Human Subjects of the Arnhem/Nijmegen region; CMO protocol number 2009/260) and was performed according to the declaration of Helsinki. Written informed consent was obtained from all participants prior to study entry.
Subjects
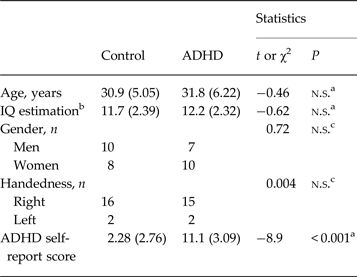
A total of 41 adults (aged 21–40 years) were recruited from an existing database, the Dutch cohort of the International Multicenter persistent ADHD CollaboraTion (IMpACT) study (Hoogman et al. Reference Hoogman, Aarts, Zwiers, Slaats-Willemse, Naber, Onnink, Cools, Kan, Buitelaar and Franke2011). After excluding six participants for reasons described below, 17 ADHD patients and 18 intelligence quotient (IQ)-, age-, handedness- and gender-matched healthy control subjects remained for final analysis. For demographic information, see Table 1. Subjects in the patient group met the Diagnostic and Statistical Manual of Mental Disorders, 4th edition, text revision( DSM-IV-TR) criteria of ADHD, and none in the control group did. All participants were assessed using the Diagnostic Interview for Adult ADHD (Kooij, Reference Kooij2007; http://www.divacenter.eu/DIVA.aspx). In addition, a quantitative measure of clinical symptoms was obtained using the self-report of the ADHD DSM-IV Rating Scale (DuPaul & Anastopoulos, Reference DuPaul and Anastopoulos1998; Kooij et al. Reference Kooij, Buitelaar, van den Oord, Furer, Rijnders and Hodiamont2005). General exclusion criteria were any (co-morbid) psychiatric, as assessed using the Structured Clinical Interview for DSM-IV (SCID-I), or neurological disorder and prescription medication use (other than psychostimulant or anti-conceptive drugs). If subjects used psychostimulants they were requested to temporarily discontinue their medication (at least 18 h) before and during the experiment. An estimation of IQ was made using a subset of the Wechsler Adult Intelligence Scale (WAIS-III; Wechsler, Reference Wechsler1997). Handedness was determined using the Edinburgh Handedness Inventory (Oldfield, Reference Oldfield1971).
Demographic information

Data are given as mean (standard deviation) unless otherwise indicated.
ADHD, Attention-deficit/hyperactivity disorder; n.s., not significant; IQ, intelligence quotient.
a t Test, accepted level of significance p < 0.05.
b IQ estimations of four control subjects were missing.
c χ2 test, accepted level of significance p < 0.05.
Task
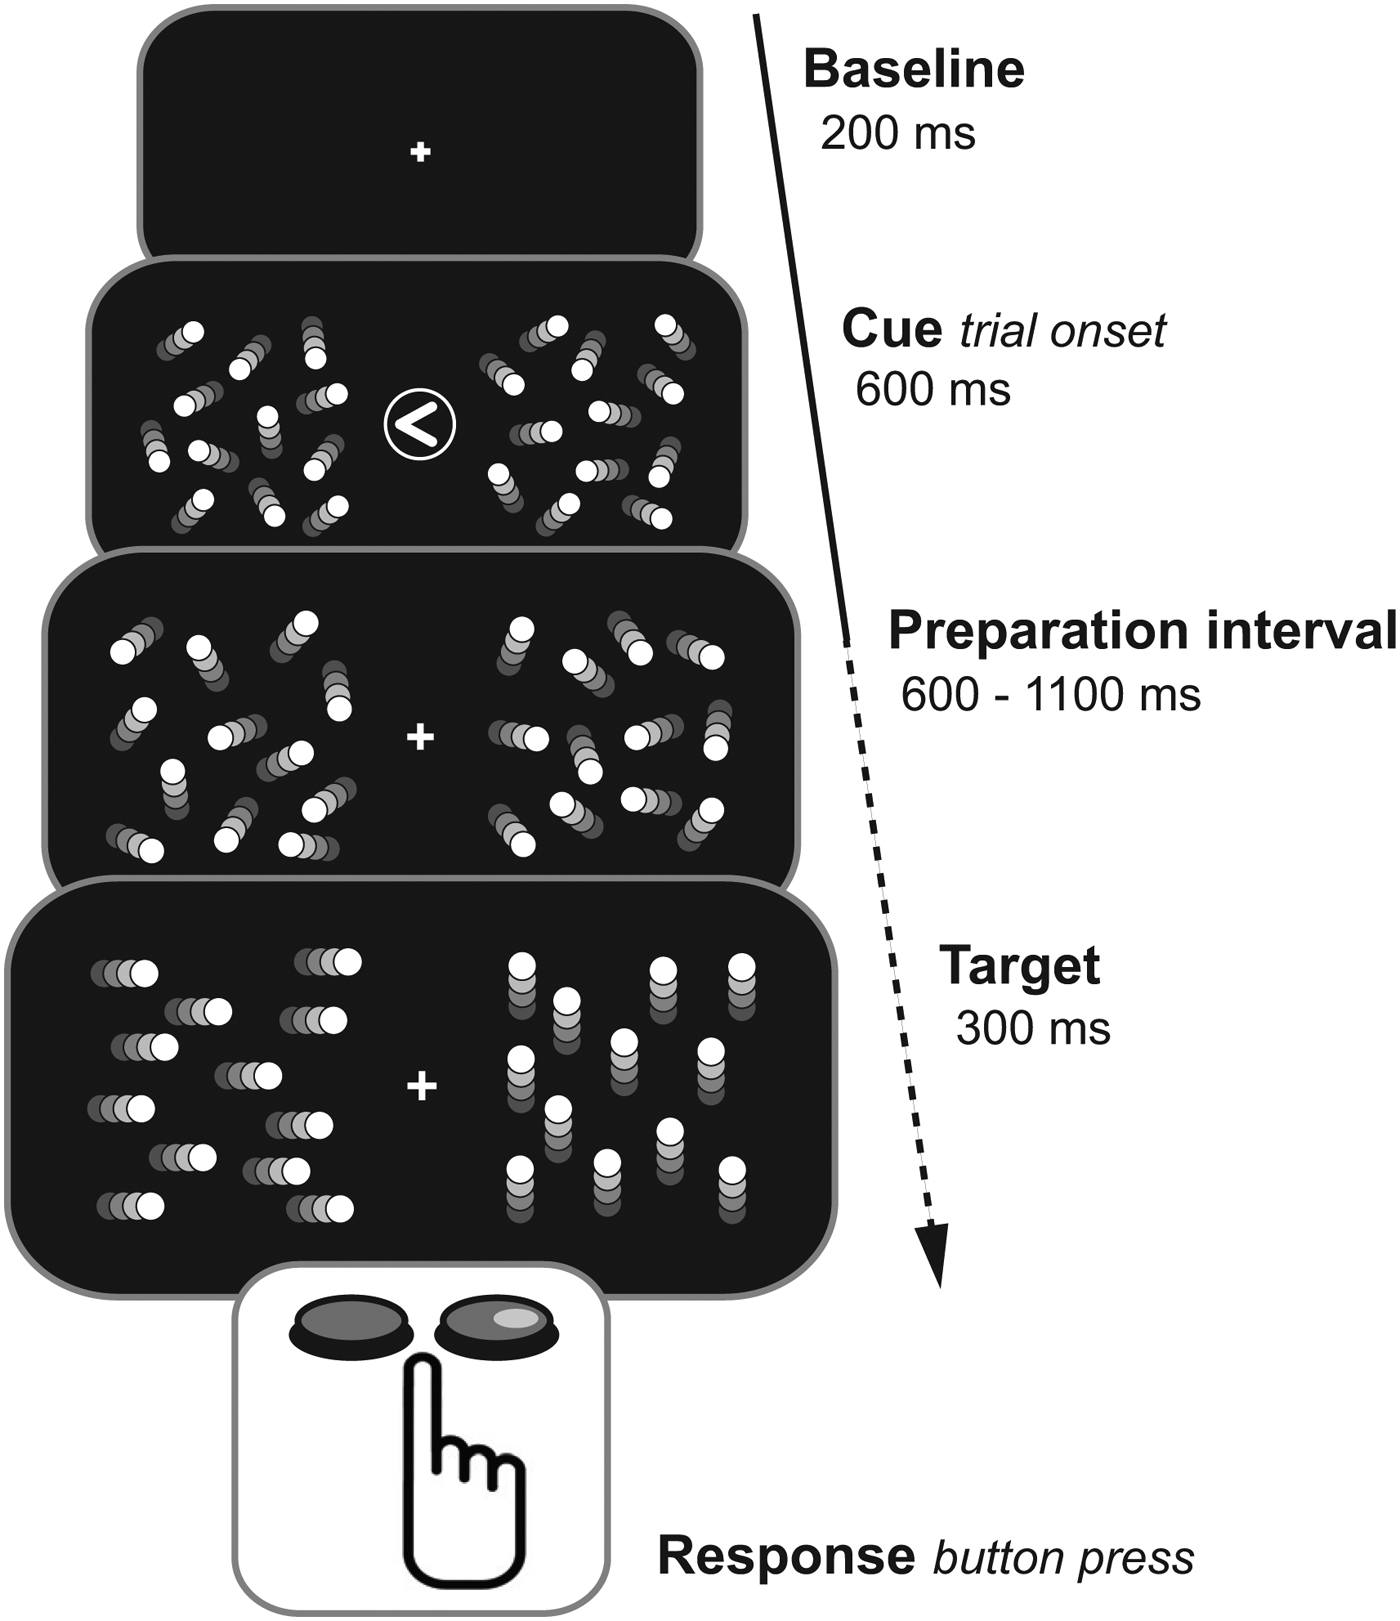
We used a cued visuospatial covert attention task. For the current study the cuing is not of interest. The basic outline of each trial was as follows (also see Fig. 1). After a baseline period of 0.6 s with no visual stimulation the trial would start. The start of the trial was marked by a visual cue presented centrally (an arrow pointing to the left or right) or in one-sixthof the trials a question mark (neutral cue condition) flanked on both sides by a random-dot-kinematogram (RDK). The cue would disappear after 0.2 s while the RDKs stayed on. After an jittered interval ranging from 0.6 to 1.1 s the dots in the RDKs would start moving coherently for 0.3 s, on one side horizontally (left- or rightwards) and on the other vertically (up- or downwards). Subjects were instructed to detect the direction of the horizontal movement. In 80% of the trials, the horizontal movement would be in the RDK on the cued side (‘valid cue trials’) and in 20% of the trials in the RDK on the non-cued side (‘invalid cue trials’). Subjects were instructed to respond as quickly as possible by pressing a left (for leftward movement) or right button (for leftward movement) using the index and middle finger of their dominant hand. After each trial, feedback was given on accuracy. A total of 864 trials were presented lasting 2–2.5 s. A session lasted about 45 min per subject. Prior to the recordings, subjects participated in a practice session with 120 trials lasting 5 min. During the experiment subjects were seated in front of a projector screen, with a distance of 72 cm between the eyes and screen. Subjects were instructed not to move during the experimental trials. The visual stimuli were presented using an EIKI XL 100 projector with a 60 Hz refresh rate. Behavioural responses were collected with a Current Designs HH-1 x 4-C fibre optic response device. We used the software Matlab Psychtoolbox for presenting the stimuli.
Schematic overview of the experimental paradigm. The arrow represents time. After a baseline period an attentional cue flanked by random-dot-kinetograms (RDKs) demarked the trial onset. Cue validity was 80%. After a jittered preparation interval, in one of the RDKs the dots would start moving coherently in a horizontal direction. Subjects had to report as quickly as possible in which direction the dots had moved by pressing one of two buttons using their dominant hand.

MEG acquisition
A 275-sensor whole-head MEG system with axial gradiometers (CTF, Inc., Canada), located at the Donders Centre for Cognitive Neuroimaging, Nijmegen was used to record oscillatory brain activity. Signals were low-pass filtered at 300 Hz and sampled at 1200 Hz. Eye movements were identified in records using an electro-oculogram (EOG) from electrodes placed at the lateral canthus of each eye, and eye blinks from electrodes placed above and below the left eye. Using three head-localization coils (positioned on the nasion and two ears), x, y and z coordinates were recorded to calculate head positions with respect to the MEG sensor array (Stolk et al. Reference Stolk, Todorovic, Schoffelen and Oostenveld2013).
Data analysis
For each subject behavioural performance in terms of percentage correct responses (accuracy) was determined. One control subject was excluded from further analyses because performance was at chance level. Offline analysis of the MEG recordings was done using Matlab 7.5.0 and the Fieldtrip software package (http://www.ru.nl/fcdonders/fieldtrip/). Data were down-sampled to 600 Hz and low-pass filtered at 150 Hz. For each trial head movement was calculated with respect to the head position in the first trial and with respect to the preceding trial (inter-trial head movement). For one of the ADHD subjects data on head position were missing due to a technical error. For the rest of the subjects trials with head movement that exceeded 1 cm with respect to the first trial and beyond 1 mm with respect to the prior trial were rejected. The MEG signals were transformed from axial gradiometers to planar gradients to facilitate the interpretation of the topographic mapping of the magnetic fields (Bastiaansen & Knosche, Reference Bastiaansen and Knosche2000). The planar gradient makes data interpretation easier since the strongest field is situated above the neural source. Trials were visually inspected for horizontal shifts of gaze and muscle artifacts, rejecting trials with extremely high variance, muscle artifacts and sustained horizontal EOG shifts of more than 50 µV from baseline. Three control and two ADHD subjects were excluded from further analyses because more than two-thirds of their trials had to be rejected due to horizontal eye movement. Subsequently, independent-component analysis was used to identify eye-blink and heartbeat artifacts in the data (Jung et al. Reference Jung, Makeig, Humphries, Lee, McKeown, Iragui and Sejnowski2000). Artifactual components were semi-automatically identified by correlations between independent components (ICs) activation time courses and the vertical EOG and electrocardiography time courses. ICs with the strongest correlation were visually inspected and rejected.
For each trial, time-frequency representations (TFRs) of power were calculated with respect to trial onset (cue-locked; −0.6 to 1.4 s) and with respect to the button press (response-locked; −1.4 to 0.6 s). A fast Fourier transformation (FFT) approach was used. For frequencies between 5 and 30 Hz with a resolution of 1 Hz an adaptive sliding window (shifting in 0.05 s steps) of five cycles length (Δt = 5/f) was used after multiplying a Hanning taper. To calculate the modulation in power (event-related synchronization and event-related desynchronization), TFRs of all trials were baseline corrected using a relative change baseline of −0.25 to −0.1 s with respect to trial onset. The data of all trials were averaged, using all condition types (neutral cue, valid cue and invalid cue) both correctly and incorrectly answered.
To select two regions of interest (ROIs) the cue-locked data were used, averaging the TFR data of all trials and all subjects irrespective of group or handedness (n = 35). To minimize selection bias we avoided using the response-locked data and contrasts that were later used to investigate the main hypotheses (see next paragraphs). Selection criteria for the RIOs were: two homologue groups, one group in each hemisphere, of three contingent sensors with the strongest power increase in the 10–12 Hz frequency band, in the 0.4–0.8 s time interval after trial onset (cue-locked data). This topographic distribution and frequency band correspond to prior reports of sensorimotor μ power modulation (Pfurtscheller & Neuper, Reference Pfurtscheller and Neuper1997; Pfurtscheller et al. Reference Pfurtscheller, Neuper and Krausz2000, Reference Pfurtscheller, Brunner, Schlogl and Lopes da Silva2006). The time interval was chosen such that subjects were preparing for an upcoming motor action, but at the same time avoiding spill of the actual motor activity of the button press.
Next, for each subject time-resolved hemispheric μ lateralization indices (MLI) were calculated using the left and right ROI; μ refers to μ power; contra- and ipsilateral refer to the ROI with respect to the hand used for responding:
 $${\rm MLI} = \displaystyle{{\mu \; {\rm}_{{\rm Ipsilateral}} - \mu \; {\rm}_{{\rm Contralateral}}} \over {\mu \; {\rm}_{{\rm Ipsilateral}} + \mu \; {\rm}_{{\rm Contralateral}}}} $$
This allows the use of the same measure of μ lateralization for all subjects, irrespective of which hand was used for button presses.
Statistical analysis
In order to statistically test differences in hemispheric μ lateralization, two periods of interest were defined: (1) a baseline interval (−0.25 to −0.1 s with respect to trial onset), to assess whether there were differences in MLI between the groups at rest (no motor preparation); and (2) a pre-response interval, to assess whether there were differences in MLI between the groups when preparing for a motor action. The pre-response interval was defined such that it was as long as possible without overlapping with the baseline interval or the actual motor action. To do so, the length of the frequency adaptive sliding window that was used for the FFT was taken into account (see Data analysis section). The length is greatest at the lowest frequency (10 Hz). With a window length of five cycles for 10 Hz, the window length was 0.5 s (5/10 Hz), 0.25 s on each side of the time point. With a minimal trial length of 0.8 s plus reaction time, we (conservatively) defined the start of the pre-response interval with respect to the button-press as −0.9 s added to the 0.25 s correction for window length (−0.65 s). The end was defined as the time of button press (t = 0 s) minus the 0.25 s correction for window length (−0.25 s). For each subject mean MLI was calculated for these time intervals and differences were statistically tested. Repeated-measures analyses of variance (ANOVAs) were used, with a between-subject factor group (control and ADHD) and a within-subject factor time interval (baseline and pre-response interval). All statistical analyses we done using SPSS 19.0 for Windows (IBM SPSS Inc., USA).
Results
There were no significant differences in demographic variables between the groups (Table 1), nor in mean total number of trials after rejections (control: 677, s.d. 144; ADHD: 701, s.d. 129; p = 0.61), nor in mean intra-trial head movement (control: 0.052, s.d. 0.023 mm; ADHD: 0.048, s.d. 0.025 mm; p = 0.66), as shown using independent-samples t tests. As expected, groups did differ in score on the ADHD self-report (control: 2.28, s.d. 2.76; ADHD: 11.1, s.d. 3.09; p < 0.001; see Table 1).
Behavioural data
As reported earlier, there were differences between the groups in task performance concerning effect of cuing (ter Huurne et al. Reference ter Huurne, Onnink, Kan, Franke, Buitelaar and Jensen2013). With respect to reaction times, the ADHD group did not benefit from cuing as the controls did. With respect to accuracy, the ADHD group showed a lack of cuing effect for right targets.
In the current study the effect of cuing was not of interest, so the data of all conditions independent of cue type were collapsed. There were no statistically significant differences between the groups in overall accuracy (control: 82.9, s.d. 10.2%; ADHD: 80.7, s.d. 11.7%; p = 0.55), nor in overall mean reaction time (control: 642, s.d. 93.1 ms; ADHD: 626, s.d. 90.4 ms; p = 0.59). As an additional measure of performance we regarded intra-individual variance in reaction time, as increased variability has been associated with ADHD (for a review, see Kofler et al. Reference Kofler, Rapport, Sarver, Raiker, Orban, Friedman and Kolomeyer2013). Also in our sample, mean reaction time coefficient of variability was higher in the ADHD group, but this difference was not statistically significant, although trending (control: 0.21, s.d. 0.036; ADHD: 0.24, s.d. 0.067; p = 0.11, equal variances not assumed; independent-samples t tests).
Sensorimotor µ lateralization
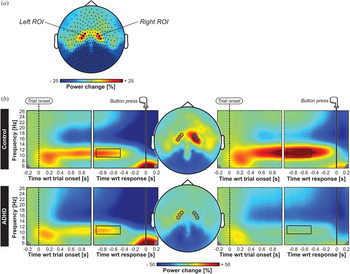
First, the two ROIs were identified using the cue-locked TFR data as described in the Method section (n = 35; f = 10–12 Hz; t = 0.4–0.8 s). Fig. 2a shows the two homologue groups of three contingent sensors with the strongest power increase in the specified time interval and frequency band that were selected. The topography is consistent with prior reports (Pfurtscheller & Neuper, Reference Pfurtscheller and Neuper1997; Pfurtscheller et al. Reference Pfurtscheller, Neuper and Krausz2000, Reference Pfurtscheller, Brunner, Schlogl and Lopes da Silva2006). Fig. 2b shows the TFRs and topographic plots for both the cue-locked and response-locked data of the two subject groups separately. The TFRs of both ROIs show a power increase in the 10–12 Hz μ band in the preparation interval. Although the overall μ power increase appeared to be weaker in the ADHD group (especially in the right hemisphere; see Fig. 2b right panels) the topography, time course and frequency range of μ were similar between the groups.
(a) Topographic representation of mean power of all subjects (n = 35), μ frequency range 10 to 12 Hz, time interval 0.4 to 0.8 s with respect to (wrt) trial onset (cue-locked data). Black dots denote the sensors with the strongest μ power increase which were selected as the left and right regions of interest (ROIs) that were later used to calculate the μ lateralization index. (b) Topographic plots and time-frequency representations (TFRs) of left and right ROIs for both groups separately. Left panels show the TFRs of the left ROI; the right panels the TFRs of the right ROI. Dotted lines denote trial onset; solid lines denote time of response. The black rectangles denote the corresponding time and frequency of the topographic maps shown in the middle. Black and white circles denote the left and right ROI sensors. Although μ band power increase seems less pronounced in the attention-deficit/hyperactivity disorder (ADHD) group (especially for the right hemisphere), the topography, time course and frequency range of μ are quite similar between the groups.

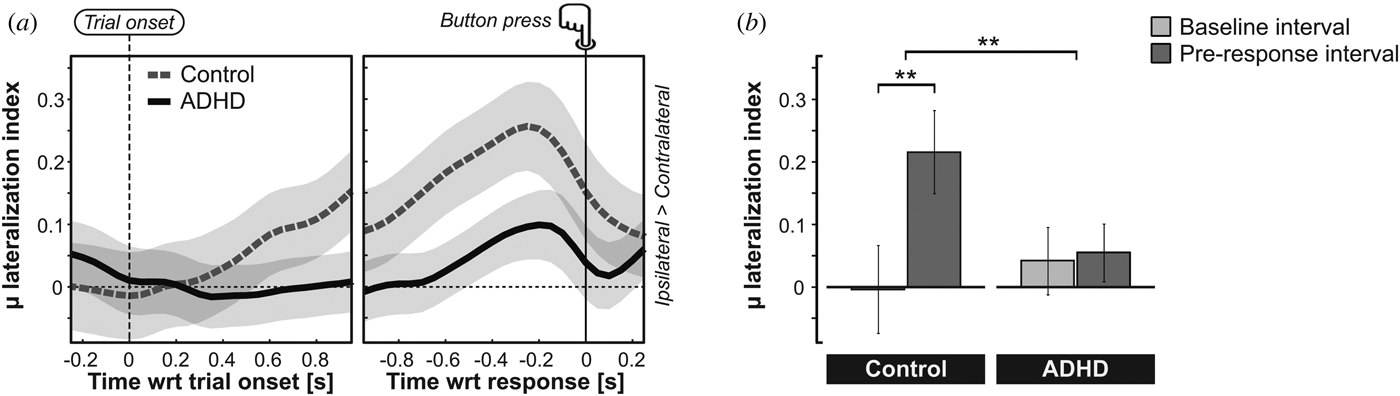
Using the selected ROIs, we then calculated the MLI (equation 1) for each subject. The MLI characterizes the hemispheric lateralization in the μ band with respect to the hand used for the button press. Fig. 3a shows the time course of mean MLI for both groups. A positive MLI corresponds to a relatively larger μ power in ipsilateral sensors as compared with contralateral sensors with respect to the response hand, i.e. a relatively increased μ activity in sensorimotor areas that are not engaged in the task. In the control group μ lateralization started to increase immediately after trial onset and kept increasing until the button press was made. The ADHD group showed a delayed and smaller MLI increase.
(a) Mean μ lateralization index (MLI) plotted against time for each group; light grey denotes standard error of the mean (s.e.m.). Left panel shows MLI with respect to (wrt) trial onset; right panel shows MLI wrt the button press (response). A positive MLI means higher μ in sensors ipsilateral than contralateral of the responding hand. Note that in the control group (dotted line) μ lateralizes increasingly in preparation for the response. In the attention-deficit/hyperactivity disorder (ADHD) group (solid line) μ lateralization starts later and is smaller. (b) Mean MLI in the baseline interval (t = −0.25 to −0.1 s wrt trial onset) and the pre-response interval (t = −0.65 to −0.25 s wrt button press) for both groups; ** p < 0.01; error bars denote s.e.m. The control group shows a statistically significant increase in MLI in the pre-response interval; in contrast, the ADHD group does not.

After calculating MLI for the baseline and pre-response interval, a repeated-measures ANOVA was done with a between-subjects factor group (control and ADHD) and a within-subject factor time interval (baseline and pre-response interval). The analysis revealed a significant two-way group × time interval interaction (F 1,33 = 8.70, p = 0.006) (see Fig. 3b ). Post-hoc analyses showed that in the control group there was a highly significant difference between the mean MLI in the baseline interval compared with the pre-response interval (0.004, s.e.m. 0.071; 0.216, s.e.m. 0.067, respectively; p < 0.0001). In contrast, there was no significant difference between the mean baseline and pre-response interval in the ADHD group (0.042, s.e.m. 0.054; 0.055, s.e.m. 0.046, respectively; p = 0.81). Comparing the groups, pre-response MLI was borderline significantly weaker in the ADHD group (p = 0.059), which is likely to explain the overall effect. There was no significant difference in baseline MLI between the groups (p = 0.61).
We conclude that there were distinct differences between the groups in terms of μ lateralization. The controls strongly lateralized μ band oscillations when preparing for the button press, with relatively higher μ power in sensors corresponding to the sensorimotor cortex ipsilateral to the responding hand. In the ADHD group, however, there was no such preparatory lateralization of μ.
Correlations between µ lateralization and ADHD symptoms
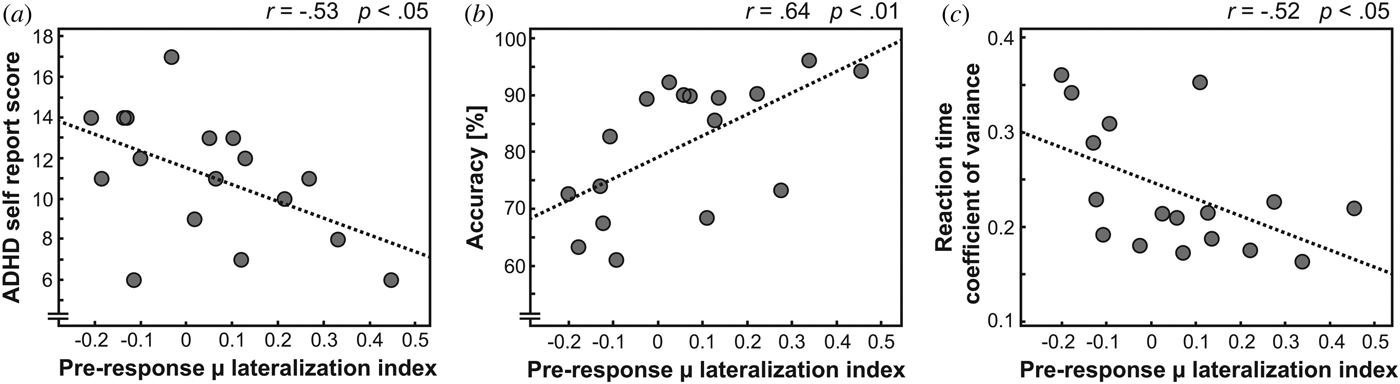
Next we investigated whether this diminished preparatory lateralization of μ oscillatory activity is associated with ADHD symptoms in daily life. The analysis revealed a statistically significant negative correlation between the individual pre-response MLI and the individual score on the ADHD self-report in the ADHD group (Spearman correlation; r s = −0.53, p = 0.028; Fig. 4a ). This means that the less an ADHD subject was able to lateralize the μ activity in preparation of a motor action, the more ADHD symptoms were present in daily life. Additional analyses revealed that pre-response μ lateralization was also predictive of performance on the task. A strong positive correlation was found between pre-response MLI and overall accuracy (r s = 0.64, p = 0.0052; Fig. 4b ) and a negative correlation between pre-response MLI and reaction time coefficient of variability (r s = −0.52, p = 0.033; Fig. 4c ). This shows that in the ADHD patient group relatively weaker preparatory μ lateralization was associated with relatively higher error rates and stronger intra-individual variability in reaction time. No significant correlation was found between pre-response MLI and mean reaction time (r s = 0.29, p = 0.25).
(a) Individual pre-response μ lateralization index (MLI) of the attention-deficit/hyperactivity disorder (ADHD) group plotted in relation to the number of ADHD symptoms as measured by the ADHD self-report. There is a negative linear relationship between μ lateralization strength and ADHD severity in daily life. (b) Pre-response MLI of the ADHD group in relation to accuracy on the task, showing a strong positive relationship between the degree of μ lateralization and accuracy. (c) Pre-response MLI of the ADHD group plotted in relation to reaction time coefficient of variability. Stronger μ lateralization is associated with smaller intra-individual variability in reaction time.

In sum, the control group showed strong modulation of μ oscillatory activity in preparation of an upcoming goal-directed motor action, with relatively higher μ power in task-irrelevant sensorimotor regions. However, the ADHD patient group failed to show this preparatory μ lateralization (Fig. 3). Moreover, the lack of preparatory μ lateralization in the ADHD group was not only predictive of performance on the task, but also of ADHD symptoms in daily life (Fig. 4).
Discussion
In the present study we investigated whether ADHD is associated with impaired modulation of the sensorimotor μ rhythm. MEG signals were recorded in a group of ADHD patients and a group of healthy controls performing a visual attention task involving preparation of a motor response.
As expected, robust μ rhythm modulation was measured in sensors above sensorimotor areas when subjects prepared for a motor response. In the healthy controls the increase in μ synchronization was strongly lateralized relative to the hand used for the button press, with relatively higher μ power in the ipsilateral compared with the contralateral hemisphere. The ADHD group, however, failed to show this increase in μ laterality in preparation of the response. Moreover, the degree of preparatory μ lateralization was shown to correlate negatively with the number of daily life symptoms of the ADHD patients. Additionally, we found that the individual degree of pre-response μ lateralization was predictive of accuracy on the task (positive correlation) and intra-individual variability in reaction time (negative correlation). Taken together, these results indicate problems in adequately modulating sensorimotor μ activity in preparation of motor actions in patients with ADHD. Not only is the individual extent of these problems predictive of behavioural task performance, it is also predictive of the amount of experienced problems in controlling disruptive motor activity and attentional processes in daily life.
Like in anticipatory attention, motor preparation is characterized by selection (Brunia, Reference Brunia1999). In order to achieve behavioural goals, relevant motor regions are selected and recruited, while others are selectively suppressed. In the current study subjects had to anticipate a target with unpredictable timing, ready to respond with a predetermined motor action. Crucial for maintaining the selected motor program is functional inhibition of task-irrelevant areas to guard it from disruption. Corroborating prior studies (Pfurtscheller et al. Reference Pfurtscheller, Pregenzer and Neuper1994; Babiloni et al. Reference Babiloni, Brancucci, Arendt-Nielsen, Babiloni, Capotosto, Carducci, Cincotti, Romano, Chen and Rossini2004), the control group showed a relative increase in μ rhythm over task-irrelevant sensorimotor areas in preparation of the response to prevent disruption or interruption by task-irrelevant movement.
Interestingly, in the ADHD group this demarcation between task-relevant and task-irrelevant areas as expressed by a difference in μ activity was diminished. Yordanova et al. (Reference Yordanova, Kolev and Rothenberger2013) found an abnormal drop in μ reactive to a non-target in ADHD, probably corresponding to failing reactive suppression of motor regions. We now show that ADHD is also characterized by failing proactive functional inhibition of motor cortical areas by tonically increasing μ to prevent unwanted movement (Aron, Reference Aron2011).
The individual ability to lateralize μ proved to be predictive of behavioural performance on the current task and ADHD severity as measured by the ADHD self-report. This underlines the importance of functional inhibition of the sensorimotor cortex by μ, not only in an experimental setting, but also in daily life function. Furthermore, modulation of sensorimotor μ could prove a useful biological marker of ADHD, mutually enforced by other disorder specific alterations in neuronal oscillatory activity (Mazaheri et al. Reference Mazaheri, Coffey-Corina, Mangun, Bekker, Berry and Corbett2010, Reference Mazaheri, Fassbender, Coffey-Corina, Hartanto, Schweitzer and Mangun2014).
At this point, the exact neuro-anatomical origin of the reduced μ lateralization in ADHD is unknown. Likely candidates are disruptions in function of the prefrontal cortex and the basal ganglia (Rubia et al. Reference Rubia, Overmeyer, Taylor, Brammer, Williams, Simmons and Bullmore1999, Reference Rubia, Taylor, Smith, Oksanen, Overmeyer and Newman2001; Teicher et al. Reference Teicher, Anderson, Polcari, Glod, Maas and Renshaw2000; Clark et al. Reference Clark, Blackwell, Aron, Turner, Dowson, Robbins and Sahakian2007; Chambers et al. Reference Chambers, Garavan and Bellgrove2009; Cubillo et al. Reference Cubillo, Halari, Ecker, Giampietro, Taylor and Rubia2010; Majid et al. Reference Majid, Cai, Corey-Bloom and Aron2013) and also the thalamus (Hughes & Crunelli, Reference Hughes and Crunelli2005; Devos et al. Reference Devos, Szurhaj, Reyns, Labyt, Houdayer, Bourriez, Cassim, Krystkowiak, Blond, Destee, Derambure and Defebvre2006; Saalmann et al. Reference Saalmann, Pinsk, Wang, Li and Kastner2012).
A methodological limitation to the present study is that the data had been used for analyses in a prior study (ter Huurne et al. Reference ter Huurne, Onnink, Kan, Franke, Buitelaar and Jensen2013). Although it is encouraged to maximize benefits from patient datasets, this might increase risk for spurious results. Therefore follow-up studies should be done replicating our findings. Furthermore, self-report measures were used to assess daily-life ADHD symptoms. Clinically rated symptom scales could be preferable, as a subset of ADHD patients is recognized to be unable to reliably rate their symptoms themselves.
The present results are further evidence that impaired regulation of α band activity is part of the neural substrate of ADHD. After showing behavioural implications of aberrant modulation of α band activity in the sensory system in ADHD (ter Huurne et al. Reference ter Huurne, Onnink, Kan, Franke, Buitelaar and Jensen2013) we now show aberrant modulation of same frequency band μ rhythm in the motor system, which is predictive of ADHD severity. Combined, this presents evidence for a central role for aberrations in modulation and orchestration of α band oscillations in ADHD, affecting multiple functional domains. Future studies should focus on dynamics and interactions of α band oscillatory activity on a network level. In addition, the effect of pharmacological interventions on α modulation should be assessed.
Acknowledgements
The authors gratefully acknowledge funding from The Netherlands Organization for Scientific Research (NWO): a VICI grant (453–09–002) to O.J., and from Karakter Child and Adolescent Psychiatry to N.t.H. The work of J.B. for the current paper is supported by the European Community's Seventh Framework Programme (FP7/2007–2013) under grant agreement no. 278948 (TACTICS) and from the European Community's Horizon 2020 Programme (H2020/2014–2020) under grant agreements no. 643051 (MiND) and no. 642996 (BRAINVIEW).
The sample used in this study is part of IMpACT. IMpACT unites major research centres working on the genetics of ADHD persistence across the lifespan and has participants in the Netherlands, Germany, Spain, Norway, the UK, the USA, Brazil and Sweden. Principal investigators of IMpACT are: Barbara Franke (chair), Andreas Reif, Stephen V. Faraone, Jan Haavik, Bru Cormand, Antoni Ramos Quiroga, Philip Asherson, Klaus-Peter Lesch, Jonna Kuntsi, Claiton Bau, Jan Buitelaar, Stefan Johansson, Henrik Larsson, Alysa Doyle and Eugenio Grevet.
Declaration of Interest
J.B. has been in the past 3 years a consultant to/member of advisory board of/and/or speaker for Janssen Cilag BV, Eli Lilly BV, Lundbeck and Servier. He is not an employee of any of these companies, and not a stock shareholder of any of these companies. He has no other financial or material support, including expert testimony, patents and royalties. C.K. participated in an adult ADHD advisory and consultancy board for Eli Lilly BV and an adult-ADHD academy for Eli Lilly BV. All other authors have nothing to declare.