1. INTRODUCTION
Brazil is a case of persistent dismal education outcomes. Dating back to the early 19th century, the political elite was aware of the backward schooling situation in Brazil (Colistete Reference Colistete2016). According to Rui Barbosa, a well-known Brazilian statesman, «the truth […] is that we are a people of illiterates» (Barbosa Reference Barbosa1947, p. 8). In the early 20th century, Brazil lagged behind countries such as Argentina, Chile and Mexico in terms of enrolment rates (Lindert Reference Lindert2004). Moreover, Brazil universalised enrolments in primary school about a century after the United States and Canada, the early leaders on the continent (Engerman and Sokoloff Reference Engerman, Sokoloff and Haber1997). In 1930, approximately two-thirds of the adult population was illiterate in Brazil (Astorga et al. Reference Astorga, Bergés and Fitzgerald2005).
Although literacy rates substantially increased, Brazilian education remained backwards in comparative terms. In 2010, the average schooling of a Brazilian aged 15 or more was 7.8 years, a figure behind the averages of several poorer Latin American countries (Barro and Lee Reference Barro and Lee2013). In addition, Brazil has consistently presented one of the worst indicators in standardised proficiency tests including the Program for International Student Assessment, an exam promoted by the Organisation for Economic Cooperation and Development (OECD) that tests the abilities of reading, mathematics and science of 15-year-old students around the world (OECD 2016).
However, national figures hide divergences within the country. The country is well-known for its glaring regional inequalities and numerous studies have attempted to explain how historical factors shaped income inequality between Brazilian regions (Furtado Reference Furtado1959, Leff Reference Leff1972; Denslow Reference Denslow1973; Monasterio Reference Monasterio2010; Mattos et al. Reference Mattos, Innocentinni and Benelli2012; Naritomi et al. Reference Naritomi, Soares and Assunção2012; Reis Reference Reis2014; Funari Reference Funari, Bértola and Williamson2017). Furthermore, many studies have highlighted the role of human capital in the economic backwardness of north-eastern Brazil (Pessôa Reference Pessôa2001; Barros Reference Barros2012; Oliveira and Silveira Neto Reference Oliveira and Silveira Neto2016). However, research evaluating the causes of long-term educational performance in different states is scarce. Among the exceptions, Wegenast (Reference Wegenast2010) specifically addressed schooling and argued that land ownership inequality was closely related to current educational results in different Brazilian regions. Musacchio et al. (Reference Musacchio, Fritscher and Viarengo2014) argued that the current ranking of educational outcomes between states stemmed from trade shocks during the First Republic (1889-1930). In turn, Komatsu et al. (Reference Komatsu, Menezes-Filho, Oliveira and Viotti2019) reported that regions with a higher proportion of descendants of slaves currently show more inequality in years of schooling.Footnote 1
To some extent, this paper supports the findings of previous studies of educational inequality between Brazilian regions. However, none of the papers on regional differences dealt with measures of educational quality. As clearly demonstrated by Hanushek (Reference Hanushek, Durlauf and Blume2008) in the context of long-run economic growth in Latin America, quality is clearly more important than quantity, since years of schooling vary across the country. Therefore, this paper aims to measure both the quantity and quality of education in Brazil and its states from 1933 to 2010. Furthermore, we also attempt to compare Brazilian states to other Latin American countries, since some Brazilian states are larger than several neighbouring countries.
This study proposes at least two contributions to the literature on the economic history of education in Brazil. First, the paper provides a historical dataset containing national and state-level information on (a) enrolment rates and (b) distribution of enrolment across grades. By adding new sources, we constructed a brand new dataset for enrolment rates in Brazil between 1933 and 2010, in addition to building a data series for enrolment rates by state from 1955 to 2010. Moreover, we use an additional variable that measures enrolment distribution across grades by states in Brazil. The «grade distribution ratio» (GDR), devised by Frankema and Bolt (Reference Frankema and Bolt2006), provides information on retention in a nutshell.Footnote 2 In the absence of proficiency examinations in the past, other types of quality measures, such as GDR, are crucial for evaluating the history of schooling in underdeveloped countries—particularly in the case of Brazil. Frankema (Reference Frankema2009) used the GDR to analyse schooling evolution in Latin American countries. Here, we applied the GDR to Brazilian states and regions and found that the northern and north-eastern regions have consistently lagged behind other regions since the 1950s.Footnote 3
Furthermore, we compare the education outcomes of Brazilian states to those presented by neighbouring countries. We improved the methodology of Frankema (Reference Frankema2009) to compare enrolment rates between Latin American countries and included Brazilian states in the analysis. Comparing Brazilian states to Latin American countries matters because some Brazilian states share more similarities with neighbouring countries' historical experience than with other Brazilian states (e.g. the southern border presents more similarities with the Pampa economy than with north-eastern states).Footnote 4 In the case of GDR, the figures of Brazilian states were undoubtedly low, even by Latin American standards. We also demonstrate that Brazilian states were conditionally expected to present lower GDR compared to Latin American countries, on average, given a certain enrolment rate. In other words, retention was a more severe problem in Brazil than in neighbouring countries as early as 1970. These results validate other studies on high repetition rates in Latin America and Brazil (Schiefelbein Reference Schiefelbein1975; Ribeiro Reference Ribeiro1991). Even as early as 1970, enrolment rates were insufficient measures to assess education systems of Latin American countries, particularly in the case of Brazil.
Our findings corroborate research on the economic backwardness of north-eastern and northern regions; states in these areas presented worse outcomes both in terms of primary level enrolment rates and retention (GDR) during the analysed period. In fact, some north-eastern states presented similar enrolment rates and lower indicators of progression compared with those presented by the poorest Latin American countries.
Hence, the current paper is organised as follows: after the Introduction, we describe data and sources for constructing the dataset in section 2. In section 3, we present enrolment rates and GDR by states and Brazilian regions throughout the entire period. In section 4, we undertake a comparative description of enrolment rates and GDR between Brazilian states and Latin American countries in 1970. Section 5 presents concluding remarks.
2. DATA AND SOURCES
2.1 Enrolments
Enrolment figures are available in several sources of the Instituto Brasileiro de Geografia e Estatística (IBGE) and Ministério da Educação e Cultura (MEC). The most well-known source is Anuário Estatístico do Brasil (AEB), the Brazilian Statistical Yearbook. An electronic version compiling data from several editions of the AEB is available online (IBGE 2003).Footnote 5 However, the AEB did not contain enrolments by states; therefore, we added additional sources from MEC.
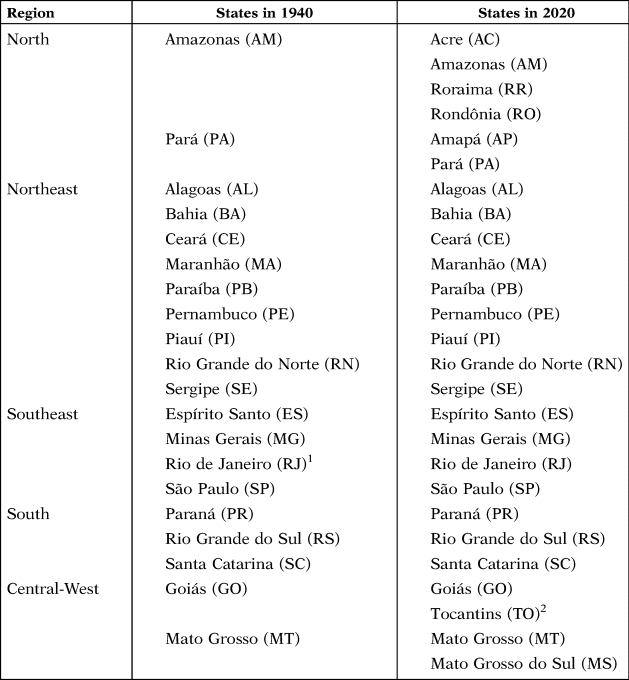
State-level enrolments are only available for primary education (grades 1-8) from 1955 to 2010. A report authored by Goldenberg (Reference Goldenberg1990) is the major source of state-level enrolments by grades in primary education. From 1995 onwards, enrolment data are available on the National Institute of Education Research (INEP) website, a research centre of the Ministry of Education.Footnote 6 Other documents were used for further verification, although information on the number of total enrolments and enrolments by grade in 1988, 1989, 1990 and 1994 is missing.Footnote 7 In order to ensure statistical consistency through time, we used Brazilian states as defined in 1940. Table 1 shows a list of Brazilian geographical regions and states with their abbreviations in 1940 and 2010.
BRAZILIAN STATES, 1940 AND 2020

1 The former Distrito Federal before 1960 was located in the Southeast, whereas after the construction of Brasília, the new capital, the Distrito Federal moved to the Central-West.
2 Tocantins is part of the North region.
A legal change in 1971 required our dataset to be adapted, as Law 5,692/1971 reorganised the existing grades into different educational stages. This change in legislation increased the first schooling level by adding four grades and merging the former primary (ensino primário) and lower secondary levels (ensino médio—primeiro ciclo). The new 8-year level was named ensino de primeiro grau and relabelled as ensino fundamental in 1996 (henceforth «new primary education»). Consequently, the lower secondary level was separated from the upper secondary level in 1971. The 3-year ensino médio—segundo ciclo was renamed ensino de segundo grau in 1971 and then ensino médio after 1996 (henceforth «new secondary education»).
The 1971 change entailed a grade redistribution between different educational stages despite the fact that the total number of years of schooling remaining unchanged, making the construction of datasets difficult. There is relatively complete aggregate data on the old primary education (ensino primário) until 1970. From 1970 onwards, aggregate data regarding the new primary education (ensino fundamental) are available. Nevertheless, we made all the necessary adaptations to construct a continuous dataset, as Maduro (Reference Maduro2007) had also done even though he did not explicitly acknowledge it.Footnote 8 There are slight differences between our dataset and that of Maduro, particularly in the 1970s and 1980s. Besides finding and organising national enrolment data, we collected data on enrolments by state and grade. Data on state-level enrolments allow us to look at regional differences within a continental country, while data on enrolment by grade provide information on the concentration of enrolments in the first grades, evidence of high incidence of repetitions and dropouts.
2.2 School-Age Population
Population figures are based on official demographic censuses (IBGE 1940-2010). There are several ways of interpolating population data. We followed Souza (Reference Souza2016) and used cubic spline functions to avoid kinks in the census years.Footnote 9 Previous studies have used other kinds of interpolation, although we expected only slightly different results among the estimates.
Since 1940, Brazilian censuses have presented population by single years of age. From the 1970 census onwards, population figures by single years of age are available through electronic means and microdata. Before 1970, electronic means only provided population by 5-year age groups. Maduro (Reference Maduro2007) only used 5-year age groups for the whole period. In order to construct the 7-14 age group, Maduro took three-fifths of the 5-9 age group plus the total population of the 10-14 group. Similarly, he obtained the 15-17 age group by taking three-fifths of the 15-19 group. By doing so, Maduro assumed that population distribution across single years of age within a 5-year age group was uniform, which is inaccurate if birth rates are increasing or decreasing. Nonetheless, hard copies of the 1940, 1950 and 1960 censuses contain population by single year of age. Although those data suffer from age heaping problems, particularly regarding ages ending with 0 or 5, directly picking the age group of interest (e.g. the number of children aged between 7 and 14 years) is certainly a better option than using proportions of 5-year age groups to finally build the age group of interest.Footnote 10
In order to obtain inter-census estimates, we interpolated the age groups of our interest through a cubic spline function. Furthermore, we opted for the default spline method available on the splinefun package in R software and the FMM method, which stands for the study of Forsythe et al. (Reference Forsythe, Moler and Malcolm1977) according to the splinefun package documentation. The cubic spline interpolation applied provides internally consistent estimates: summarising state-level interpolated data equals nation-wide interpolations. The same consistency principle also applies to different age groups; thus, we did not have to worry about interpolating the entire population between censuses.Footnote 11
2.3 Grade Distribution Ratio (GDR)
Frankema and Bolt (Reference Frankema and Bolt2006) developed the GDR approach, which is defined by the following equation:
 $$GDR_{1-N} = \displaystyle{{\sum\nolimits_{i = ( n + 1) }^N {g{_i}} } \over {\sum\nolimits_{i = 1}^n {g{_i}} }} \times \displaystyle{n \over {N-n}}$$
in which N is the total number of grades, n is a grade between 1 and N and gi is the share of students enrolled in grade i.
In order to analyse the distribution of enrolments by grade for the new primary education (ensino fundamental) in Brazil, we considered the range between grades 1 and 8. Frankema (Reference Frankema2009) used national figures from several Latin American countries. Here, we make two extensions. First, we computed a complete national series of GDR figures in Brazil from 1955 to 2010. Secondly, we did the same for Brazilian states. We followed Frankema (Reference Frankema2009) for international comparisons and used the GDR between grades 1 and 6. Therefore, data are widely available for those grades across Latin American countries since primary education is comprised of the first six grades in most educational systems:
 $$GDR_{1-6} = \displaystyle{{\sum\nolimits_{i = 4}^6 {g_i} } \over {\sum\nolimits_{i = 1}^3 {g_i} }}$$
If we assume that «the influx of people is constant over time, the ratio of grades 4 to 6 over 1 to 3 expresses the chance that a pupil in grades 1 to 3 reaches the higher grades 4 to 6 without repeating grades or dropping out» (Frankema Reference Frankema2009, p. 377).Footnote 12
As stated in the introduction of this section, the GDR has the advantage of being a summary indicator, facilitating comparative analyses. On the contrary, the standard GDR methodology does not consider demographic changes. One way of tackling this problem is through a slight modification of the formula. However, this is not necessary if the countries and regions in the analysis are approximately in the same demographic transition stage. In the case of Latin America, we do not expect demographic factors to lead to considerable distortions in a cross-country or cross-regional analysis.Footnote 13
3. ENROLMENT RATES AND RETENTION IN BRAZIL, 1933-2010
In the first subsection, we present yearly estimates of enrolment rates for the whole country. Enrolments by states and regions are presented subsequently. In this section, we use subdivisions under Brazilian legislation since 1971.
3.1 Gross and Net Enrolment Rates in Brazil
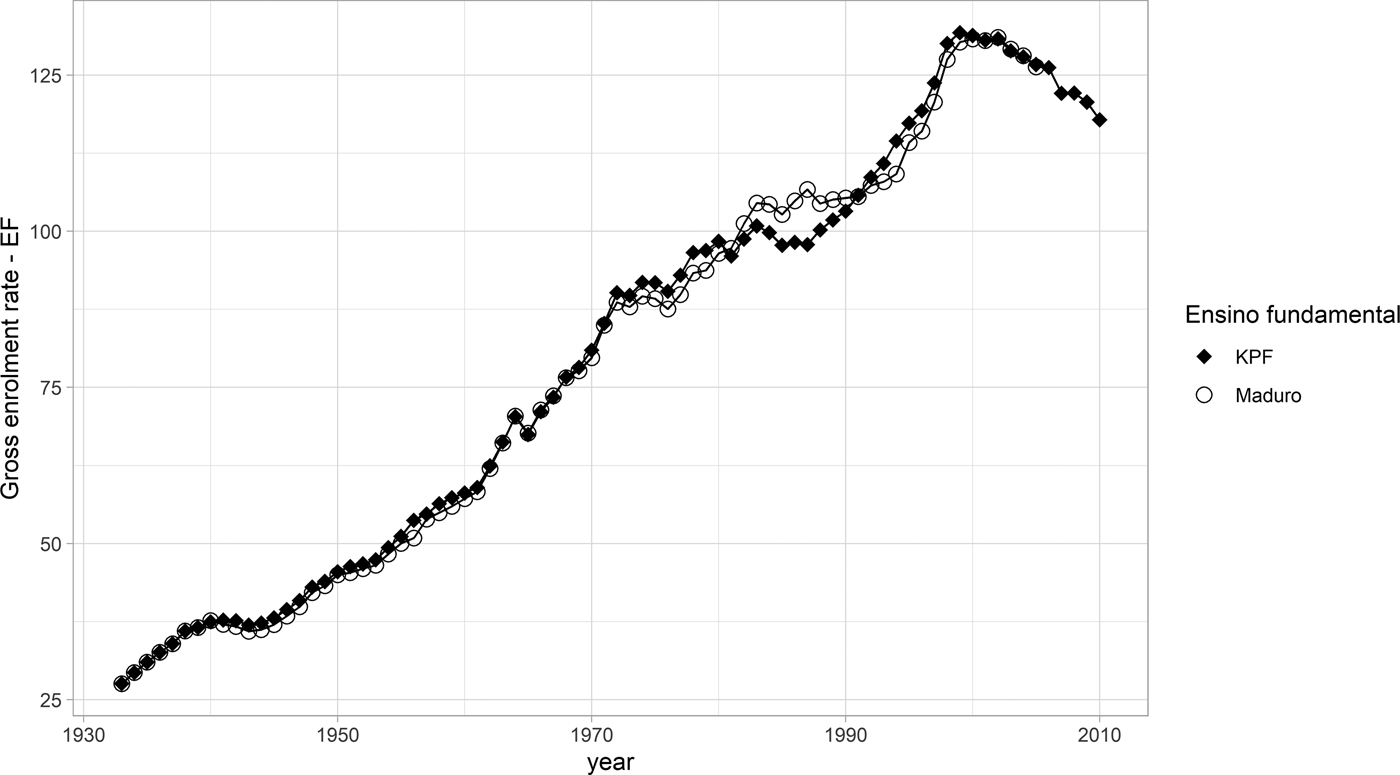
Information on gross enrolments in Brazil since 1933 is available. Since we did not have population by single years of age before 1940, we estimated enrolment rates between 1940 and 2010. Between 1933 and 1939, we kept the estimates of Maduro (Reference Maduro2007). Our national estimates of enrolment rates in the new primary education are similar to the series of Maduro, as shown in Figure 1 (Pearson correlation of 0.997). Discrepancies between the estimates are somewhat larger in the 1970s and 1980s. According to both estimates, the country achieved 100 per cent of gross enrolment rates in the early 1980s. The similar results in national estimates of enrolment rates in the new primary education (and ensino médio, see online Appendix A) make us confident in our estimates by states and regions, presented in the next subsection.Footnote 14
GROSS ENROLMENT RATES, NEW PRIMARY EDUCATION (ENSINO FUNDAMENTAL—EF), BRAZIL, 1933-2010.
Source: See section 2.

Maduro (Reference Maduro2007) did not provide any estimates on net enrolment rates, which are only found consistently from 1979 onwards for the new primary education (eight grades). Net enrolment rates are defined as the «total number of students in the theoretical age group for a given level of education enrolled in that level, expressed as a percentage of the total population in that age group».Footnote 15 If net enrolment rates are low, it shows that few students of a given age group were enrolled in the schooling level they were supposed to be.
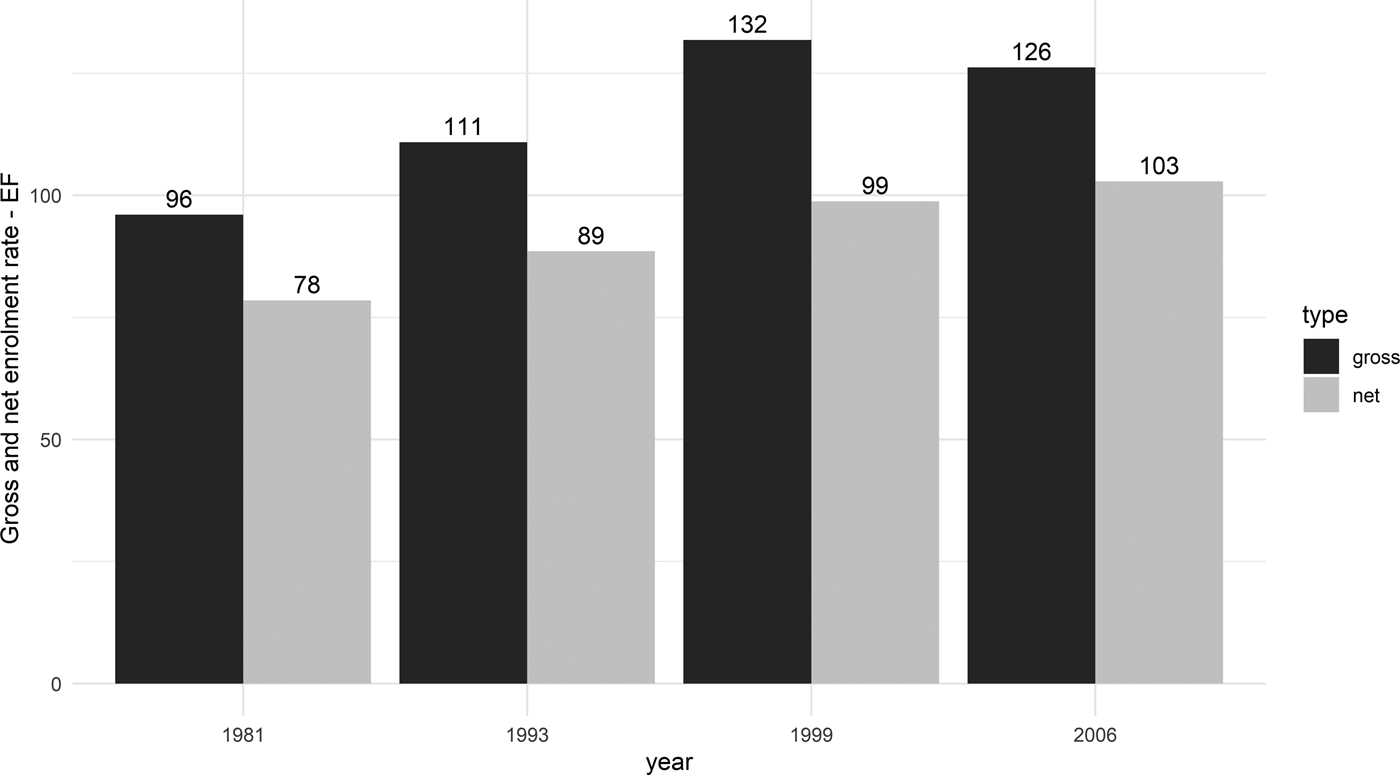
As depicted in Figure 2, even though the gross enrolment rate achieved 100 per cent in the early 1980s, net enrolment rates show that more than one-fifth of the children aged between 7 and 14 were not enrolled in the new primary education in 1981. The universalisation of the first level was achieved in practice only during the 1990s. The information in Figure 2 shows that net enrolment rates reached 99 per cent in 1999.Footnote 16
GROSS AND NET ENROLMENT RATES, SELECTED YEARS, NEW PRIMARY EDUCATION (ENSINO FUNDAMENTAL—EF), 1981-2006.
Source: See section 2.

3.2 Enrolment Rates by States and Regions
Assessing the situation of Brazil without looking at its regions and states is a major problem considering the size of the country, the glaring inequality between regions and their diverse historical backgrounds.Footnote 17 The relative backwardness of the Northeast vis-à-vis the Southeast (and between the northern and southern parts of Brazil, in general terms) has been widely acknowledged. The Southeast has been richer, more industrialised and urbanised, while the Northeast has been the poorest region of the country since at least the mid-19th century (Baer Reference Baer1964; Williamson Reference Williamson1965; Leff Reference Leff1972; Desnlow Reference Denslow1973; Monasterio Reference Monasterio2010; Barros Reference Barros2012; De Carvalho Filho and Monasterio Reference De Carvalho Filho and Monasterio2012; Naritomi et al. Reference Naritomi, Soares and Assunção2012; Reis Reference Reis2014; Pereira Reference Pereira2020).
There are two major lines of explanation for the origins of high regional inequality in the country. Several scholars have attributed spatial inequality in the Americas to the adoption of extractive institutions (Engerman and Sokoloff Reference Engerman, Sokoloff and Haber1997; Acemoglu et al. Reference Acemoglu, Johnson and Robinson2001; Bruhn and Gallego Reference Bruhn and Gallego2012). To some extent, this story could be extended to within-country regional divergences and applied to the north-south divide in Brazil. Other studies have associated the wider gap between regions and countries to trade shocks (Coatsworth Reference Coatsworth2008; Williamson Reference Williamson2010; Arroyo-Abad Reference Arroyo-Abad2013). In the Brazilian case, the end of the sugar and cotton cycles, which were mostly grown in the Northeast, was followed by a coffee export boom in the Southeast (Leff Reference Leff1972; Pereira Reference Pereira2020). Leff (Reference Leff1972) argued that Dutch disease effects and high transportation costs in 19th-century Brazil led to lower incomes in the Northeast.
Pereira (Reference Pereira2020) did not find any evidence for exchange rate effects and argued that excessive export taxes decreased profits; the relative backwardness of the north-eastern region would have started before the coffee boom. In summary, institutional aspects, trade-related effects or a combination of the two negatively affected the Northeast—which may have included the ability to provide adequate schooling (Musacchio et al. Reference Musacchio, Fritscher and Viarengo2014). Furthermore, the southern and south-eastern regions also benefited from immigration, which increased the demand for schooling since some immigrants came from countries where schooling was more widespread among the population (De Carvalho Filho and Colistete Reference De Carvalho Filho and Colistete2010; De Carvalho Filho and Monasterio Reference De Carvalho Filho and Monasterio2012; Rocha et al. Reference Rocha, Ferraz and Soares2017).
Through the 20th century, industrialisation did not reverse these patterns—as persistence played a larger role (Monasterio Reference Monasterio2010). The growing manufacturing industry concentrated in the Southeast and consolidated the dominant position of the region. Some studies have highlighted that a combination of agglomeration economies and human capital from immigrants interacted and made the Southeast a suitable area to centralise industrial activities (Cano Reference Cano1977; Versiani Reference Versiani1993). In spite of the large migration from the Northeast to the industrial Southeast after 1950, there was only a slow convergence among Brazilian sub-units (Azzoni Reference Azzoni2001; Reis Reference Reis2014). Some scholars pointed out that, despite regional development policies, the priority given to highways at the expense of railroads also contributed to the low productivity of more distant rural areas in the North and the Central-West (Reis Reference Reis2014). Furthermore, the north-eastern region's GDP per capita was about a quarter of the corresponding figure in the Southeast around 1950. Although the gap decreased over time, this ratio was still about a third in the early 1980s. In the extreme cases of each region, São Paulo State's GDP per capita (the wealthiest state) was almost eight times larger than the GDP per capita of Maranhão (the poorest state) in the early 1970s (Azzoni Reference Azzoni1997). Taking stock, from the late 19th century on, the distribution of per capita income remained relatively stable (Monasterio Reference Monasterio2010).
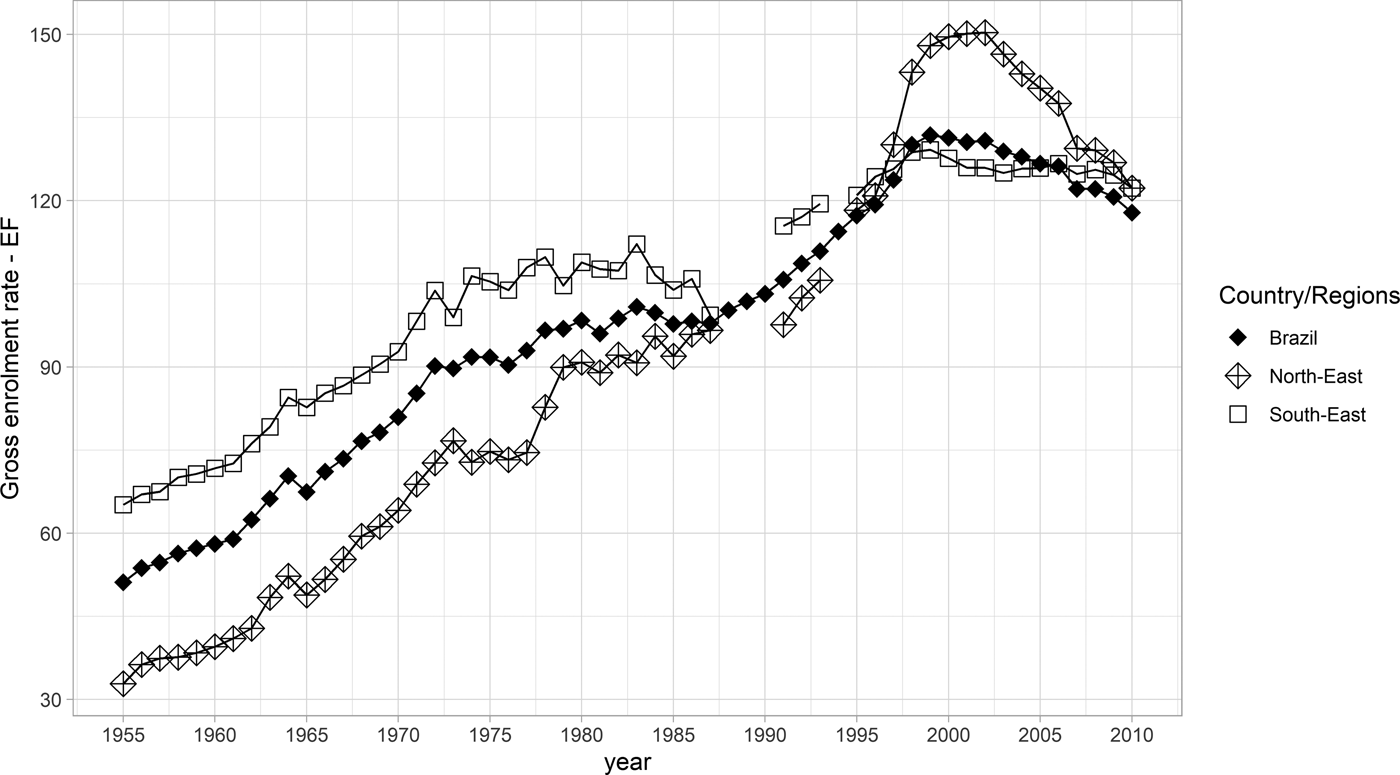
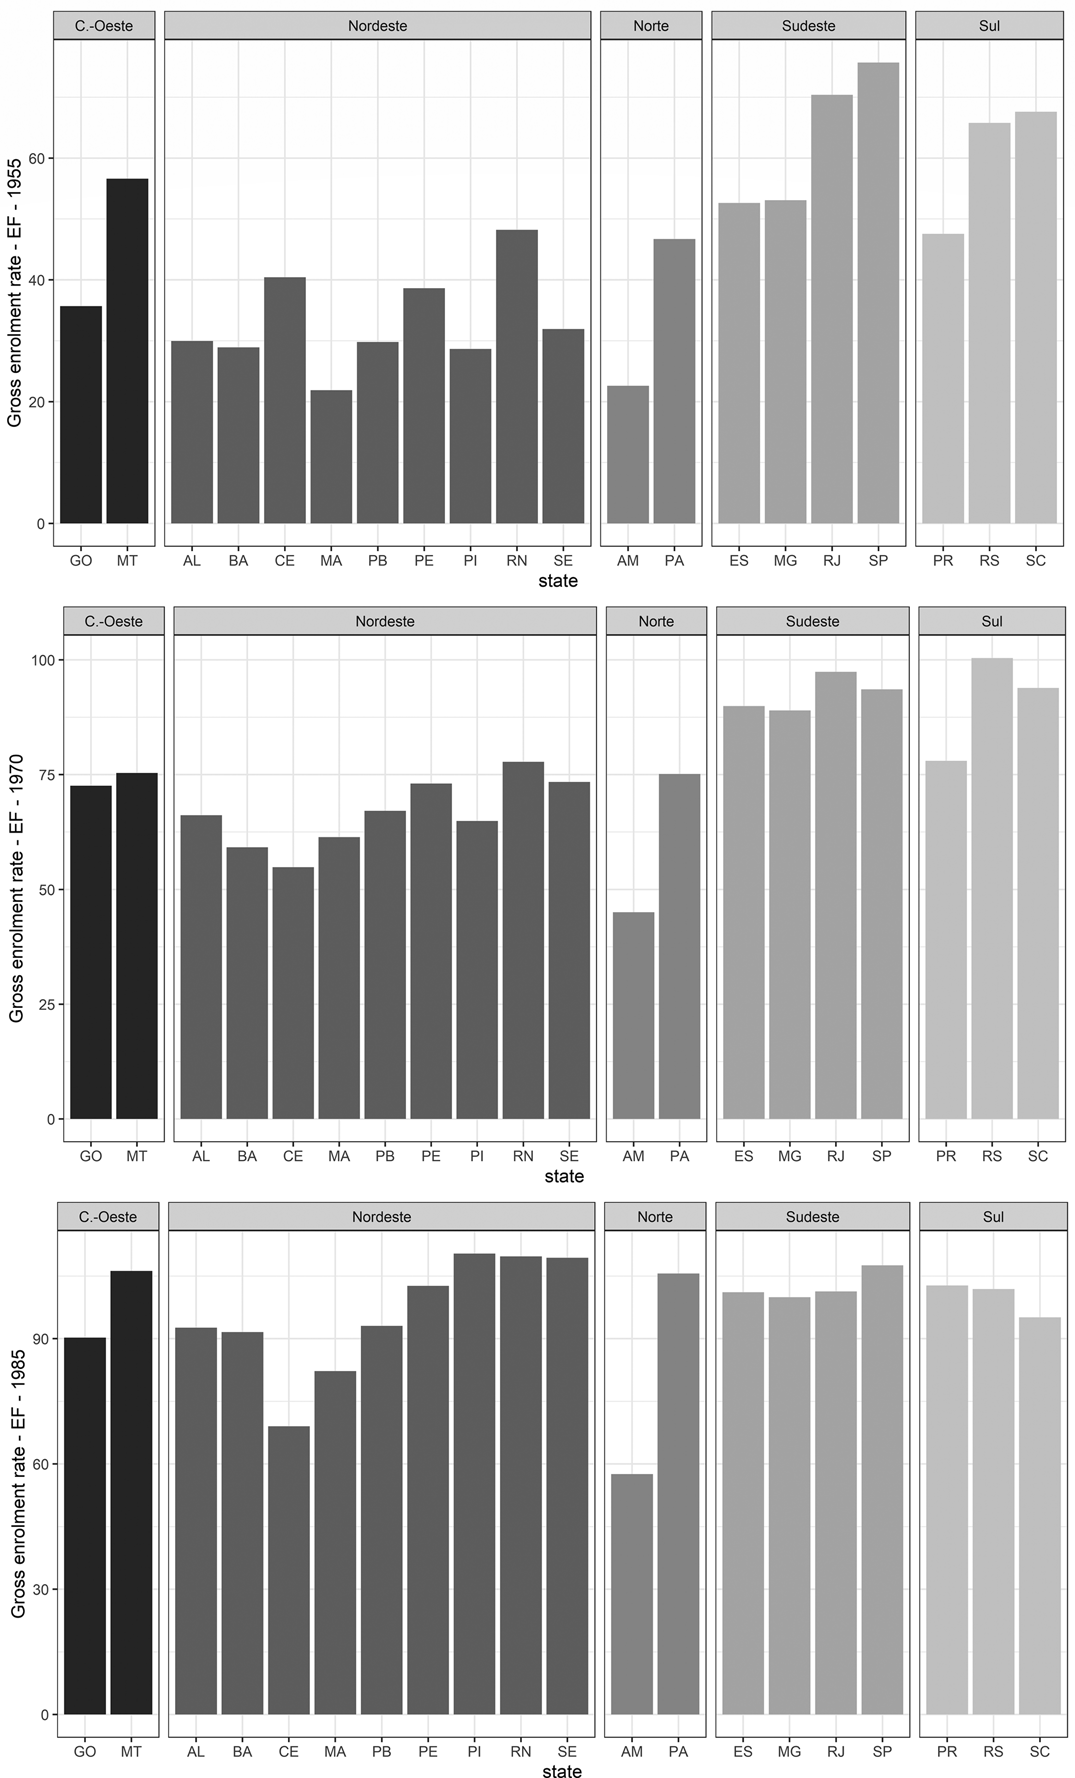
The story was not much different regarding educational indicators, as highlighted by the enrolment gap between rich and poor regions in Brazil in Figure 3. Considering only the new primary education, the gross enrolment rate in the modern Southeast was about 65.2 per cent, whereas in the mostly rural and backward Northeast it was only 32.9 per cent in 1955.Footnote 18 National estimates were somewhere in the middle (51.1 per cent). Two decades later, the country had already developed a large and diversified manufacturing sector of durable goods. In 1975, the industrial Southeast had already surpassed a gross enrolment rate of 100 per cent, although Northeast's rate was only 74.8 per cent—including older students retained in a certain level for whatever reason.
GROSS ENROLMENT RATES, NEW PRIMARY EDUCATION (ENSINO FUNDAMENTAL—EF), NORTHEAST AND SOUTHEAST REGIONS, BRAZIL, 1955-2010.
Source: See section 2.

The Central-West's performance was not much different from the North and Northeast, whereas Southeast and South were in the lead (Figure 4). Despite the fact that the southern region received more European immigrants in proportion to its population, the more industrialised and urbanised Southeast presented similar enrolment rates during the period under analysis. Fifteen years later, the Central-West had caught up with its southern neighbours and distanced itself from the northern states. At the end of military rule, almost all states had surpassed 100 per cent regarding gross enrolment rates, but some backward states in the Northeast such as Ceará and Maranhão were far from catching up with their counterparts.
GROSS ENROLMENT RATES, NEW PRIMARY EDUCATION (ENSINO FUNDAMENTAL—EF), BRAZILIAN STATES, 1955, 1970 AND 1985.
Note: States are identified by their abbreviations. See Table 1 for a list of Brazilian states (with abbreviations) and regions.
Source: See section 2.

There was an acceleration of enrolment rates in the mid-1980s, including the regions depicted in Figure 4. Some scholars have argued that the turn to democracy and the enactment of a new constitution in 1988 played a positive role in improving educational indicators.Footnote 19
3.3 Enrolments by Grade and GDR
Gross enrolment rates were already low without taking into consideration the distribution of pupils across grades in Brazil. Taking into account enrolments by grade, the system was inefficient according to international standards. Some Brazilian states, mostly in the northern and north-eastern areas, have historically presented a pattern of enrolment flows comparable to the lowest Latin American performers. The comparative analysis of the GDR for Brazilian states bluntly exposes the country's educational backwardness as a whole and the dismal situation of some specific regions.
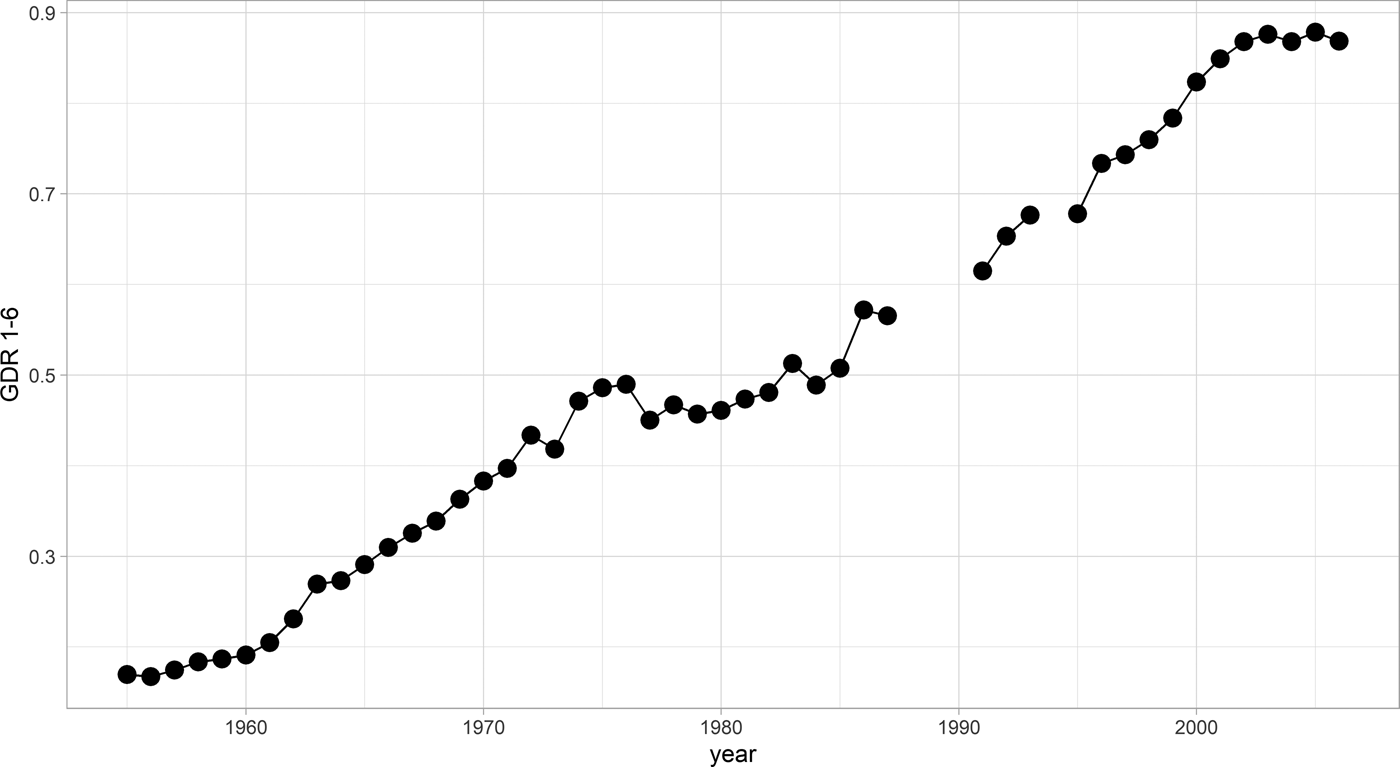
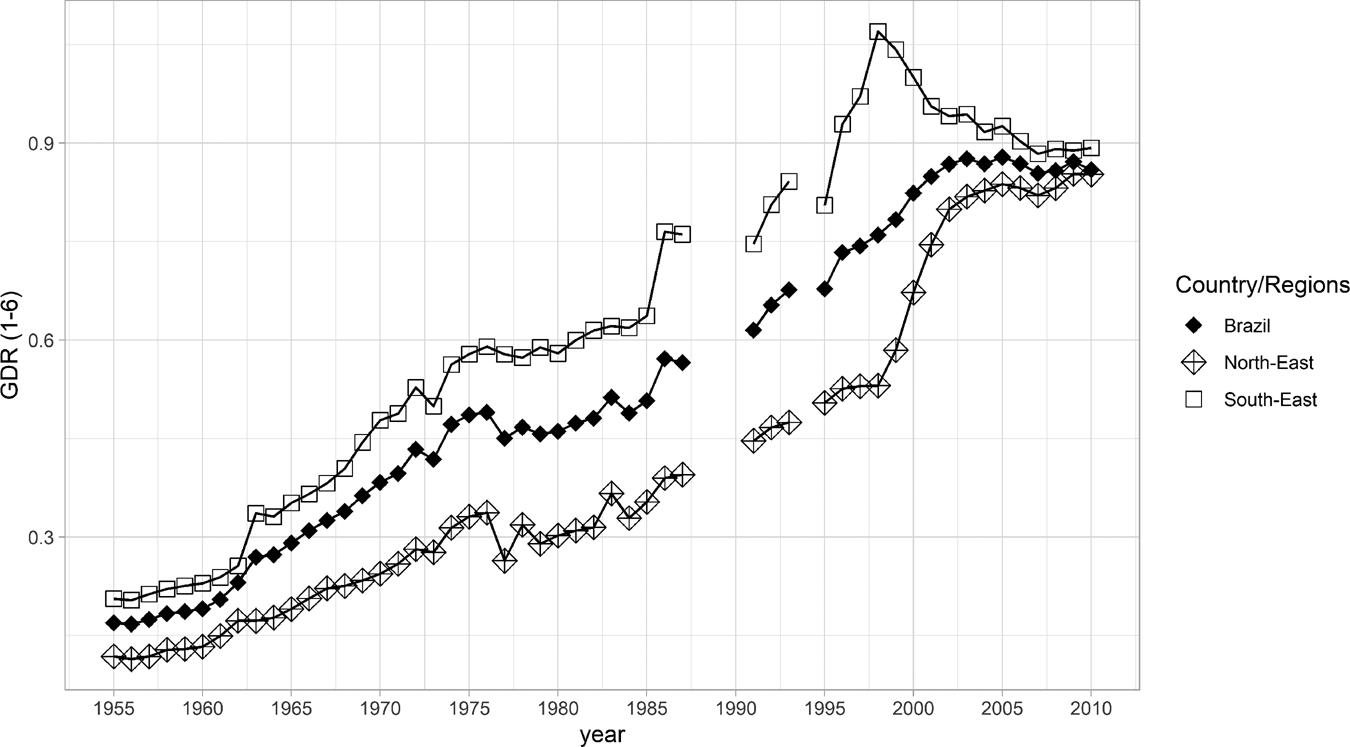
Instead of calculating the GDR, we could have taken several indicators such as repetition and dropout rates for all countries. Unfortunately, such indicators are not widely available. Since the GDR is a synthetic indicator that comprises repetition and dropouts, it is a helpful tool for comparative analysis. The evolution of both enrolment rates and GDR of the new primary education through time is demonstrated in Figure 5. From the mid-1970s to the late 1980s, GDR growth stalled. A possible explanation for this GDR stagnation could be a positive shock on enrolments in the first grades in times of demographic growth. However, there was no acceleration of enrolment rate growth; on the contrary, the enrolment rate increases also stalled during that period. Rather than a rise in enrolments leading to GDR stagnation, the reverse hypothesis is more likely: an increase in repetitions and/or dropouts probably led to a slowdown in enrolment rate growth. Regional GDR (Figure 6) reveals that the slowdown affected both the Southeast and the poorer Northeast from the mid-1970s until at least the mid-1980s.
GDR, 1-6 GRADES, NEW PRIMARY EDUCATION (ENSINO FUNDAMENTAL—EF), BRAZIL, 1950-2010.
Source: See section 2.

GDR, 1-6 GRADES, NEW PRIMARY EDUCATION (ENSINO FUNDAMENTAL—EF), BRAZIL, NORTHEAST AND SOUTHEAST, 1955-2010.
Source: See section 2.

If a sudden increase in enrolments cannot explain the slowdown, then other candidates must be considered. First, the Brazilian military regime expanded access to tertiary education from 1968 onwards, which depleted resources from lower levels and may have led to lower outcomes (Ames Reference Ames1973; Brown Reference Brown2002). Secondly, central government decisions on tax policy impoverished subnational governments throughout the 1970s, directly affecting resources available for basic levels (Kang and Menetrier Reference Kang and Menetrier2020). Even with the 1971 schooling reform, which gradually abolished the entrance examination to the lower secondary level, GDR stagnated.
Nevertheless, the contemporary literature asserts that retention was caused more by high repetition rates than by dropouts, at least in the early 1980s. Statistical data from the Brazilian Ministry of Education mistakenly ascribed a greater weight to dropouts for explaining the lack of school progression. According to Schiefelbein (Reference Schiefelbein1975), this was not only the case in Brazil; there was a general underestimation of repetition rates in Latin American countries. Based on data from sample household surveys in the early 1980s, some Brazilian scholars forcefully argued that repetition rates in Brazil were much higher than claimed by official statistics.Footnote 20 Pupils who stopped attending school before the end of the school year were not considered repeaters in the following year's statistics because of a mistaken assessment system (Fletcher Reference Fletcher1985; Klein and Ribeiro Reference Klein and Ribeiro1991; Fletcher and Castro Reference Fletcher and Castro1993).
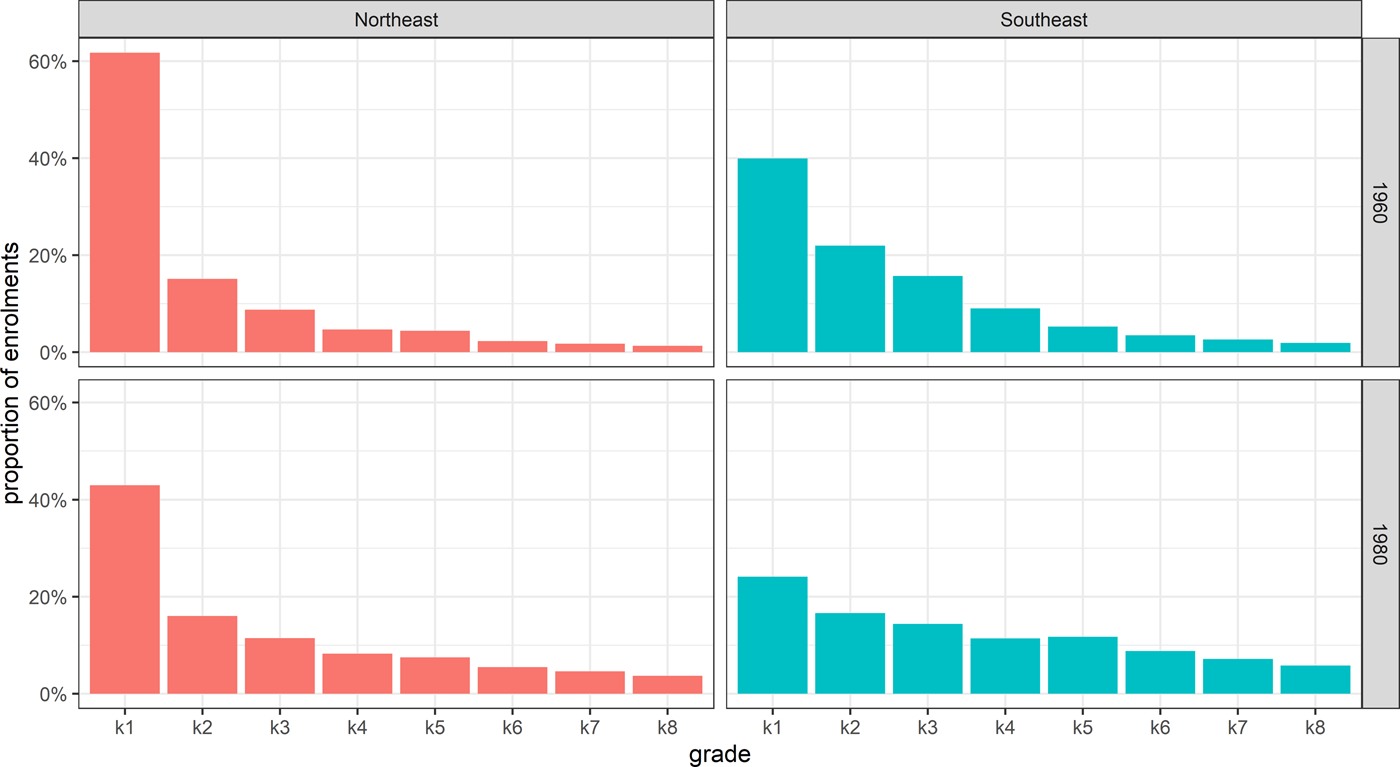
According to Sergio C. Ribeiro (Reference Ribeiro1991), the probability of a new first-grade student progressing to the next grade was close to zero in the north-eastern region. Indeed, this region's situation was absolutely dismal; in 1960, over 60 per cent of the pupils enrolled at the primary level were concentrated in the first grade. In the industrial Southeast, 40 per cent of the eight-grade primary level students were enrolled as first-graders in the same year. Notably, the Northeast reached Southeast's figures just two decades later (Figure 7).
DISTRIBUTION OF ENROLMENTS BY GRADE, NEW PRIMARY EDUCATION (ENSINO FUNDAMENTAL—EF), NORTHEAST AND SOUTHEAST REGIONS, BRAZIL, 1960 and 1980.
Source: See section 2.

These findings seem consistent with the literature on regional inequality in Brazil. Our results indicate that persistence also held for education outcomes. States that have persistently presented dismal education outcomes were located in the north-eastern region. More prosperous states presented better outcomes regarding enrolment rates and retention in the south-eastern and southern regions at the primary level. In addition to within-country inequalities, the next section shows that Brazil was a backward country in school progression compared with other Latin American countries.
4. EDUCATION IN BRAZILIAN STATES AND LATIN AMERICA: A COMPARATIVE PERSPECTIVE
Enrolment rates in Brazil were comparatively low, taking international standards into account. Although Argentina had nearly universalised the first schooling level around 1950, Brazilian enrolment rates were about 67 per cent, according to Frankema (Reference Frankema2009). Countries such as Ecuador and the Dominican Republic, which were clearly not among the region's leaders, had higher enrolment rates. In fact, only poorer Central American countries had lower rates compared to Brazil.
However, we must consider that primary education was composed of four or five grades in some countries (e.g. Brazil until 1971) whereas completing the first educational stage required more years in others (e.g. eight grades in Bolivia or Chile). Aware that comparing primary level enrolment rates between a 4-year and 8-grade levels has limitations, texts in UNESCO Statistical Yearbooks warned that comparisons should be performed with care. In order to improve the comparative analysis, we made a slight change in the indicators. Rather than using each country's definition, we decided to use total enrolments in the first six grades—regardless of whether they belonged to the first or the second educational stage according to each country's regulation. Enrolment rates of the first six grades are comparable across countries.Footnote 21
The UNESCO Statistical Yearbooks provided only the percentage of students enrolled in each grade relative to the total enrolments in that schooling level. In some years, when the total number of enrolments by level was available, we retrieved the absolute number of enrolments by grade. We found information on total enrolments, the proportion of enrolment by grade in both primary and secondary levels (as defined by each country) and the school-age population from nearly all Latin American countries in 1970 and 1980, allowing us to compare both enrolment rates and GDR across countries in the region.
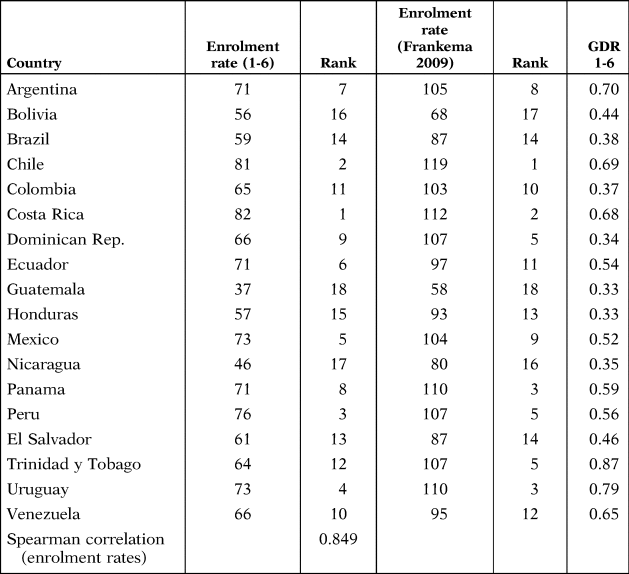
The difference between our calculations using only the first six grades and Frankema's (Reference Frankema2009) calculations of gross enrolment rates in 1970 is described in Table 2. Frankema adapted each country's denominator by multiplying the population between 5 and 14 years old by 10/n, where n is the number of grades of the first schooling level in each country. This explains why his estimates are expected to be constantly above our numbers (Table 2). According to our new estimates, Brazil's gross enrolment rates (1-6 grades) were slightly higher than that of Honduras and Bolivia, but worse than that of El Salvador. In this list of countries, Brazil was ranked fourteenth in a list of eighteen countries.
GROSS ENROLMENT RATES (FIRST SIX GRADES AND PRIMARY LEVEL ACCORDING TO EACH COUNTRY) (%) AND GDR 1-6, LATIN AMERICA AND CARIBBEAN COUNTRIES (SELECTED), 1970

Sources: Goldenberg (Reference Goldenberg1990); UNESCO (1973) and Frankema (Reference Frankema2009).
The same data source allows us to compare GDR across countries in 1970 (Table 2). According to the data, the Brazilian pattern of enrolments across grades was comparable with that presented by Colombia (0.38 and 0.37, respectively), whereas Latin America had already achieved 0.57. The relatively advanced southern and south-eastern regions had a GDR of 0.42 and 0.48, respectively, which is not very different from poorer economies such as Paraguay (0.43) and El Salvador (0.46). Simultaneously, the north-eastern region presented a dismal index of 0.24, not even close to any Latin American country in the database.
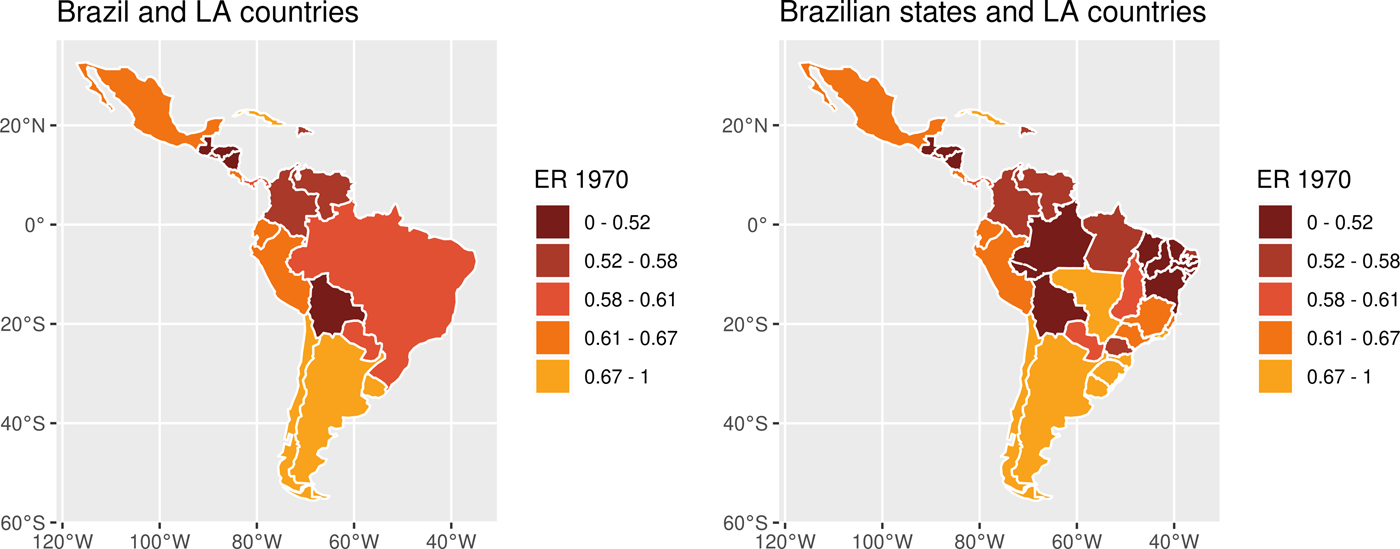
Enrolment and GDR data are jointly mapped in Figure 8: the left map presents enrolment rates, whereas the right one contains GDR. The categories are defined by the quintiles of the distribution of country-level data (including Brazil). The relative disadvantage of the Northeast and North in both variables is quite notable. Moreover, the GDR map shows that nearly all states in these regions presented ratios comparable to the lowest quintile of countries. The densely populated areas of São Paulo and Rio de Janeiro lessen the problem, increasing the country's overall indicators. Nevertheless, the populations of other regions are not negligible, as demonstrated in Figure 9.
GROSS ENROLMENT RATES 1970, GRADES 1-6, LATIN AMERICAN COUNTRIES AND BRAZILIAN STATES, 1970.
Source: See section 2.

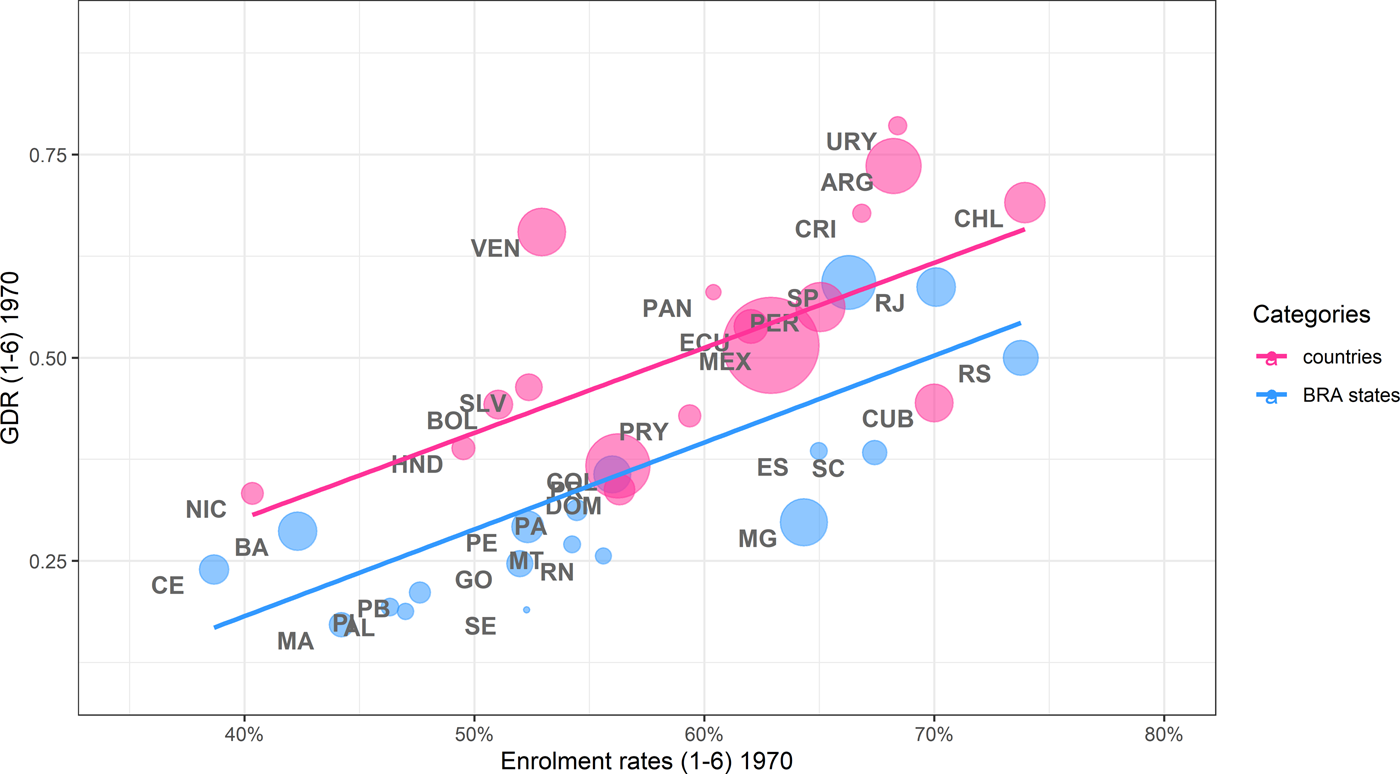
GROSS ENROLMENT RATES AND GDR, GRADES 1-6, LATIN AMERICAN COUNTRIES AND BRAZILIAN STATES, 1970.
Source: See section 2.

The same data in another useful setting for analytical purposes are shown in Figure 9.Footnote 22 First, each observation's size reflects the total population aged between 5 and 14 years in each country or Brazilian state. Most Brazilian states had larger populations compared to several Latin American countries. In addition, some states had meagre enrolment rates and GDR. According to our data, Brazilian states were expected to present lower GDR than neighbouring countries given a certain enrolment rate level. As highlighted in Figure 10, the result is qualitatively the same 10 years later, even though enrolment rates increased comparatively more in some Brazilian states vis-á-vis Latin American countries between 1970 and 1980.
GROSS ENROLMENT RATES AND GDR, GRADES 1-6, LATIN AMERICAN COUNTRIES AND BRAZILIAN STATES, 1980.
Note: Espírito Santo State was not included as it clearly presented an unlikely enrolment level given its historical trend in 1980. See online Appendix C.
Source: See section 2.

The maps in online Appendix B show the evolution of GDR in Brazilian states vis-à-vis Latin American countries between 1960 and 2000. Indeed, several Brazilian states lagged behind Latin American countries for decades. Brazil caught up with the Latin American average only at the turn of the century, when our comparative analysis of this indicator ends. Moreover, Brazil achieved a GDR of 0.82 in 2000, which is close to the Latin American average of 0.83 in the same year. Both the Southeast and the South had already achieved a GDR above 1.00. However, the Northeast lagged behind (0.67), and the North's situation was even worse (0.57). Although national GDR was similar to those of Paraguay or Colombia, the South, The Southeast and the Central-West were distinctly ahead of the rest of Latin America.
It is worth analysing the situation of some specific states, such as the north-eastern state of Ceará. Enrolment rates until the sixth grade in Ceará was 38.2 per cent (considering the population aged 5-14), a figure even higher than that of Guatemala (36.7 per cent). However, GDR in Ceará was 0.24, a figure substantially lower than the Guatemalan GDR (0.33) in 1970. Such a problem was widespread in northern and north-eastern states. Both enrolment states and GDR in those states were below other countries in similar latitudes such as Ecuador and Peru, although the GDR problem was more intense.Footnote 23 All the states in the lower-left portion of Figures 9 and 10 are located in the Northeast or in the North.
The same conclusion held for richer states. In addition to sharing similar climate conditions with Argentina and Uruguay, the southernmost state of Rio Grande do Sul was initially colonised by Spanish settlers since it was located west of the Tordesillas line. Like Uruguay, it specialised in cattle raising and received a huge flow of European immigrants (mostly in the late 19th and early 20th centuries). Moreover, Rio Grande do Sul and Uruguay shared not only a national border, but also the same enrolment rates (73 per cent of the population aged between 5 and 14 years in 1970). However, Rio Grande do Sul's GDR lagged substantially behind in 1970 (0.50 against 0.79 in Uruguay), only overtaking its neighbour in the 1990s. Apart from São Paulo, Rio de Janeiro and Distrito Federal (the industrial centre, the former capital and the new capital, respectively), all other states were below the Latin American expected mean given their enrolment rates.
5. FINAL REMARKS
In this paper, we provided national and state-level enrolment and retention indicators using a comparative perspective. Given the well-known regional inequality and the diverse historical experiences of different Brazilian regions, we also analysed Brazilian states. To do so, we built a new long-run dataset of education outcomes in Brazilian regions and states, since there was no long-run database on regional or state-level enrolment rates and GDR. For international comparisons, we reconstructed enrolment rates for Brazil and Latin American countries in 1970 and 1980. We also compared Brazilian states to Latin American countries using GDR as a further relative measure of education performance.
Although Brazil lagged behind several neighbouring countries in terms of enrolment rates, the GDR deserves a special mention; nearly all Brazilian states could be compared with the worst performers among Latin American countries in 1970 and 1980. Given a certain level of enrolment rate, Brazilian states were expected to present lower GDR. Furthermore, the poorer northern and north-eastern regions were also those with lower enrolment rates and GDR. Despite being expected, the degree of educational backwardness of such regions may be surprising. In the early 1960s, the situation in these regions was worse compared to the poorest Latin American countries. Furthermore, the performance of advanced regions was not much better bearing in mind the undemanding Latin American standards.
The country's persistently low GDR reinforces the conclusion that the Brazilian education system has always been in trouble. Given the scarcity of historical data on education in Brazil, expanding data sources is crucial for continuing the research agenda, particularly for empirical research on long-run growth and inequality, since schooling is expected to have a considerable role in both variables. Moreover, the history of educational performance matters not only for the instrumental role of education in generating economic growth, but also as an integral part of human development—and Brazil has been a laggard in the latter aspect.Footnote 24 As Birdsall et al. (Reference Birdsall, Bruns and Sabot1996) had already underlined two decades ago, Brazil is a special case of low performance even compared to its neighbouring countries. Further investigation on child labour markets and other determinants of demand for schooling should be developed in the future, whereas supply drivers such as elite behaviour and institutional reasons must also be considered.
SUPPLEMENTARY MATERIAL
The supplementary material for this article can be found at https://doi.org/10.1017/S0212610921000112.
ACKNOWLEDGEMENTS
This paper is based on the third chapter of Kang's (2019) doctoral thesis. Kang thanks the members of the thesis committee (Flavio Comim, Samuel Pessôa, Sergio Monteiro and Bill Summerhill). We thank Marcos Wink, Pedro Zuanazzi, Mariana Bartels, Renan Xavier, Gustavo Barros, Isabela Menetrier, Eric Schneider, Joana Genz Gaulke and Júlia Walter for comments and discussions. We also acknowledge comments from participants at the 5th Economic History Workshop at Insper, São Paulo (August 2018), the LSE Graduate Economic History Seminar (October 2018), the ILAS Lunchtime Seminar, London (November 2018) and the Gröningen FRESH Meeting (November 2018). Pedro H. G. Souza, Paulo Maduro, Luis Meloni, Henrique Dollabela and Raphael Gouvêa (at IPEA) provided data-related material or logistical support. Raphael V. Costa and other librarians at CIBEC-INEP facilitated the research providing access to several documents. We are also grateful to the editor and two anonymous referees for their contributions to this version. The usual disclaimer applies.
SOURCES AND OFFICIAL PUBLICATIONS
IBGE (1940-). Censo Demográfico. Tech. rep. Rio de Janeiro and Brasília: IBGE.
IBGE (2003). Estatísticas do Século XX. Tech. rep. Rio de Janeiro: IBGE.
INEP (2003). A educação no Brasil na década de 90. Tech. rep. Brasília: INEP.
MINISTÉRIO DA EDUCAÇÃO—MEC (1959a). Sinopse Retrospectiva do Ensino no Brasil 1871/1956. Rio de Janeiro: MEC.
MINISTÉRIO DA EDUCAÇÃO—MEC (1959b). Sinopse Retrospectiva do Ensino no Brasil 1933-1958. Rio de Janeiro: MEC.
MINISTÉRIO DA EDUCAÇÃO—MEC (1974). Estatísticas da Educação Nacional, 1971-73. Brasília: MEC.
MINISTÉRIO DA EDUCAÇÃO—MEC (1977a). Sinopse Retrospectiva do Ensino Médio 1956/1960. Brasília: MEC.
MINISTÉRIO DA EDUCAÇÃO—MEC (1977b). Sinopse Retrospectiva do Ensino Médio 1961/1965. Brasília: MEC.
MINISTÉRIO DA EDUCAÇÃO—MEC (1977c). Sinopse Retrospectiva do Ensino Médio 1966/1970. Brasília: MEC.
MINISTÉRIO DA EDUCAÇÃO—MEC (1977d). Sinopse Retrospectiva do Ensino Primário 1956/1960. Brasília: MEC.
MINISTÉRIO DA EDUCAÇÃO—MEC (1977e). Sinopse Retrospectiva do Ensino Primário 1961/1965. Brasília: MEC.
MINISTÉRIO DA EDUCAÇÃO—MEC (1977f). Sinopse Retrospectiva do Ensino Primário 1966/1970. Brasília: MEC.
MINISTÉRIO DA EDUCAÇÃO—MEC (1985). Retrato Brasil, 1970-1990. Brasília: MEC.