Introduction
Current research groups dedicated to the area of materials science have drawn interest in luminescent materials such as quantum dots (QDs). QDs are colloidal nanocrystalline semiconductors with special luminescent properties with relatively spherical morphology, narrow emission bands (typically 20–30 nm full-width at half-maximum intensity) and high photochemical stability.[Reference Bruchez, Moronne, Gin, Weiss and Alivisatos1] Luminescent QDs have great applications in light-emitting diodes,[Reference Hu, Gao, Prasad, Wang and Xu2] biological imaging,[Reference Subramaniam, Lee, Shah, Patel, Starovoytov and Lee3] and sensors.[Reference Tirado-Guizar, Pina-Luis, Paraguay-Delgado and Ramirez-Herrera4]
Tin oxide (SnO2) is a great semiconductor material with an exciton Bohr radius of approximately 2.7 nm.[Reference Lee, Ribeiro, Giraldi, Longo and Leite5] In particular, SnO2 has been widely used as gas sensors for monitoring the environment and as catalysts.[Reference Kolmakov and Moskovits6] For these types of applications, small size particles and large surface area are necessary to high performance.
Doping SnO2 nanoparticles (NPs) with small quantities of metals can improve the optoelectronic properties such as photoluminescence and optical band gap which would result in surface modification providing excellent electric properties and photocatalytic activities.[Reference Jia, Wang, Long, Fu, Wang and Zhang7] In particular, Zn–SnO2 NPs have been demonstrated to be great materials for improved power conversion efficiency in Dye-sensitized solar cell.[Reference Rani, Roy, Karar and Bhatnagar8] Additionally dilute magnetic semiconductors produced by doping transition metal ions into non-magnetic semiconductors are of interest for potential applications in spin electronics.[Reference Fitzgerald, Venkatesan, Douvalis, Huber and Coey9] Doped QDs also have been used as fluorescence sensors; Mn-doped ZnS QDs was used for the determination of 4-nitrophenol by QD fluorescence quenching.[Reference Liu, Chen, Lin and Lin10] Metal-doped SnO2 has also been studied to developed luminescent NPs,[Reference Azam, Ahmed, Habib and Naqvi11] obtaining particles with sizes between 7.1 and 16.2 nm without an optical shirt on their emission wavelength.
As can be seen from the above, the synthesis of doped semiconductors is of great interest for their potential applications in various areas. In particular, there are few reports of its use as photoluminescent sensors. Therefore, the synthesis of doped SnO2 QDs is an important topic in groups dedicated to optical materials. SnO2 NPs have been synthesized by various methods, such as combustion,[Reference Kiani, Samadi and Yaghoubyan12] laser ablation,[Reference Singh and Nakate13] spray-pyrolysis,[Reference Paraguay-Delgado, Antúnez-Flores, Miki-Yoshida, Aguilar-Elguezabal, Santiago, Diaz and Ascencio14] and hydrothermal.[Reference Tan, Wang and Wang15] However, these methods usually need of special equipment, a high-cost, and complicated process. Each method used for SnO2 can provide many NP morphologies with different surface areas; depending of these morphologies SnO2 has been used for applications in field emissions,[Reference Zhou, Wu, Li and Wang16] solar cells,[Reference Prasittichai and Hupp17] rechargeable Li batteries,[Reference Ye, Zhang, Yang, Li and Qi18] and sensors.[Reference Lou, Wang, Fei and Zhang19]
As mentioned above, hydrothermal synthesis has been reported; however, the synthesis conditions can be optimized. For example, SnO2 NPs have been obtained with temperatures about 180°C with prolonged reaction times,[Reference Ji, Huang, Liu, Jiang, Li, Ding, Hu, Wu and Li20] in another report a hydrothermal process involving hydrazine hydrate instead of NaOH has been used to produce SnO2, but still using high temperatures and long periods of synthesis.[Reference Zhu, Yang, Yu, Zhang and Yao21]
In this work, we present a simple and green method for the synthesis of very small SnO2 NPs. The synthesis does not require high temperatures, organic solvents, or surfactants making it an environmental friendly method. We developed Zn, Fe, Co, Ti-doped SnO2 NPs, in a 6 h reaction with about 2 nm crystalline particle size.
Experimental
Synthesis method
Doped and un-doped SnO2 NPs were synthesized following a modified methodology describe by Ye and co-workers.[Reference Xi and Ye22] In a typical synthesis procedure, three solutions were prepared: Solution A, containing 2 mmol of SnCl4·5H2O (98%) in 10 mL of deionized water, solution B containing 40 mmol urea (ACS reagent) in 15 mL of deionized water, and solution C of the corresponding doping material 0.2 mmol in 10 mL of deionized water. The doping reagents used were Zn(CH3COO)2·5H2O (ACS reagent), Fe(NO3)3·9H2O (ACS reagent), TiO(acac)2 (90%), and Co(CH3COO)2·4H2O (ACS reagent). In the case of un-doped NPs, 10 mL of deionized water was filled instead of solution C, to remain the same quantity of liquid in the synthesis. The mentioned quantity of solutions A and C were mixed and stirred for 10 min, after that the solution B was added. The final mixture was transfer in a Teflon-lined autoclave and maintained it at 90°C for 6 h, and then it was cooled to room temperature; the precipitate of NPs was washed and centrifuged four times with deionized water and two times with absolute ethanol. The powder was dried at 50°C overnight to obtain dry NPs.
Characterization
The following instruments were used for the NP characterizations. Analytical transmission electron microscope (TEM) model JEM2200FS from the Jeol trade mark, with spherical aberration correction in a probe mode working at 200 KeV accelerating voltage, it was used to inspect the appearance and size of NPs. The elemental composition was determined by energy-dispersive spectroscopy (EDS) Oxford, which was used to quantify the elemental content and it was made in the scanning transmission electron microscopy (STEM) mode operation. The X-ray diffraction (XRD) studies were carried out by Panalytical Xpert'pro X-ray diffractometer with X'celerator detector, using the Bragg–Bretano geometry. Raman spectra were collected with a Horiba LabRAM spectrometer, working with red laser (623 nm), and Stokes emission wavelengths were detected. The fluorescence spectra were obtained with a Horiba Jobin Yvon NanoLog model spectrofluorometer. The surface area was determined using Autosorb Quantacrome iQ surface gas sorption analyzer.
Results and discussion
Morphology and elemental analysis
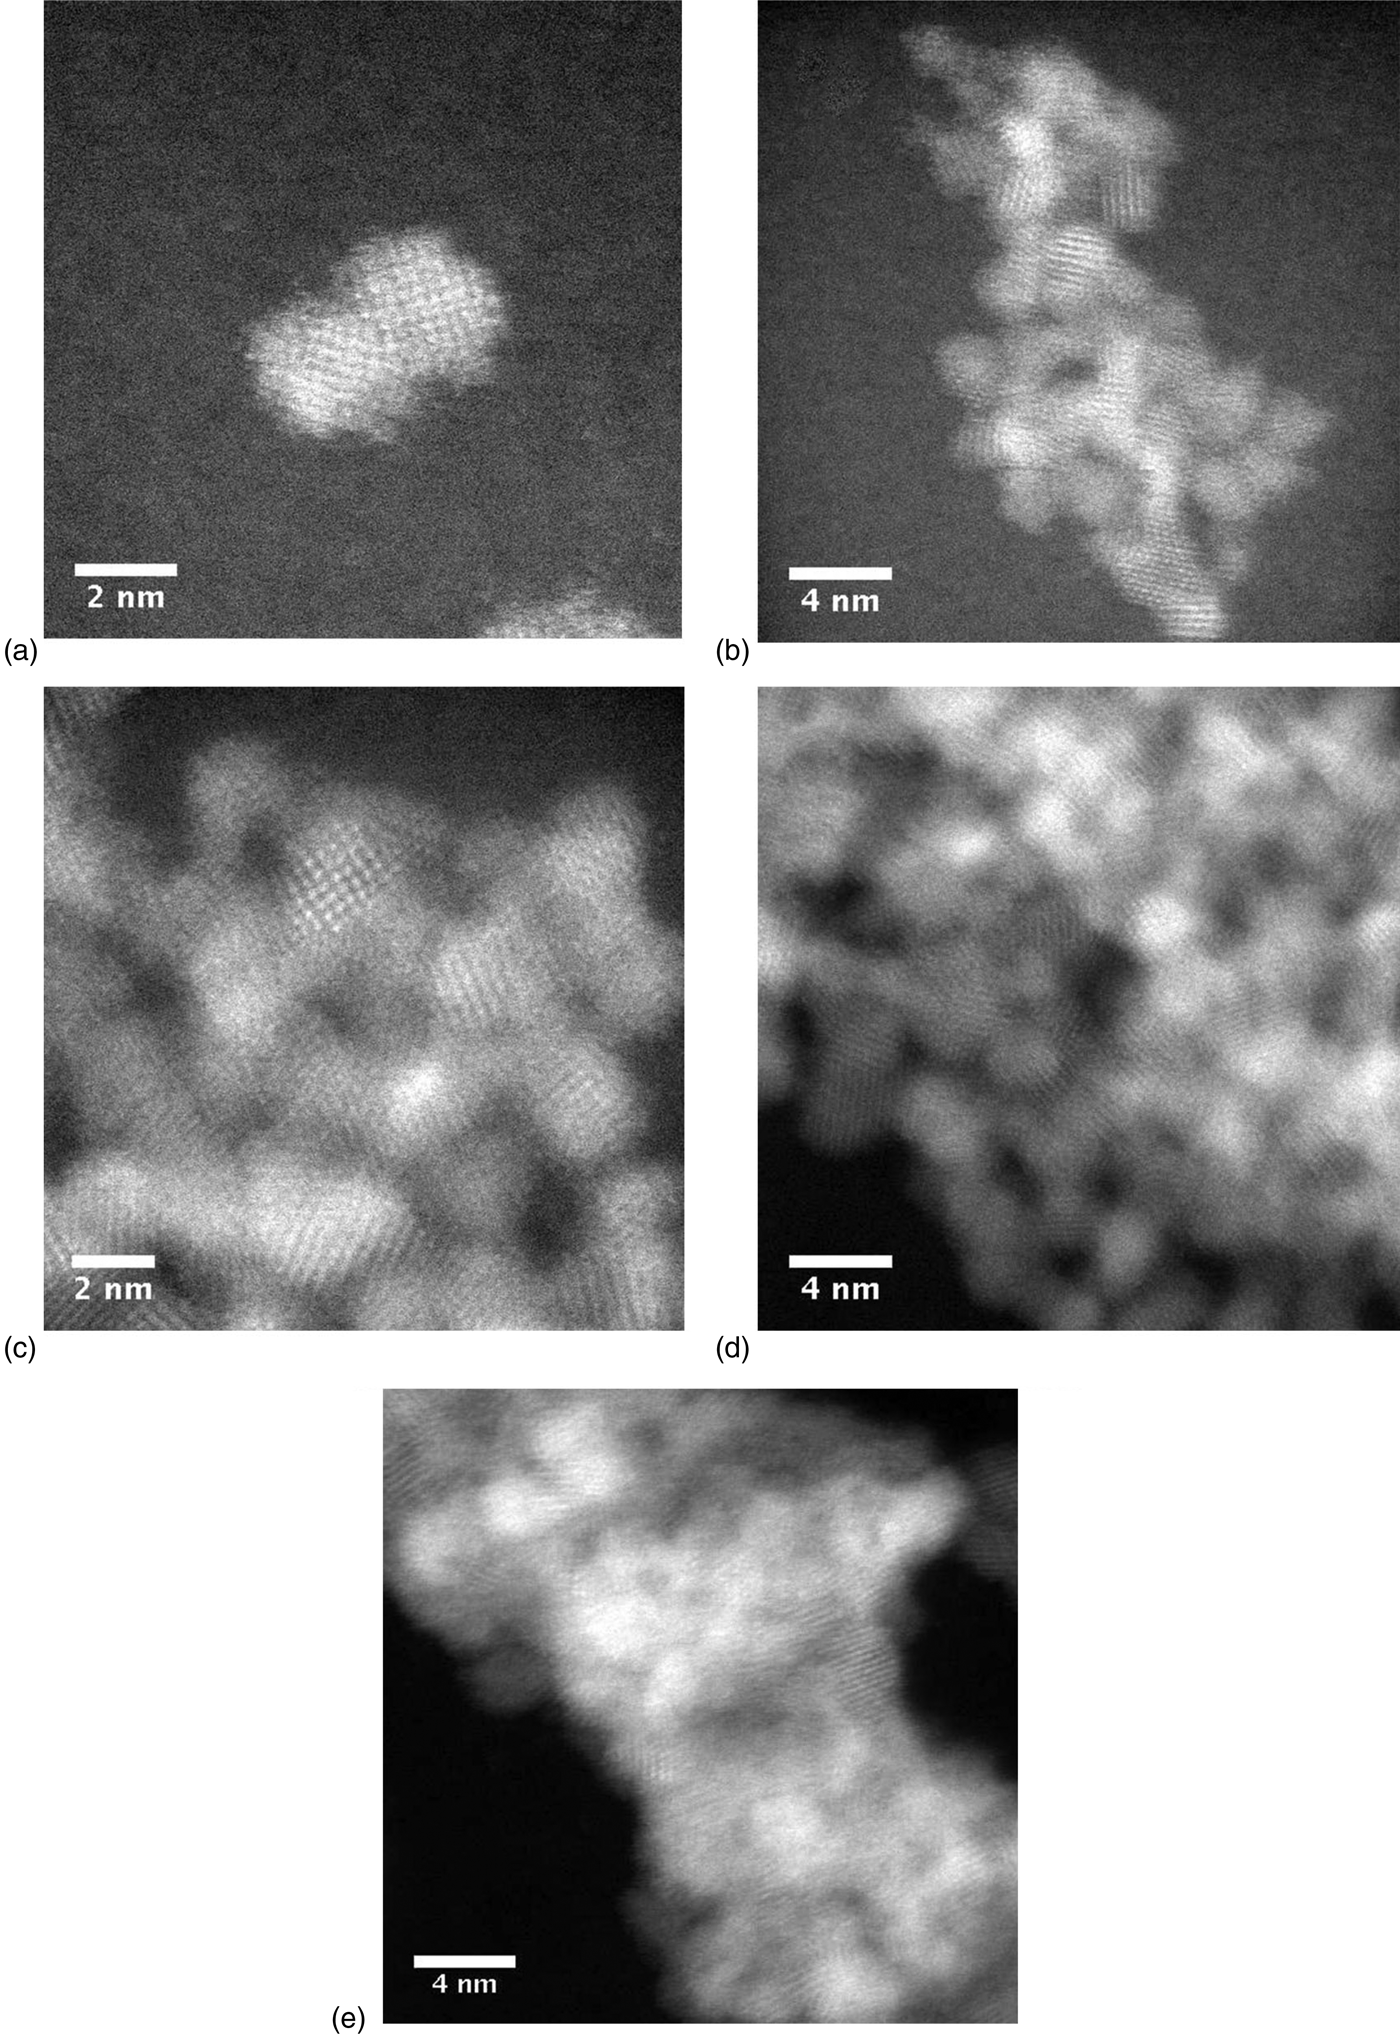
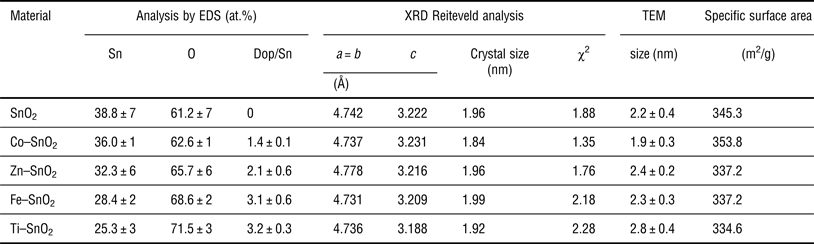
The NPs shape was studied by the electron microscope using high-angle annular dark field detector in the STEM mode. Figure 1 shows the resulting TEM images in which the NP sizes measured for each material. Statistical distribution histograms were also plotted (Fig. S1). The un-doped NPs have an average size of 2.2 ± 0.4 nm, the doped materials have an average size of 1.9 ± 0.3, 2.4 ± 0.2, 2.3 ± 0.3, and 2.8 ± 0.4 nm for Co, Zn, Fe, and Ti dopants, respectively (see Table I). The obtained materials have a spherical appearance. Different morphologies of NPs based in SnO2 can be obtained; however, this morphology may be changed as a function of parameters involved in each type of synthesis, such as reduction agent type and others. Birkel et al.[Reference Birkel, Loges, Mugnaioli, Branscheid, Frank, Panthöfer and Tremel23] studied this effect using urea as the reduction precursor agent. The use of strong reduction agents as sodium and ammonium hydroxide lead to the formation of small particles, which act as nucleation seeds and lead to the formation of larger particles with different morphologies. When urea is used as reduction agent, high temperature and pressure generate ammonia leading to an in situ reduction. In this case, nucleation seeds are not generated and smaller particles are obtained.
TEM images for un-doped SnO2 (a), Co–SnO2 (b), Zn–SnO2 (c), Fe–SnO2 (d), and Ti-SnO2 (e).

Data comparison of the doped and un-doped NPs by XRD and TEM.
Elemental analysis was carried out using the EDS technique. Figure 2 shows typical EDS patterns for un-doped and doped SnO2 materials, these spectra show the characteristic signals at 3.4, 25.2, and 28.5 keV for the tin transitions for Lα1, Kα1, and Kβ1, respectively, confirming the presence of tin in all samples. The specific dopant metal shows two signals for each one, that corroborate qualitatively and quantitatively the presence of them in the synthesized SnO2 NPs. The Co-doped QDs show signals at 0.77 Lα1 and 6.93 Kα1, Zn-doped QDs show signals at 1.01 Lα1 and 8.67 Kα1, Fe-doped QDs show signals at 0.70 Lα1 and 6.40 Kα1, and last Ti-doped QDs show signals at 0.45 Lα1 and 4.51 Kα1 keV. The elemental analysis for each sample was acquired at least from ten different zones and it values were average. The average quantified values for each sample have doping coverage between 1.4% and 3.2%. This technique confirm about the type and quantity of dopant. The atomic ratio dopant/Sn in these materials were 3.8 at.% for Co, 6.5 at.% for Zn, 10.9 at.% for Fe, and 12.6 at.% for Ti, respectively. This can be explained by the Lewis acid–base theory, and the mechanism formation of SnO2 NPs.
EDS patterns of un-doped SnO2 (a), Co–SnO2 (b), Zn–SnO2 (c), Fe–SnO2 (d), and Ti–SnO2 (e).
The first step in the synthesis of SnO2 NPs is the formation of the metal hydroxide followed by the precipitation of SnO2 by heat treatment. In our synthesis, both Sn and the dopant are mixed in the precursor solution. The hydroxide formation with both metals is crucial for the dopant content in the obtained NPs. Lewis theory explains the stability of hydroxide–metal complex by hard–soft acids and bases. Complex will be more stable when a hard acid is coordinated to a hard base and vice versa. Tin hydroxide is formed by hydroxide (hard base) and Sn4+ (hard acid); hard acids have high oxidation[Reference Huheey, Keiter and Keiter24] states like Sn4+, meaning that Sn(OH)4 is formed with great stability in the synthesis. The metals used as dopants have different hardness. Zn2+ and Co2+ are in the borderline of chemical hardness and softness, whereas Ti4+ and Fe3+ are hard acids. This explains why Ti4+ content is higher than the others followed by Fe3+, Zn2+, and Co2+.
XRD studies
The XRD pattern of the un-doped and metal-doped SnO2 NPs is shown in Fig. 3. The peak positions of all materials exhibit the rutile tetragonal structure, which was assigned well with a standard ICDD card No. 77-0452. Furthermore, no other peaks were observed involving the contamination of ammonium chloride crystals or other salts obtained as reaction sub-products, obtaining materials with a single phase and without any impurities. The doped material shows no additional peaks in their XRD patterns; this indicates that doping percentage (10 at.% in the precursor solution) with these elements in SnO2 is essentially in a substitution modality, because no new diffraction patters appear. The lattice parameters and crystal size (D) for each doped material was determine from the XRD pattern refinement by the Rietveld formalism methodology,[Reference Rietveld25] using FullProff free license software[26]; the refinement process start using atomic positions and lattice parameters, from ICDD card No. 77-0452. The example of data pattern refinement for the case of Zn-doped material is shown in Fig. 4. The fitted patterns for the experimental data (red) are shown as solid curves (black) and thick marks (green) indicate the expected position of diffraction peaks for a modeled rutile SnO2 structure; lower part curves (blue) show the difference between the experimental and calculated values, which are close to cero or a straight horizontal line. The statistical precision pattern fitting between experimental and theoretical determinations, was measured by χ2 statistical parameter, and this value gives good reference about the reliability of refinement parameters. In all analyzed samples, the χ2 values were below to 2.3, and are shown in Table I.
XRD patterns of the un-doped and metal-doped SnO2 NPs.
XRD pattern refinement for the Zn-doped material.
Table I shows a comparison of the particle size determined by XRD patterns and TEM micrographs. As noted in Table II the crystallite size of SnO2 NPs matches well with those estimated by TEM. The crystalline size of metal doped with Zn, Fe, and Ti remains at the same value (2.6 nm) and little less for Co-doped QDs. The particle size can be affected by the content and the ionic radius of the dopant. Fe3+ and Ti4+ ions have a smaller size than Sn4+ (71 p.m.), and they could prevent the growth of the crystal grain.[Reference Azam, Ahmed, Habib and Naqvi11] However in this study, the synthesis conditions provide higher dopant content for Fe and Ti as mentioned in the EDS analysis leading to the formation of bigger particles. The incorporation of Co2+ (72 p.m.) was in a lower content than the other metal ions, resulting in the formation of smaller crystalline sizes. The lattice parameters are also affected by the ionic radius of the dopant, in Table II the c parameter is decrease by the smaller ions (Fe3+ and Ti4+); this affects the growth of the crystal grain and will contract the cell volume. Doped materials show peaks with a little sharpened effect over the pure SnO2 QDs, indicating an enhancement of crystallinity and crystals with no defects. The specific surface area (S) was also calculated using the crystalline size (D) and SnO2 density (ρ) by the following equation[Reference Kiani, Samadi and Yaghoubyan12]:
 $$S=\displaystyle{6 \over {\rho D}}.$$
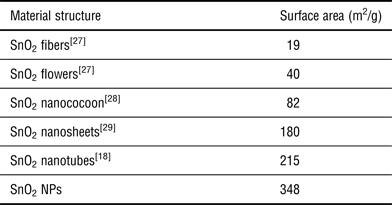
BET surface area comparison of different SnO2 nanostructures.
NPs obtained in this work have great specific surface area reaching between 334.6 and 353.8 m2/g. Experimental surface area was also determined by Brunauer–Emmett–Teller (BET) technique and the average surface area for the NPs was 348 m2/g. Table II shows a comparison of the surface area reported for these nanoarchitectures. As can be seen, these results show that the 0D NPs obtained have larger surface area than those reported, which make them useful as catalytic material and gas sensors. In addition, these NPs can improve analytical sensitivity and can be used in other applications.
Raman spectral study
Raman spectroscopy is another method to determine the material structure and it is sensible to the size and crystals surface area. Figure 5 shows the room temperature Raman spectra of as-synthesized samples, they show the presence of three strong peaks and six with low intensity located at 163, 589, 1015 and 88, 312, 474, 629, 1015, 1043 cm−1, respectively. The peaks at 474 and 629 cm−1 can be indexed to E g and A 1g vibrations modes respectively but the other peaks are not detected in the bulk rutile SnO2. The peak at 629 cm−1 (A 1g) is attributed to the Sn–O stretching mode vibrational. However, the peak about 575 cm−1 is assigned to surface defects of the SnO2 monocrystals.[Reference Xi and Ye22] This band is wider than the main Raman modes for SnO2 bulk, due to the larger surface area of this type of material. As a result, the surface-related band is prominent in all spectra; this analysis suggests that surface-related band defects are more prominent in nanocrystals than in nanorods or microcrystals. The other bands at 163 and 1015 cm−1 belong to the nanocrystal and they depend on the ionic radius and dopant concentration. However, the band at 163 cm−1 appears for pure and cobalt-doped SnO2 only, but not for others dopants because of the increment in ionic radius. The bands located below 200 cm−1 are related with oxygen vacancies presence in the SnO2. Data reported in Table I show that Co–SnO2 is the material with less dopant quantity and therefore the signals below 200 cm−1 are not modified. To the rest of the doped materials the band at 163 cm−1 is not appreciated. The band at 1015 cm−1 is clearly for dopant materials and change according to the type of dopant. These changes suggest the presence of dopants, similar to the data shown by EDS (Fig. 2). These new types of Raman vibrations, location and shape are related with the size area of crystal and type of dopants.
Raman spectra of the un-doped and metal-doped SnO2 NPs.
Fluorescence analysis
QDs have been described as semiconductor materials in nanoscale dimensions with unique electronic and optical properties. The fluorescent emission spectra of pure and doped SnO2 obtained in this work have been analyzed and reported in Fig. 6. The photoluminesce emission spectra exhibit a strong emission band for pure SnO2 QDs at 376 nm which confirms the quantum confinement of the small particles obtained. Photoluminesce emission spectra were also recorded for doped SnO2, this sample showed a 26 nm red shift in the emission band for Zn, Fe, and Ti. Furthermore, Co-doped NPs did not show any red shift in the emission spectra recorded. As noted in the above studies, Zn, Fe, and Ti are dopant, which have caused changes in the crystallinity of the particles, unlike Co. It is expected that in the emission spectra a similar behavior occurred. Semiconductors doped with metals induced red shifts in the emission wavelength, this effect has already been studied in Mn–ZnS-doped QDs, where Mn caused a red shift.[Reference Liu, Chen, Lin and Lin10] These nanomaterials have great surface area and luminescent properties, suitable for sensor applications and catalytic studies.
Fluorescence emission spectra of the un-doped and metal-doped SnO2 NPs.
Conclusions
SnO2 NPs with a size smaller than 3 nm can be obtained at low temperatures by ecofriendly chemistry. We have obtained 0-D NPs pure and doped with metals using only urea and water as reacting agents. The samples were analyzed by TEM, EDS, XRD, Raman, and fluorescence spectroscopy. The characterizations show that the samples have a rutile structure and a particles size between 1.9 and 2.8 nm. These NPs have potential applications as QDs for solar cells, sensing probes, and catalysis.
Supplementary materials
For supplementary material for this article, please visit http://dx.doi.org/10.1557/mrc.2015.11
Acknowledgments
The authors gratefully acknowledge support from Consejo Nacional de Ciencia y Tecnología, México (CONACyT) (Project no. 167139) A. Tirado-Guízar thanks to CONACyT for a Doctoral fellowship (230802). Thanks to C. Ornelas, P. Piza and E Torres for their technical help at Nanotechnology laboratory located at CIMAV-Chihuahua, Mexico and also thanks to Dr. EA. Reynoso-Soto for the TGA analysis.