I. INTRODUCTION
To understand the mechanical properties of materials, it is essential to observe their associated deformation and defects in as much detail as possible. For example, observation of the indentation plastic zone is critical to determine the relationship between hardness and macroscopic material properties such as yield strength.Reference Kramer, Huang, Kriese, Robach, Nelson, Wright, Bahr and Gerberich1,Reference Lebourhis and Patriarche2 Nanoindentation is now widely used to characterize the hardness, elasticity, and fracture behavior of materials such as nanostructures and thin films (<1 μm) that would be difficult or impossible with conventional mechanical testing.Reference Lucca, Herrmann and Klopfstein3 Observation of nanoindent deformation is critical to understanding mechanical behavior of thin films and materials at small scales (<1 μm). Such observations are important due to increasing interests in developing novel nano-/microelectromechanical systems (NEMS/MEMS), optoelectronics, and nanotechnologies.
Transmission electron microscopy (TEM) provides invaluable capabilities to observe and obtain information about the nanoscale mechanical behavior of materials. TEM is of particular significance in elucidating the atomic-level mechanisms of deformation and fracture.Reference Lloyd, Castellero, Giuliani, Long, McLaughlin, Molina-Aldareguia, Stelmashenko, Vandeperre and Clegg4,Reference Jang, Li, Gao and Greer5 With the use of focused ion beam (FIB) milling, TEM cross sections through nanoindents can be made for characterization of subsurface deformation mechanisms.Reference Langford and Petford-Long6 However, it is a very challenging and tedious task to prepare an electron-transparent TEM lamella (cross section), generally with a thickness <100 nm, at a specific site. The state of the art of preparing a site-specific cross-sectional TEM (XTEM) specimen involves using the FIB in situ lift-out (INLO) technique.Reference Lomness, Giannuzzi and Hampton7,Reference Mayer, Giannuzzi, Kamino and Michael8 In this technique, the region of interest is located via scanning electron microscopy (SEM). Next, a protective strip of Pt or C is deposited over the site to minimize ion damage during the milling process. Subsequently, the region is ion milled into a wedge-shaped or parallel-sided cross section around the protective strip. This cross section is then extracted and transferred to a TEM sample grid in situ, using a micromanipulator. Final thinning to electron transparency is performed via ion milling.
When preparing INLO specimens from nanoscale site-specific features such as nanoindents, the primary challenge lies in centering a feature within the cross section. Even with the aid of fiducial marks, centering a feature within the final cross section is nontrivial, as the error in alignment can be as high as 200 nm.Reference Lloyd, Castellero, Giuliani, Long, McLaughlin, Molina-Aldareguia, Stelmashenko, Vandeperre and Clegg4 This is because once the feature is covered by the protective metal strip, the exact location of the feature is uncertain; the final thinned sample may no longer contain the feature of interest because it has been milled away. To circumvent this, the TEM cross section may be left relatively thick (>100 nm), but this results in poorer TEM image contrast. Furthermore, even with the successful extraction of a sufficiently thin specimen, important structural information (e.g., crystal anisotropy, interfaces, etc.) in three dimensions is still missing. This is because the cross section represents a single, isolated, two-dimensional projection of a fraction of the three-dimensional (3D) nanofeature. This limited information results in gaps in the understanding of experimental nanoscale mechanics, impeding the ability to accurately model and predict small-scale mechanical behavior.Reference Lloyd, Castellero, Giuliani, Long, McLaughlin, Molina-Aldareguia, Stelmashenko, Vandeperre and Clegg4,Reference Van Tendeloo, Bals, Van Aert, Verbeeck and Van Dyck9
In this work, an alternative approach to traditional cross-section preparation via FIB is demonstrated, which allows for 3D visualization of small volumes via TEM. The concept of the approach is illustrated in Fig. 1 for visualization of the subsurface deformation beneath nanoindents.
Schematic concept of reconstructing a nanoindent in GaAs (001) from multiple snapshots in the cross section of a rotated array: (a) model of a characteristic anisotropic dislocation network beneath an indent with dislocation rosettes extending along the <111> directions; (b) an array of nominally identical features aligned with the in-plane <110> crystallographic directions, rotated with respect to the FIB cross section; (c) front view of the entire FIB cross section; and (d) XTEM images of individual dislocation networks from a cross section rearranged and stacked to give a 3D appearance, resembling the original nanoindent.

The approach involves generating an m × n pattern of nominally identical indents (i.e., same loading conditions), where m and n are integers, that is offset from the direction of the FIB cross section by an optimal angle, θ. This rotation of the pattern with respect to the FIB cross section results in a different segment of each indent to be included in the specimen. These cross sections of individual indent segments, when compiled, collectively represent the total volume surrounding a single indent feature, allowing for all segments of one representative feature to be contained in a single FIB cross section, as shown in Fig. 1. XTEM images of each section of the indent are then captured and “reconstructed” using a software routine to create a 3D image of the nanoindent. Although the approach increases the TEM sample preparation yield of any array of nanofeatures that can be patterned, the 3D reconstruction is most suitable for single-crystalline materials and materials with acceptable variation in subsurface deformation under identical loading conditions. The approach is demonstrated herein using single crystalline GaAs(100), which has been well studied in the literature.
It should be noted that 3D characterization of micro- and nanoscale features has previously been realized via serial sectioning and imaging in a dual-beam FIB/SEM,Reference Holzer, Indutnyi, Gasser, Münch and Wegmann10 x-ray diffraction,Reference Grandfield, Palmquist and Engqvist11 secondary ion mass spectroscopy,Reference Tomiyasu, Fukuju, Komatsubara, Owari and Nihei12 and microtomography.Reference Lučić, Förster and Baumeister13 However, the ability to perform quantitative microstructural analysis by tilting to different crystallographic reflecting planes, and the ability to resolve atomic-scale features (such as dislocations) makes TEM uniquely suited for studies of nanomechanics. The existing method of TEM tomography exploits tilting of TEM specimens to reconstruct nanostructures in three dimensions.Reference Koster, Ziese, Verkleij, Janssen and de Jong14,Reference Bals, Van Tendeloo and Kisielowski15 Although this technique is well developed, its utility lies in observing individual structures, not networks of structures, such as the plastic zone shape beneath a nanoindent in an anisotropic material. The approach demonstrated herein addresses this need by assisting in the full characterization of highly localized deformation in small volumes. In addition, the approach allows for investigation and coupling of 3D atomistic modeling of plastic deformation with experimental nanomechanical results in 3D.
II. EXPERIMENTAL
A. Array generation
The experimental demonstration of the technique was carried out for characterization of the plastic zones of nanoindents in single-crystal GaAs (001). Indent patterns similar to that in Fig. 1 were created using a nanoindenter (Asylum Research MFP NanoIndenter™, Santa Barbara, CA) with a diamond cube-corner tip (nominal tip radius <40 nm) at applied loads between 50 and 1000 µN in load-control operation. The array was rotated with respect to the [110] direction, which is the preferred beam axis for TEM analysis in GaAs (001).
The offset angle of the pattern was determined in terms of the pattern dimensions, as a function of the number of indent rows to be crossed by a single cross-section cut. The offset angle, θ, is given by
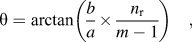 $${\rm{\theta }} = \arctan \left( {{b \over a} \times {{{n_{\rm{r}}}} \over m-1}} \right)\quad,$$
where a and b are the lateral and vertical feature spacing, respectively, n r is the number of rows to be crossed by the FIB slice (n r = 1 corresponds to reconstructing a feature exactly once), and m is the number of features along the length of the array. Details of the derivation can be found in Sec. III.
In this experiment, maximum loads of 50, 250, and 1000 µN were used for arrays with respective rotation angles of 3°, 5°, and 9°, and indents spaced at 250, 500, and 1000 nm apart, respectively. Fiducial marks (∼2 µm wide indents) were used for alignment purposes and to aid in locating the arrays.
B. XTEM sample preparation and imaging
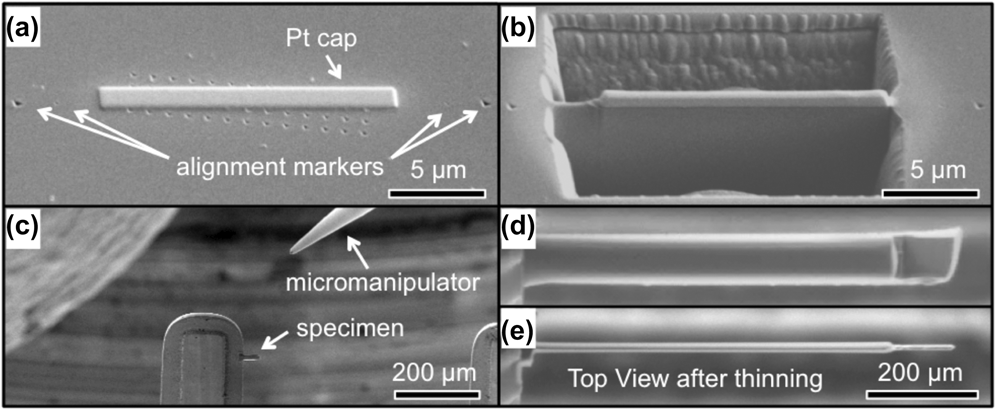
TEM sample preparation was performed using the INLO techniqueReference Lomness, Giannuzzi and Hampton7 in a dual-beam FIB/SEM (FEI Strata DB235). Prior to FIB preparation, the entire surface was sputter coated with ∼80 nm carbon to protect the surface of the features from ion-beam damage during the initial stages of cross-section preparation. A typical lift-out procedure was as follows (see Fig. 2): (i) deposit a Pt cap across the indents, in a 20–30 × 1.5-µm rectangle, in line with the marker indents, using beam currents of 100 pA beam, followed by 300 pA, up to a height of ∼1.5 µm; (ii) create sloped trenches around the Pt cap, in 20–30 × 6-µm boxes, and up to depths of ∼8 µm, at a beam current of 3000 pA, leaving a ∼2.5-µm thick wall (cross section) between trenches; (iii) thin the cross section to 1.5-µm thickness at 1000 pA current; (iv) tilt the stage such that the sample is at a 45° angle with respect to the ion beam, cut under and around the cross section at a beam current of 300 pA, leaving the cross section attached by a bridge of ∼2-µm wide; (v) weld the Omniprobe micromanipulator to the cross section using Pt and a 100 pA current; (vi) release the cross section by milling away the bridge at 100 pA; (vii) transfer the cross section and weld to an Omniprobe TEM grid; (viii) perform final thinning at ±1° tilt angles, with a 100 pA current, until the cross section thickness is <100 nm or the Pt cap is eroded.
Procedures for in situ FIB lift-out of a rotated array of features: (a) a Pt cap is deposited over the array, parallel to the alignment markers; (b) trenches are milled on either side of the cross section to be removed; (c) the specimen is lifted out using a micromanipulator and welded to a TEM pillar using Pt [Pt needle shown in top-left of (c)]; (d) and (e) the specimen is thinned to electron transparency, ∼200 nm or less.
Atomic force microscopy (AFM) images of indents were obtained with an MFP-3D™ atomic force microscope (Asylum Research) in alternating current (AC) mode with a SSS-NCH SuperSharpSilicon™ (Nanosensors) AFM probe (∼2-nm tip radius). XTEM images of the nanoindentation arrays were obtained using a JEOL 200CX transmission electron microscope (Peabody, MA) operated at 200 kV. All imaging was performed along the [110] zone axis using two-beam bright-field imaging with g = [002] or [2 $\overline 2$0].
C. 3D visualization
Initial image processing was performed using ImageJ analysis software.Reference Schneider, Rasband and Eliceiri16 XTEM images were rotated, cropped, and brightness/contrast were adjusted digitally. Consecutive images were then stacked, and Gaussian blurs were used to eliminate isolated bright or dark pixels. Background subtraction was used to further remove artifacts such as bending contours, and finally the images were inverted. The results were loaded into Amira® (Visualization Sciences Group, FEI Company, Burlington, MA) for creating 3D reconstructions using the Volren feature. Subsequently, thresholding and image multiplication were used such that the grayscale was preserved in the dislocated regions, whereas other regions were made black or other color combination. Images were then scaled in the thickness direction according to the vertical indent spacing, d·sin(θ). Next, a stack of images was projected in 3D, which treats black pixels as transparent, and images were blurred (1–2 pixels) to smooth transitions between image layers. Finally, different coloring schemes were applied to enhance contrast.
III. RESULTS AND DISCUSSION
A. Derivation of array rotation angle
To simultaneously (i) increase the throughput of site-specific FIB lift-outs of nanofeatures, (ii) provide “snapshots” of multiple sections of similar features in a single TEM cross section, and (iii) enable representative 3D reconstructions of one of the same features, an array of regularly spaced features, rotated slightly with respect to the FIB cross section, was chosen. This way, the resulting TEM cross section will contain consecutive sections of similar features, with each section offset from a feature's center by a predetermined amount. It is convenient to consider rotating the array, rather than the slice itself, because the slice should be made normal to the proper crystallographic orientation for XTEM. For example, with GaAs (001), the array is rotated with respect to the <110> directions, and the FIB cross section is made parallel to the [110] direction.
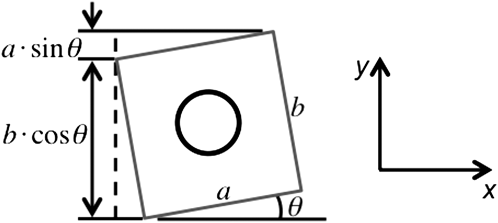
To determine the proper angle of rotation and array dimensions, an equation is derived as a function of feature spacing and the number of rows crossed by the FIB cross section. The geometric relations of a rotated array of circular features in a rectangular lattice are shown schematically in Fig. 3.
Schematic of a FIB slice (cross section) through an array of m × n regularly spaced features, rotated by angle θ, in (a). Individual sections from the slice in (a) are magnified and assembled in (b). The array consists of circular features centered in rectangular “unit cells.” In this schematic, the thickness of each segment, t, is slightly less than the critical thickness that would correspond to perfect overlap of the compiled segments.
In Fig. 3, the feature center-to-center array length and width are given by l and w, respectively, with feature spacing a and b along these respective directions. The number of features along the array length, m, is related to the length (l) and feature spacing (a) by
 $$l = a \times \left( {m - 1} \right)\quad .$$
For example, an array with m = 11 indents separated by a = 1 µm would have a length of l = 10 µm.
The unit cell height is equal to spacing along the width, b. The total distance covered by the FIB cross section, along the array width, is given by l × tan(θ). Thus the number of unit-cell heights (or number of rows), n r, covered by the slice, is
 $${n_{\rm{r}}} = {{{\rm{total}}\,\,{\rm{height}}\,\,{\rm{covered}}\,\,{\rm{by}}\,\,{\rm{slice}}} \over {{\rm{height}}\,\,{\rm{of}}\,\,{\rm{unit}}\,\,{\rm{cell}}}} = {{l \times \tan \left( {\rm{\theta }} \right)} \over b}\quad .$$
Substituting Eq. (2) gives
 $${n_{\rm{r}}} = {{a\left( {m - 1} \right) \times \tan \left( {\rm{\theta }} \right)} \over b} = {a \over b}\left( {m - 1} \right) \times \tan \left( {\rm{\theta }} \right)\quad .$$
Rearranging, an expression for the rotation angle is:
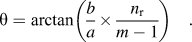 $${\rm{\theta }} = \arctan \left( {{b \over a} \times {{{n_{\rm{r}}}} \over {m - 1}}} \right)\quad .$$
Eq. (5) is identical to Eq. (1) in the main article.
If the feature spacing is the same along the length and width (i.e., a = b), then Eq. (5) reduces to
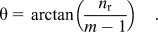 $${\rm{\theta }} = \arctan \left( {{{{n_{\rm{r}}}} \over {m - 1}}} \right)\quad .$$
For consecutive segments of the recompiled slices to overlap perfectly, (i.e., the y-translation from one unit cell to the next equals the slice thickness), the critical slice thickness is simply (Fig. 4)
 $${t_{\rm{c}}} = a \times \sin \left( {\rm{\theta }} \right)\quad .$$
The dimensions of a single rotated unit cell from Fig. 3, measured along the x- and y-directions. The incremental offset from one unit cell to the next, along the y-direction, a × sin(θ), is equal to the critical slice thickness corresponding to perfect overlap in the recompiled image.
This can be used to optimize the thickness of a cross section when preparing the TEM specimen.
B. XTEM and 3D reconstruction
Figures 5(a) and 5(b) show bright-field XTEM images of subsurface deformation of nanoindents at applied loads of 50 and 250 µN. The surface residual indent impressions (not shown) for 50- and 250-µN indents are approximately 9 and 40 nm in depth, respectively, corresponding to indent widths of ∼80 and ∼150 nm, as measured by AFM profiles along the maximum depth. In Figs. 5(a) and 5(b), a hemispherical plastic zone populated by a high density of dislocations can be seen under both indents. For the 250-µN indent, rosette arms about equal in length and extending ∼240 nm into the sample protrude out from the hemispherical plastic zone. Within each rosette, individual dislocation loops can be observed slipping along the {111} planes in the [110] direction. In the 50-µN indent, the plastic zone extends ∼200 nm into the sample with an indication of initial rosette-arm formation. By analyzing similar indents as a function of load, the evolution of the deformation mechanisms have been studied as presented elsewhere.Reference Lloyd, Castellero, Giuliani, Long, McLaughlin, Molina-Aldareguia, Stelmashenko, Vandeperre and Clegg4 XTEM images of indents as shown in Fig. 5 have been studied extensively in the literature for many material systems.Reference Ge, Minor, Stach and Morris17–Reference Oliver, Bradby, Williams, Swain and Munroe19
XTEM micrographs of nanoindentations in GaAs (001), at loads of (a) 250 µN and (b) 50 µN. In (c), XTEM micrographs of 50-µN nanoindents in GaAs (001) have been stitched together from two images, and a schematic diagram depicts representative slices through the nanoindent.
Figure 5(c) shows a series of XTEM images of 50-µN cube-corner indents in GaAs(001) obtained from a single FIB cross section. The varied plastic-zone segments through the volume of the indent were observed, as shown by a, b, c, and d in Fig. 5(c). Although four images are presented here for brevity, a total of 37 XTEM images were collected from the same FIB cross section. These images provide important information about the entire representative field of deformation beneath similar indents. For example, correlating the applied load to the developed plastic zone allows for prediction of fracture behavior in brittle solids.Reference Lawn20 Typically, the plastic-zone radius and rosette-arm length have been determined as a function of applied load from a single XTEM image,Reference Lebourhis and Patriarche2 but it is apparent from Fig. 5(c) that the plastic zone size is dependent upon the exact location of the cross section through the indent.
Finally, the individual XTEM images that are parsed, aligned, stacked, and projected in 3D, as depicted in Fig. 1(d), tomographically reconstruct the original feature. A 3D reconstruction from XTEM images of a 250-µN indent is shown in Fig. 6. The overall shape and size of the plastic zone is clearly distinguishable, which is not always obvious from a single XTEM image. We note that the quality of the approach is based upon creating representative indents or features. Most nanoindenters have sub-nanometer displacement resolution with closed looped control schemes that provide for repeatable indentation. The dimensional analysis and repeatability were investigated. Nanoindentation load–displacement curves and AFM images of individual nanoindentations are shown in Fig. 7 and demonstrated repeatability at low and high depths of indentation. The standard deviation in indentation depth was ∼9%.
3D reconstructions of a representative nanoindentation plastic zone for a 250-µN indent in GaAs (001), showing (a) an AFM image of an indent superimposed over the reconstructed plastic zone, (b) 3 (of 13) XTEM images displayed in the indent volume, and perspective images viewed in the (c) [110] and (d)  $[\bar 110]$ directions.
Characterization of nanoindents' dimensions: (a) and (d) load–displacement curves, (b) and (e) AFM topography images using a supersharp AFM probe, and (c) and (f) individual line scans corresponding to the AFM images, for 50-µN and 250-µN indents, respectively. The curves in (a) and (d) correspond to the first three indents at these loads, to demonstrate the load–depth repeatability.
IV. CONCLUSION
The method presented relies on the ability to create repeatable structures in a well-defined pattern. Although it does not allow for 3D reconstructions of individual dislocations (or other defects)—since the dislocations are themselves not identical in all indentations—it has been demonstrated that this method does allow for the shape and size of a representative indentation plastic zone to be visualized in three dimensions. Furthermore, the ability to examine consecutive sections at different positions through similar indent features in a single XTEM specimen provides an immediate and improved understanding of the overall structure of a feature, without necessarily having to create a 3D reconstruction. This analysis can be performed at varying loads and orientations of the indenter and crystal surface, thus providing an efficient means to capture a more complete picture of localized deformation. Future improvements of the method can be made by averaging together XTEM images corresponding to the same plastic-zone segment (e.g., from multiple specimens or from one specimen if the cross section crosses two rows of features).
ACKNOWLEDGMENTS
The authors thank Thomas Angelini and Kurt Eyink for their helpful discussions and support with the 3D analysis and visualization software. This work was supported by the National Science Foundation (NSF) (Grant No. CMMI-1000380). Any opinions, findings, and conclusions or recommendations expressed in this material are those of the authors and do not necessarily reflect the views of NSF.