Introduction
Crucifer flea beetle, Phyllotreta cruciferae (Goeze) and striped flea beetle, Phyllotreta striolata (Fabricius) (Coleoptera: Chrysomelidae) are the most chronic and economically important flea beetle pests of cruciferous (Brassicaceae) crops in western Canada such as Argentine canola (Brassica napus Linnaeus), Polish canola (Brassica rapa Linnaeus), brown and oriental mustard (Brassica juncea (Linnaeus) Cosson), and yellow mustard (Sinapis alba Linnaeus) (Soroka and Elliott Reference Soroka and Elliott2011). Primarily north temperate in distribution, both are invasive alien species to North America, P. cruciferae from Europe and P. striolata from Eurasia (Milliron Reference Milliron1953). Although the distributions of the two species overlap, P. striolata is the dominant species in the parkland (black soil zone) and P. cruciferae tends to be more abundant in the warmer/dryer dark brown and brown soil zones (Burgess Reference Burgess1984).
In western Canada, crucifer-feeding flea beetles are a challenge to manage in part because their pest status is difficult to forecast. As a result, yield losses in canola crops exceed US $300 million annually in North America (Knodel and Olson Reference Knodel and Olson2002). Integrated crop management tactics include reduced tillage, the use of large-sized seed with high seedling vigour qualities, and insecticide-coated seed treatments (Dosdall and Stevenson Reference Dosdall and Stevenson2005). Of the three tactics, the use of neonicotinoid insecticide seed treatments is the primary management tool used by canola producers (Soroka and Elliott Reference Soroka and Elliott2011). Recent research suggests that neonicotinoids may not be as effective in controlling P. striolata as they are against P. cruciferae (Tansey et al. Reference Tansey, Dosdall, Keddie and Sarfraz2008). In turn, there have been reports that populations of P. striolata are increasing in numbers and expanding their geographic range (Kielen Reference Kielen2012; Soroka Reference Soroka2012).
The pest status and life cycle of the two Phyllotreta Chevrolat species have been previously described (Soroka and Elliott Reference Soroka and Elliott2011; Soroka Reference Soroka2013). In western Canada, both species have one generation per year and overwinter as adults, usually along shelterbelts and headlands (Wylie Reference Wylie1979). Adults begin to emerge from overwintering sites during extended periods of warm weather in April and May. Phyllotreta striolata adults emerge one to four weeks earlier than P. cruciferae (Westdal and Romanow Reference Westdal and Romanow1972). Newly emerged adults feed on winter annual weeds or volunteer canola until spring-seeded canola crops become available as a source of food. Females oviposit in the soil near host plants from late May until early July (Burgess Reference Burgess1977). The white, grub-like larvae feed on root hairs and surface of the tap root before pupating in earthen cells near their host plant. The new generation of adults appear from late July to October, feeding briefly before migrating to overwintering sites.
Bioclimatic simulation models, such as CLIMEX, are tools that have been used to predict the potential geographic distribution and potential success of insect establishment in new ecosystems, based on climate (Sutherst et al. Reference Sutherst, Maywald and Kriticos2007). CLIMEX derives an ecoclimatic index (EI), which defines the climatic suitability of specific locations for species survival and reproduction and provides an estimate of relative abundance. Model parameters include temperature, diapause, light, moisture, heat stress, cold stress, wet stress, and dry stress. The annual growth index (GI) represents the potential for population growth as a function of soil moisture and temperature during favourable conditions; and is combined with stress indices (cold, wet, hot, dry) to determine the effect of abiotic stress on survival in unfavourable conditions. The weekly GI is a function of temperature, diapause, and moisture. The growth and stress indices are calculated weekly and then combined into an overall annual index of climatic suitability (EI) that ranges from 0 for locations where the species are not able to persist to 100 for locations that are optimal for the species. Within that range, the indices are often grouped into categories (e.g., unfavourable, suitable, favourable, very favourable) that reflect the climatic suitability of the specific insect under study.
The objective of this study was to develop bioclimate models for both P. striolata and P. cruciferae in order to better understand how the two species respond to selected climate variables and how climatic factors may contribute to shifts in geographic distribution and relative abundance.
Methods
Bioclimate models for P. cruciferae and P. striolata were developed using CLIMEX 3.0 (Sutherst et al. Reference Sutherst, Maywald and Kriticos2007). The bioclimate modelling process, which integrates the weekly responses of a population to climate using a series of annual climate-related indices, has been previously described (Olfert and Weiss Reference Olfert and Weiss2006; Haye et al. Reference Haye, Olfert, Weiss, Gariepy, Broadbent and Kuhlmann2013; Olfert et al. Reference Olfert, Weiss and Elliott2015).
The models were developed in iterations, whereby model parameters were individually adjusted in order to develop models that are closely aligned with the reported geographic distribution and relative abundance of P. cruciferae and P. striolata across North America. The resulting models were then validated by comparing modelled distribution with reported observations (P. cruciferae=582 records; P. striolata=738 records) for Europe and Asia (Gupta Reference Gupta1945; Burgess Reference Burgess1982; Campbell et al. Reference Campbell, Sarazin and Lyons1989; Bousquet Reference Bousquet1991; Andersen et al. Reference Andersen, Hazzard, Van Driesche and Mangan2006; Barney et al. Reference Barney, Clark and Riley2009; Arctos 2015; Centre for Agriculture and Biosciences International 2015a, 2015b; Fauna Europaea Web Service 2015; Global Biodiversity Information Facility 2015).
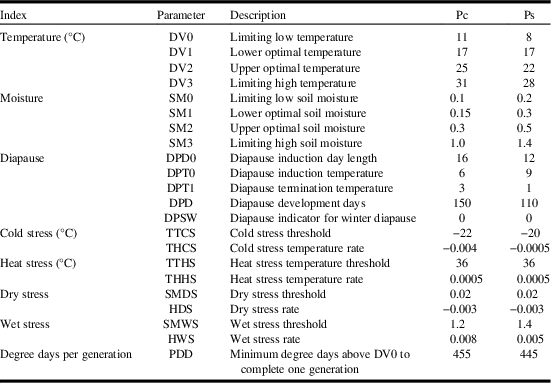
Model parameters for P. cruciferae and P. striolata are listed in Table 1. The lower limiting development threshold (DV0) for P. cruciferae was set at 11.0 °C. Flights of overwintered P. cruciferae adults were reported at temperatures exceeding 14.0 °C (Lamb Reference Lamb1983), and the reported developmental temperature between 11.2 °C (eggs) and 11.8 °C (larvae and pupae) and the temperature threshold for oviposition was 16.7 °C (Kinoshita et al. Reference Kinoshita, Svec, Harris and McEwan1979). Their laboratory results indicated that 456 (428–491) degree days were required to complete development from eggs to adults. Hatch rates were greater at 25 °C than at 15 °C, 20 °C, or 30 °C with no hatch occurring at 5 °C or 10 °C (Kinoshita et al. Reference Kinoshita, Svec, Harris and McEwan1979). Burgess (Reference Burgess1984) reported that P. cruciferae populations in Saskatchewan, Canada were greater in the southern Ecoregions than the northern Aspen Parkland and Boreal Ecoregions. Based on these observations, the lower, DV1, and higher, DV2, optimal developmental temperatures were parameterised to permit higher values across the southern ecoregions than the northern Aspen Parkland or Boreal Ecoregions (Kirkwood et al. Reference Kirkwood, Bootsma, de Jong, Dumanski, Hiley and Huffman1993). Model parameters DV0, DV1, DV2, and DV3 (high limiting developmental temperature) were set to 11 °C, 17 °C, 25 °C, and 31 °C, respectively. Likewise, soil moisture (SM0, SM1, SM2, SM3) and diapause (DPD0, DPT0, DPT1, DPD) variables were parameterised to reflect the observation that P. cruciferae occurs in central and southern ecoregions where soil moisture conditions are relatively drier than the more northern Aspen Parkland Ecoregion. Cold stress threshold and temperature rate variables were parameterised to limit distributions and EI values across the northern regions of the Boreal Plains Ecozone (Kirkwood et al. Reference Kirkwood, Bootsma, de Jong, Dumanski, Hiley and Huffman1993).
Values for parameter settings for the CLIMEX model projecting Phyllotreta cruciferae (Pc) and Phyllotreta striolata (Ps) distribution and abundance in North America.

The lower temperature threshold for P. striolata was based on a developmental threshold between 8 °C and 11 °C (Sommer Reference Sommer1981). The lower temperature was chosen for DV0 to permit activity in early April (Burgess Reference Burgess1977). The lower limiting development threshold of 8 °C resulted in expected distributions in northern Alberta, Northwest Territories, and Yukon Territory in Canada. Lower (DV1) and upper (DV2) optimal temperatures were parameterised to reflect relatively higher abundances in the Aspen Parkland Ecoregion of the Canadian prairies and lower values across southern ecoregions (Burgess Reference Burgess1984). The upper temperature threshold (DV3) was parameterised to limit distributions and relative abundances in the southern United States of America. The values for DV3 were assigned, based on observations made in China (Chen et al. Reference Chen, Shy, Ko, Hwang and Lin1991). Soil moisture variables were parameterised to reflect higher moisture levels that occur in the dark brown and black soil zones that occur across the Aspen Parkland Ecoregion. Diapause variables (DPD0, DPT0, DPT1, and DPD) were parameterised to permit P. striolata activity in late April or early May (Burgess Reference Burgess1982). This resulted in an unusually low DPT1 (diapause termination temperature based on weekly average minimum temperature) value of 1 °C. A number of iterations were conducted and a value of 1 °C was the highest value that permitted early spring activity. At Saskatoon, Saskatchewan, the average daily minimum temperature in early May is 1 °C while average daily maximum temperature is 13 °C (AccuWeather 2016). Cold stress variables were parameterised to limit EI values and still permit occurrence of P. striolata in Northwest Territories, Yukon Territory, and Alaska, United States of America.
The “compare locations” module allows output of annual indices values, including one EI for each grid cell. Ecoclimatic index values were then used to develop a surface map of potential distribution and relative abundance of these species in North America, Europe, and Asia. Surface maps were presented using EI values in six categories: grey=very unfavourable (1–5); light green=unfavourable (5–10); dark green=marginal (10–15); yellow=suitable (15–20); orange=favourable (20–25); and red=very favourable (>25).
A geographic rectangle, 2° latitude by 2° longitude was used to delineate a geographic region around each location, and model output was averaged across the region (n=144 grid cells). These data sets permitted spatial and temporal comparison of variables. In this study, five locations in a diagonal across the Prairies and Boreal Plains Ecozones (Kirkwood et al. Reference Kirkwood, Bootsma, de Jong, Dumanski, Hiley and Huffman1993), from southeast to northwest were selected for weekly analysis: (1) Fargo, North Dakota, United States of America (46.9°N, 96.8°W); (2) Winnipeg, Manitoba, Canada (49.9°N, 97.1°W); (3) Saskatoon, Saskatchewan, Canada (52.1°N, 106.6°W); (4) Edmonton, Alberta, Canada (53.6°N, 113.6°W); (5) Peace River, Alberta, Canada (56.2°N, 117.3°W).
Model runs were conducted for North America, Europe, and Asia. Climate data, obtained from the CliMond 10 spatial resolution climate data set, were used as input into the model (Kriticos et al. Reference Kriticos, Webber, Leriche, Ota, Macadam, Bathols and Scott2012). The CliMond data set was developed for species bioclimatic modelling, including both correlative and process-based (Nakicenovic and Swart Reference Nakicenovic and Swart2000) mechanistic models. The 10' gridded data set includes a hybrid historical data set, based on CRU CL2.0 and WorldClim1975 (Kriticos et al. Reference Kriticos, Webber, Leriche, Ota, Macadam, Bathols and Scott2012). Incremental changes in temperature and precipitation were used to assess the sensitivity of the two species to these variables, based on EI values. Climate data sets were amended by increasing or decreasing precipitation by 20% and 40%, and increasing or decreasing temperature by 1 °C for each grid cell.
Results and discussion
Model validation
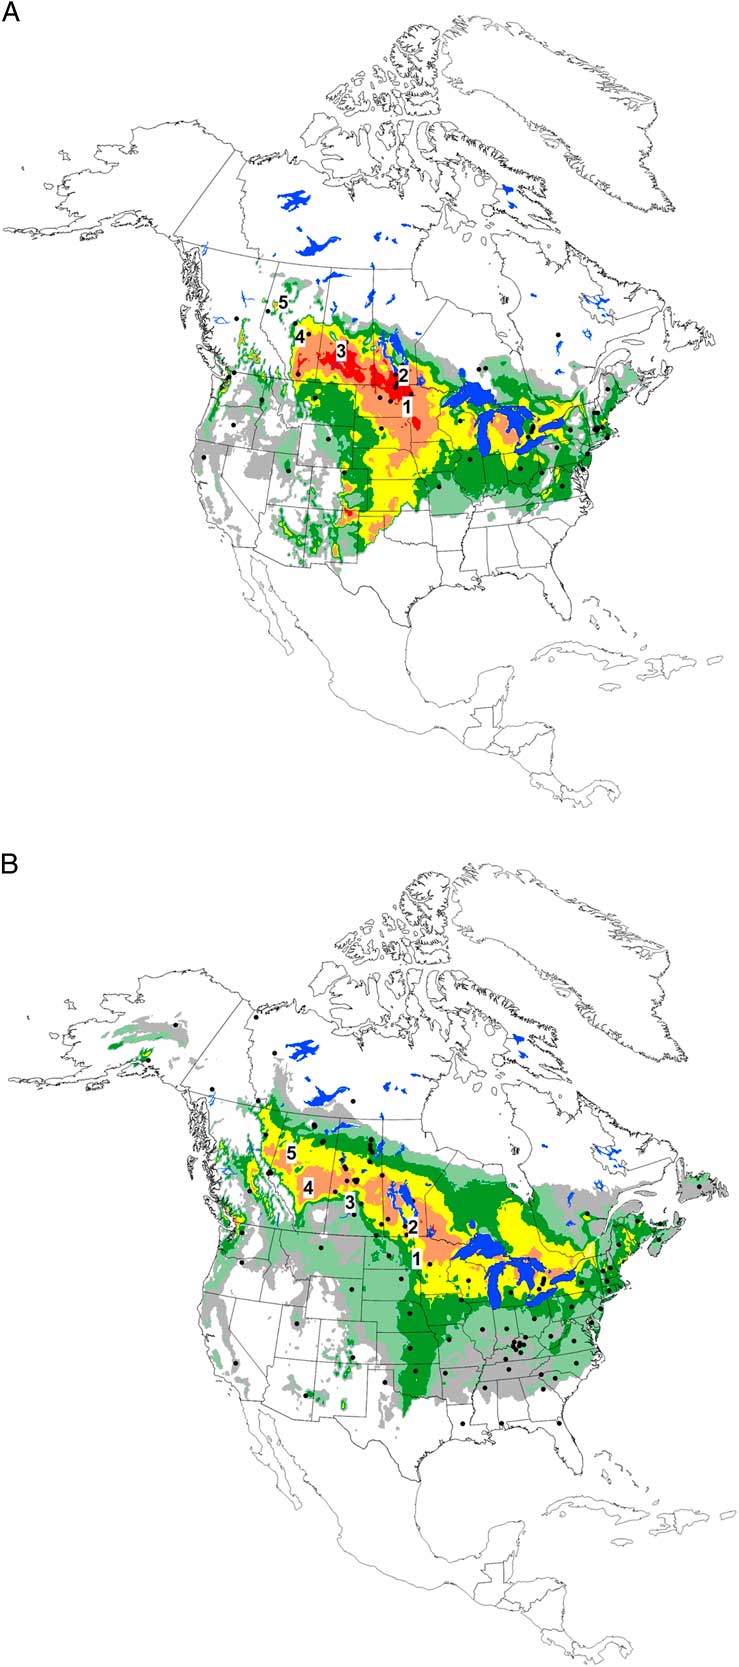
The modelled North American distributions of P. cruciferae and P. striolata for current climate agreed with observed distribution data. Based on distribution records for North America, P. cruciferae populations occur between 36°N and 56°N (Fig. 1A) (Beirne Reference Beirne1971; Wylie et al. Reference Wylie, Turnock and Burgess1984; Global Biodiversity Information Facility 2015). Compared with P. cruciferae, observed North American distributions of P. striolata are more widespread, with collection records extending from Florida, United States of America to Alaska (Fig. 1B). Ecoclimatic index values for P. striolata were greater than one across all states in the United States of America except Louisiana and Florida. For both of these states, diapause parameters limited southern distributions. In western Canada, both species usually have one generation (Burgess Reference Burgess1977), although on occasion two may occur (Westdal and Romanow Reference Westdal and Romanow1972); our model was parameterised with obligate diapause. Based on a facultative diapause setting, the P. cruciferae model indicated that two generations are possible in some locations across eastern North America. In Massachusetts, United States of America, and Ontario, Canada, two generations have been reported (Kinoshita et al. Reference Kinoshita, Svec, Harris and McEwan1979; Andersen et al. Reference Andersen, Hazzard, Van Driesche and Mangan2005). Chen et al. (Reference Chen, Shy, Ko, Hwang and Lin1991) reported that up to 11 overlapping generations (under laboratory conditions) may occur, suggesting that diapause may be facultative. Running the model without a diapause requirement resulted in model output that predicted that P. striolata distribution would occur across all of the Gulf States, including Louisiana and Florida.
Potential distribution and relative abundance of Phyllotreta cruciferae (A) and Phyllotreta striolata (B) in North America. Five regions were represented in North America: 1 – Fargo, North Dakota; 2 – Winnipeg, Manitoba; 3 – Saskatoon, Saskatchewan; 4 – Edmonton, Alberta; 5 – Peace River, Alberta. Ecoclimatic index values were presented in six categories: grey=very unfavourable (1–5); light green=unfavourable (5–10); dark green=marginal (10–15); yellow=suitable (15–20); orange=favourable (20–25); and red=very favourable (>25).

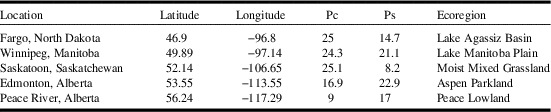
Although both species are not geographically exclusive across North America, species-specific EI values did vary across the central region of the Great Plains of North America. Based on observed occurrence of P. cruciferae and P. striolata across the Prairies and Boreal Plains Ecozones in western Canada, EI⩾20 indicated locations where flea beetle densities would be great enough to cause economic crop losses (Soroka and Elliott Reference Soroka and Elliott2011). Projections of P. striolata distribution and abundance agreed with observational distributions, in that EI⩾20 values were associated with the Aspen Parkland and Boreal Ecoregions. By comparison, P. cruciferae EI values were greatest across the Mixed and Moist Mixed Grasslands Ecoregions (Table 2). High P. cruciferae densities, relative to P. striolata, were reported at Winnipeg (Turnock et al. Reference Turnock, Lamb and Bilodeau1987). Given the extensive canola production in this region, P. cruciferae has the potential to be a more significant pest across southern and central areas of the Prairies Ecozone. Model output predicted that P. striolata EI values would be lower than those for P. cruciferae across southern regions of the Prairies Ecozone.
Site-specific ecoclimatic index values for Phyllotreta cruciferae (Pc) and Phyllotreta striolata (Ps) at selected locations in Canada and the United States of America, under current climate conditions.

Note: A geographic rectangle, 2° latitude by 2° longitude was used to delineate a geographic region around each location and ecoclimatic index values were averaged across the region (n=144 grid cells).
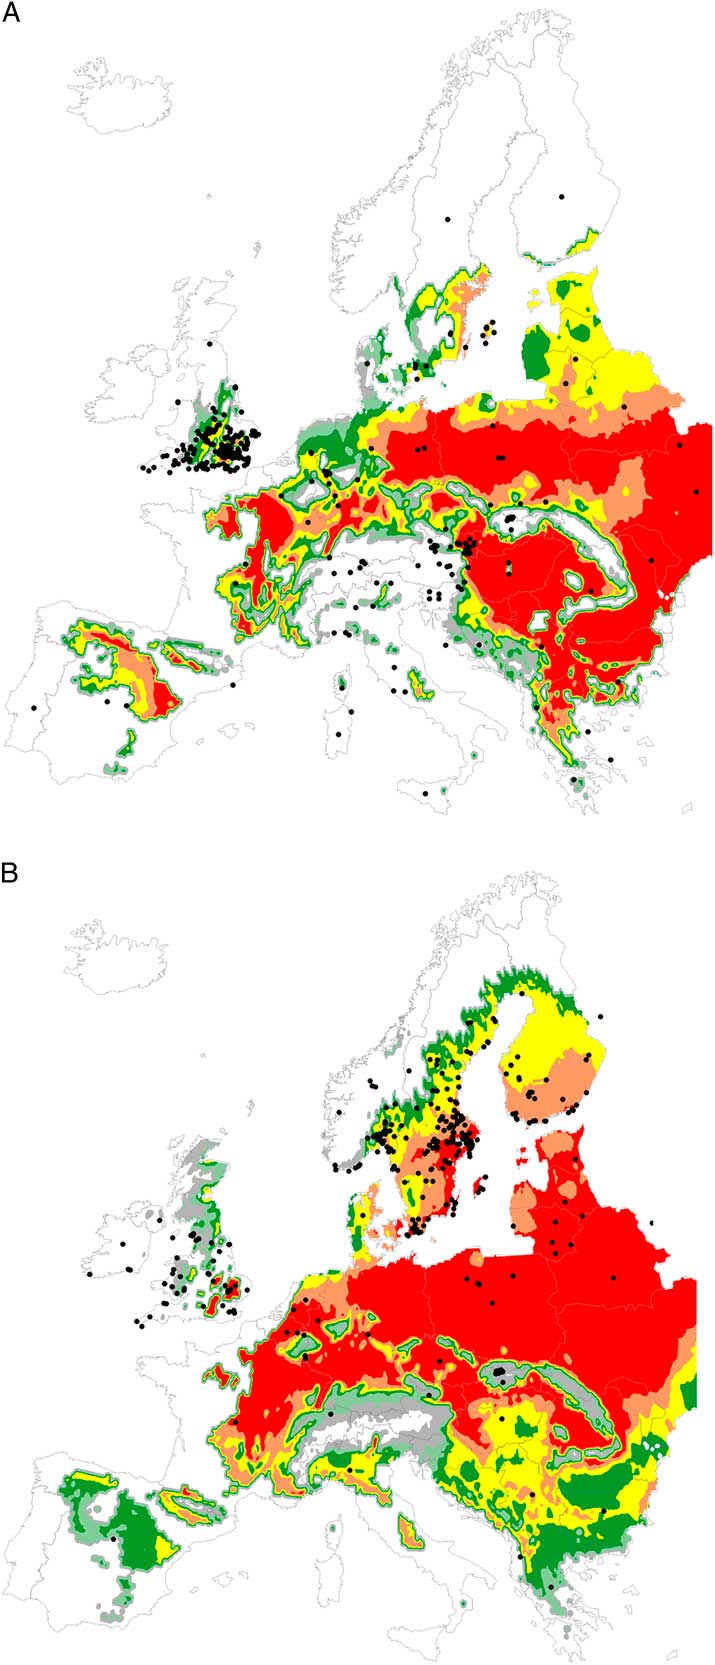
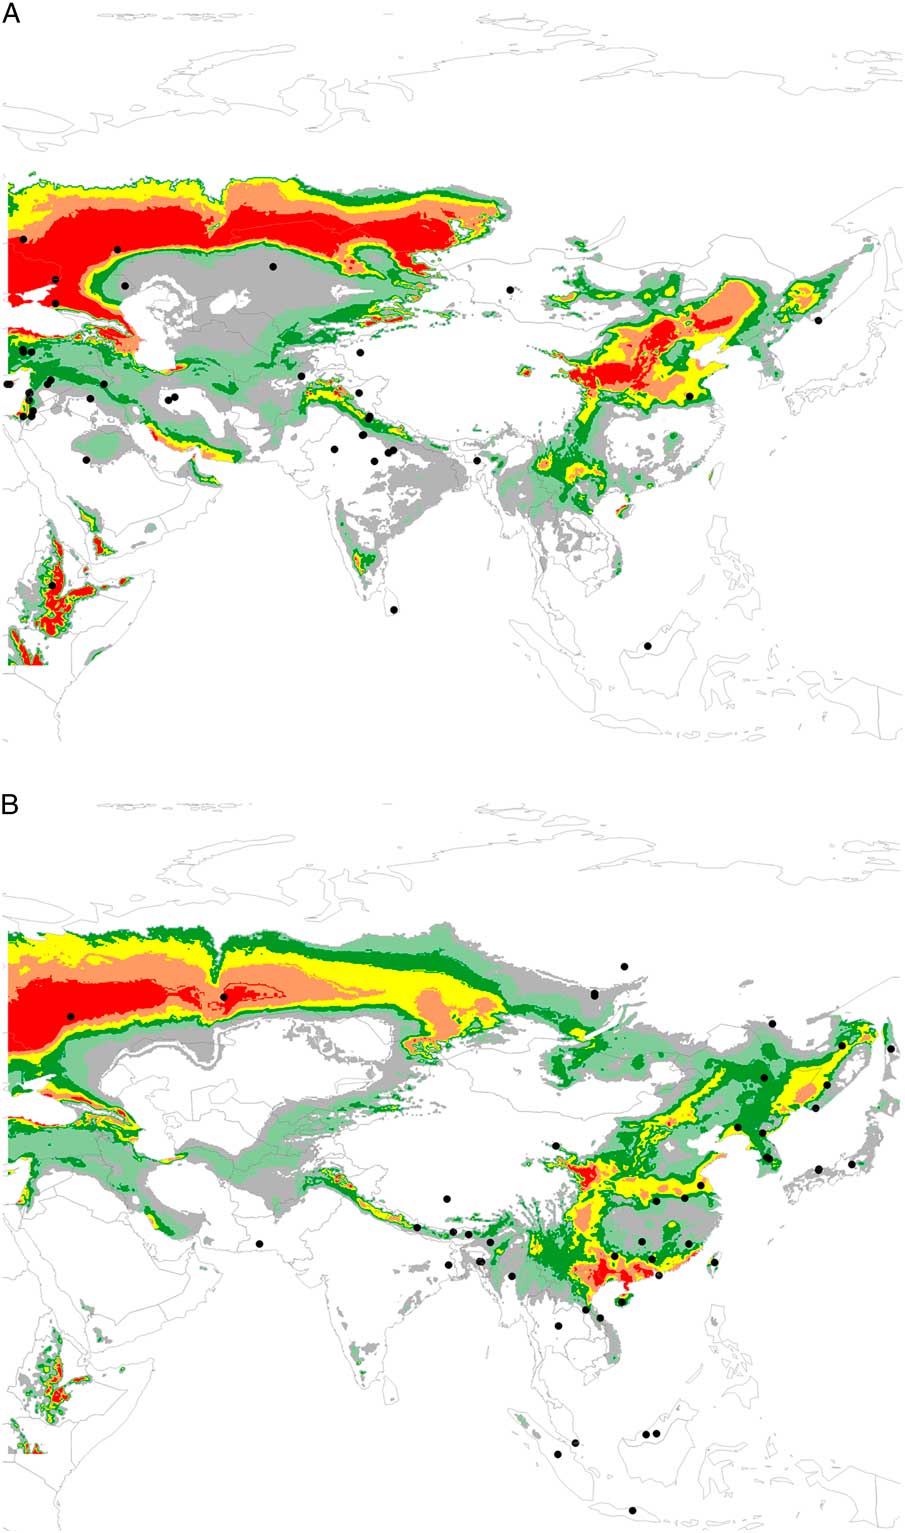
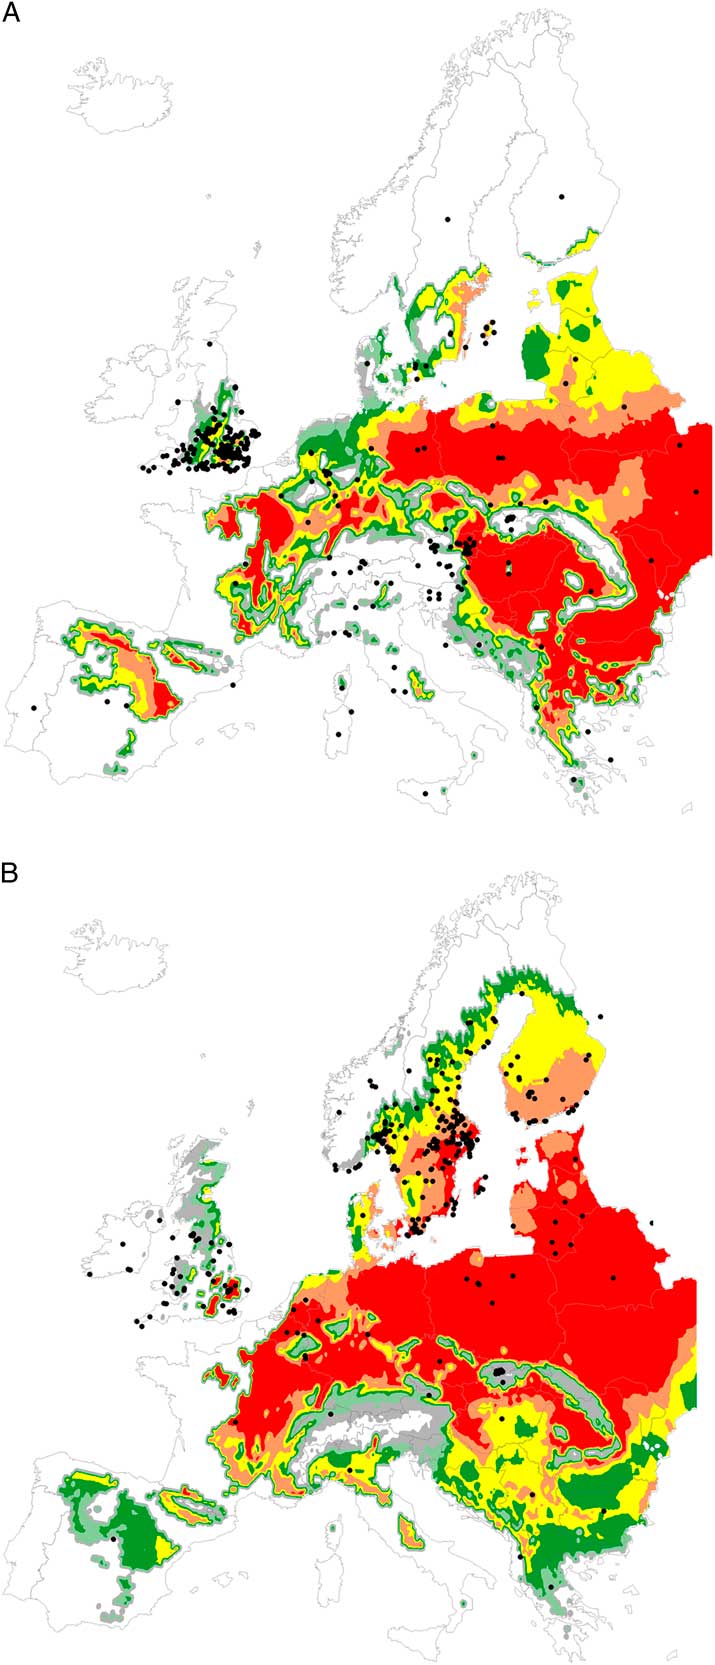
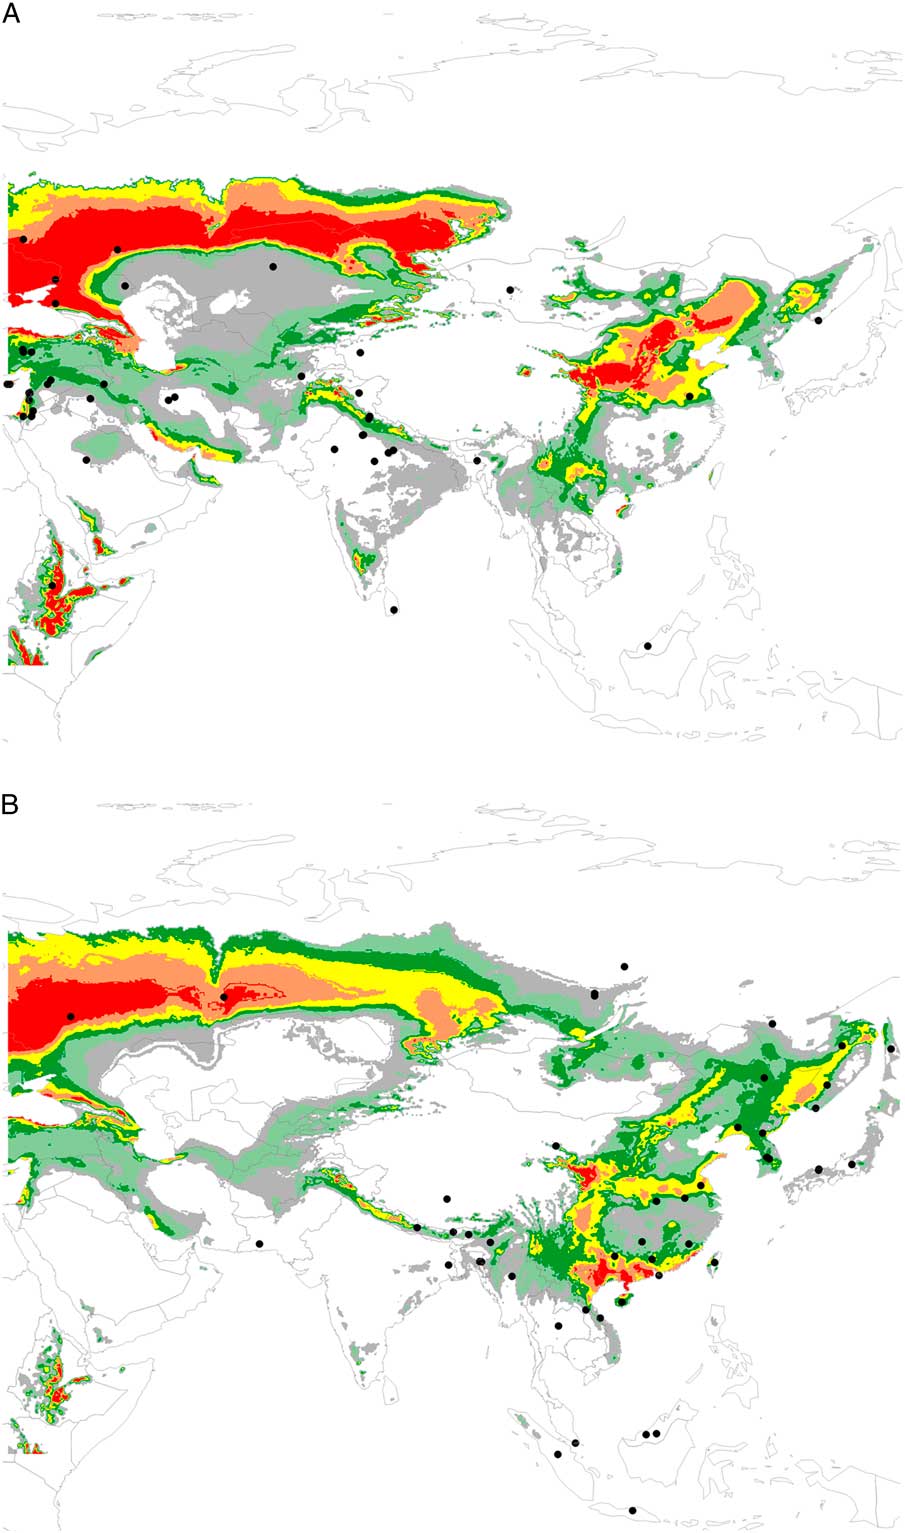
Model projections for distributions of P. cruciferae and P. striolata were in agreement with observed distributions for Europe (Fig. 2A– B) and Asia (Fig. 3A– B). Occurrences of P. cruciferae were more prevalent across central and southern Europe, whereas P. striolata distributions were more northerly. The P. cruciferae model predicted greater EI values across central and southern Europe, particularly across the Balkans. Similar to North America, P. striolata distributions were predicted to be more widespread than P. cruciferae. Model runs for Asia were conducted without obligate diapause and output for both species was in close agreement with reported distributions (Fig. 3A– B).
Potential distribution and relative abundance of Phyllotreta cruciferae (A) and Phyllotreta striolata (B) in Europe. Ecoclimatic index values were presented in six categories: grey=very unfavourable (1–5); light green=unfavourable (5–10); dark green=marginal (10–15); yellow=suitable (15–20); orange=favourable (20–25); and red=very favourable (>25).
Potential distribution and relative abundance of Phyllotreta cruciferae (A) and Phyllotreta striolata (B) in Asia. Ecoclimatic index values were presented in six categories: grey=very unfavourable (1–5); light green=unfavourable (5–10); dark green=marginal (10–15); yellow=suitable (15–20); orange=favourable (20–25); and red=very favourable (>25).
Comparison of model predictions with observed insect phenology in the field can be used to further validate CLIMEX models. Model output was compared across a number of locations (Wylie Reference Wylie1979; Lamb Reference Lamb1983; Turnock et al. Reference Turnock, Lamb and Bilodeau1987; Ulmer and Dosdall Reference Ulmer and Dosdall2006) to determine when each species was predicted to become active in spring, the occurrence of peak populations, and the termination of activities in the fall. The model predicted that P. striolata activity would start earlier than P. cruciferae. Phyllotreta striolata have been reported to become active one or two weeks earlier in the spring than P. cruciferae (Burgess Reference Burgess1977, Reference Burgess1982; Wylie Reference Wylie1979). Phyllotreta cruciferae were reported to emerge from overwintering sites in April in Lethbridge, Alberta and from mid-April to early May in Manitoba (Wylie Reference Wylie1979; Lamb Reference Lamb1983; Turnock et al. Reference Turnock, Lamb and Bilodeau1987; Ulmer and Dosdall Reference Ulmer and Dosdall2006). Predicted emergence dates varied across the Prairies Ecozone. For example, the model indicated that spring P. cruciferae emergence would occur during late April in southern Alberta and late April to early May across grid cells near Winnipeg. Phyllotreta cruciferae populations (based on weekly GI) in southern Alberta were expected to be greatest in early to mid-July. In Massachusetts, P. cruciferae populations were anticipated to occur in late August, which was similar to observed counts that peaked on 15 August (Andersen et al. Reference Andersen, Hazzard, Van Driesche and Mangan2005). Model parameterisation of the diapause termination temperature (DPT1) initially appeared to be unrealistically low (P. cruciferae=3 °C; P. striolata=1 °C). These values were required in order to produce model predictions that agreed with observations made in the field. Ulmer and Dosdall (Reference Ulmer and Dosdall2006) stated that spring emergence was best explained when related to soil temperatures and that soil temperatures were 2 °C higher than temperatures recorded in leaf litter within cages placed in fields.
In southern Alberta, new generation adults were last collected on 8 September in early seeded plots (seeded 7 May) and on 25 September on later seeded plots (seeded 14 May) (Ulmer and Dosdall Reference Ulmer and Dosdall2006). Burgess (Reference Burgess1977) observed feeding activity by adult P. cruciferae as late as 22 October at Saskatoon. Lamb (Reference Lamb1983) observed large numbers of P. cruciferae during the last week of August and the first week of September, and suggested that this represented the movement of beetles from fields to overwintering sites. The P. cruciferae model forecasted that activity would cease across the southern prairies by late September or early October.
Ecological sensitivity analysis
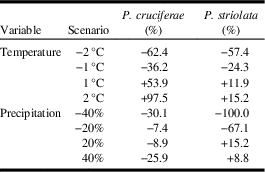
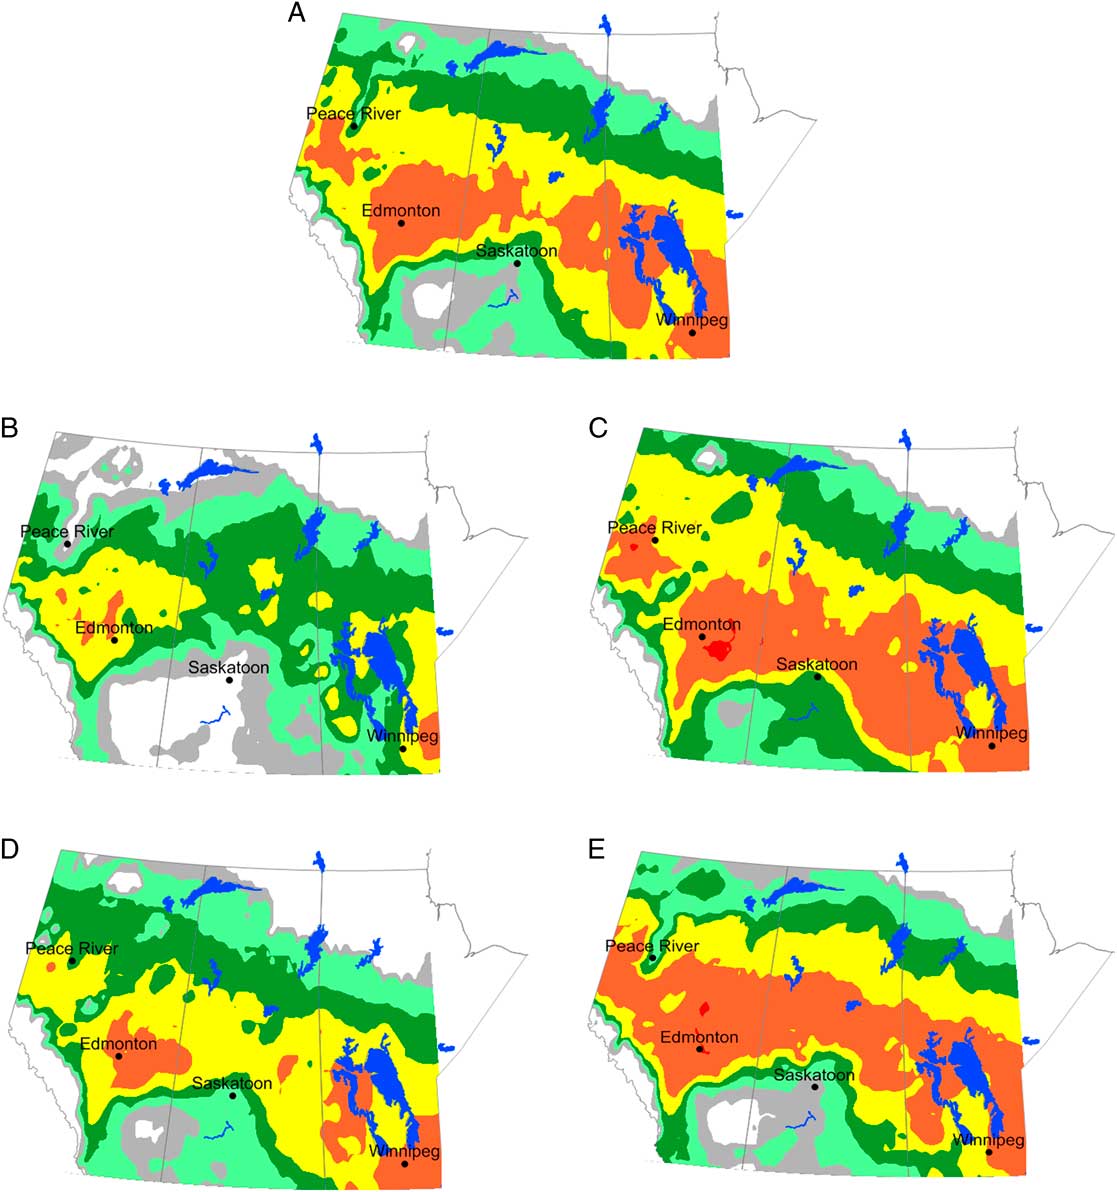
Climate data were incrementally input for analysis to determine species sensitivity to temperature and moisture. The purpose was to compare species response between wet/dry and cool/warm seasons and how this may impact distribution and abundance. The analysis was limited to the Canadian Prairies and Boreal Plains Ecozones and model output for each incremental scenario for P. cruciferae (Fig. 4) and P. striolata (Fig. 5) was compared with current climate (Table 3). Across these two ecozones, pest populations (EI⩾20) were affected by increases and decreases of temperature and precipitation. Cooler temperatures were predicted to result in range decreases for both species. Area with EI⩾20 was predicted to increase with warmer than average growing seasons, with P. cruciferae populations having a more rapid increase than P. striolata. In terms of growing season precipitation, wetter seasons favoured P. striolata while both wetter and dryer conditions were shown to negatively impact P. cruciferae (Table 3).
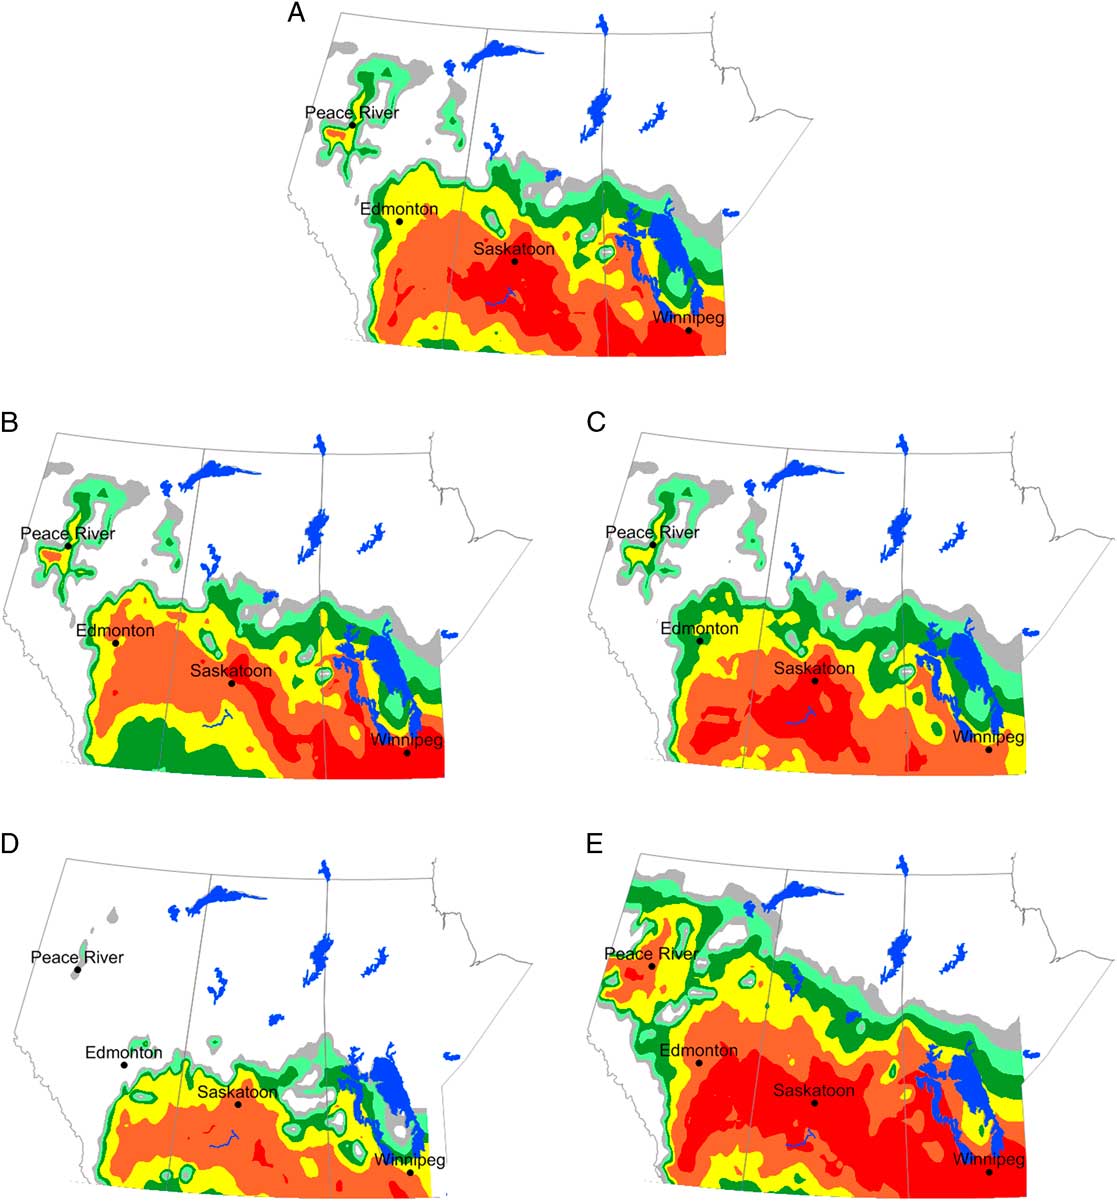
Potential distribution and relative abundance of Phyllotreta cruciferae in western Canada for current climate (A), precipitation levels that are 20% less (B) and 20% greater (C) than current climate; and temperatures that are 1 °C less (D) and 1 °C greater than current climate (E). Ecoclimatic index values were presented in six categories: grey=very unfavourable (1–5); light green=unfavourable (5–10); dark green=marginal (10–15); yellow=suitable (15–20); orange=favourable (20–25); and red=very favourable (>25).
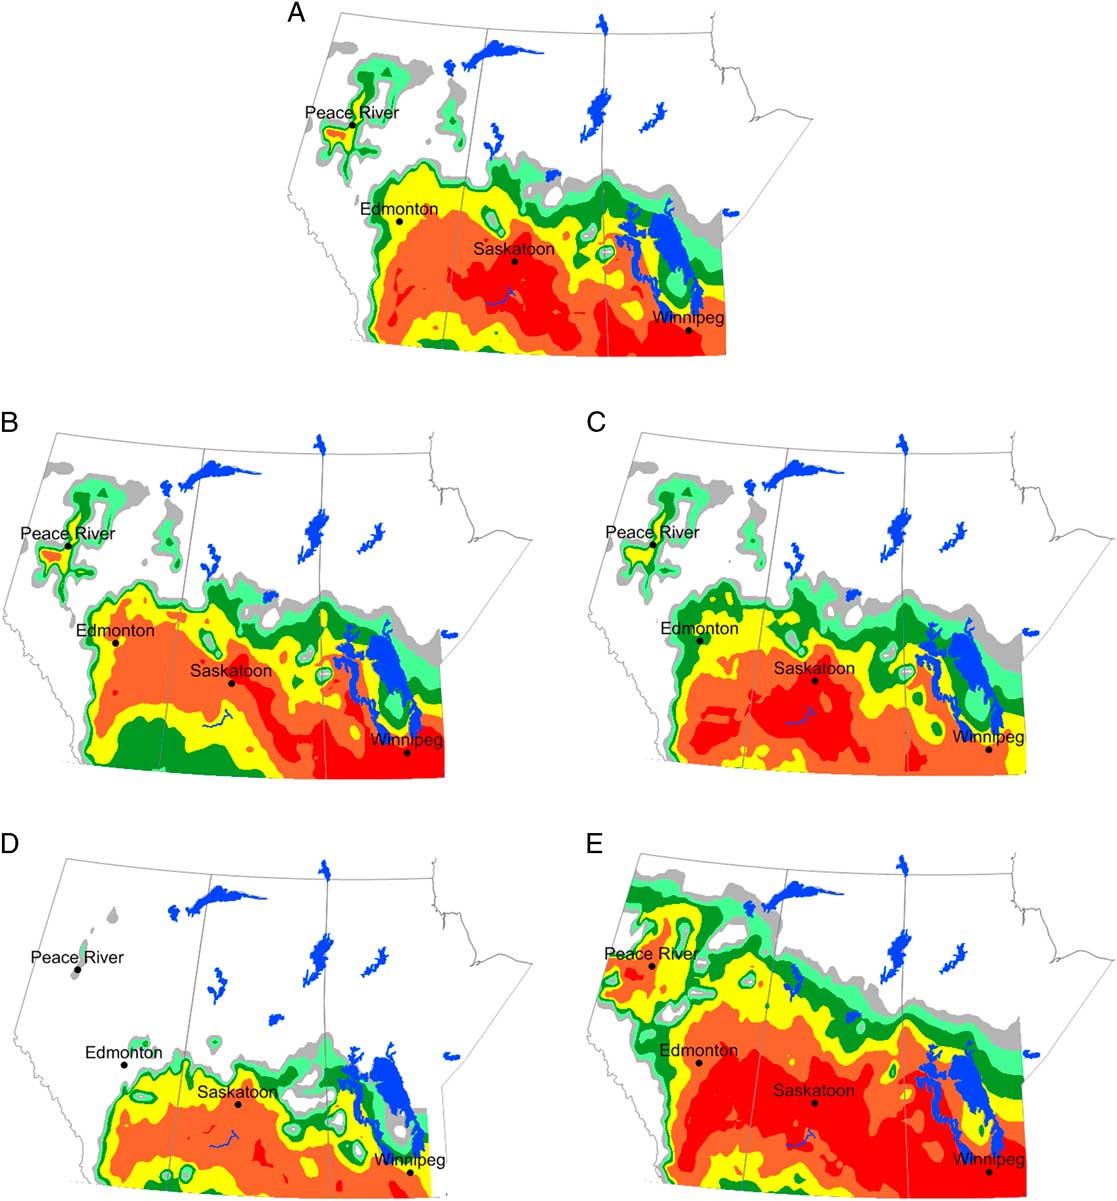
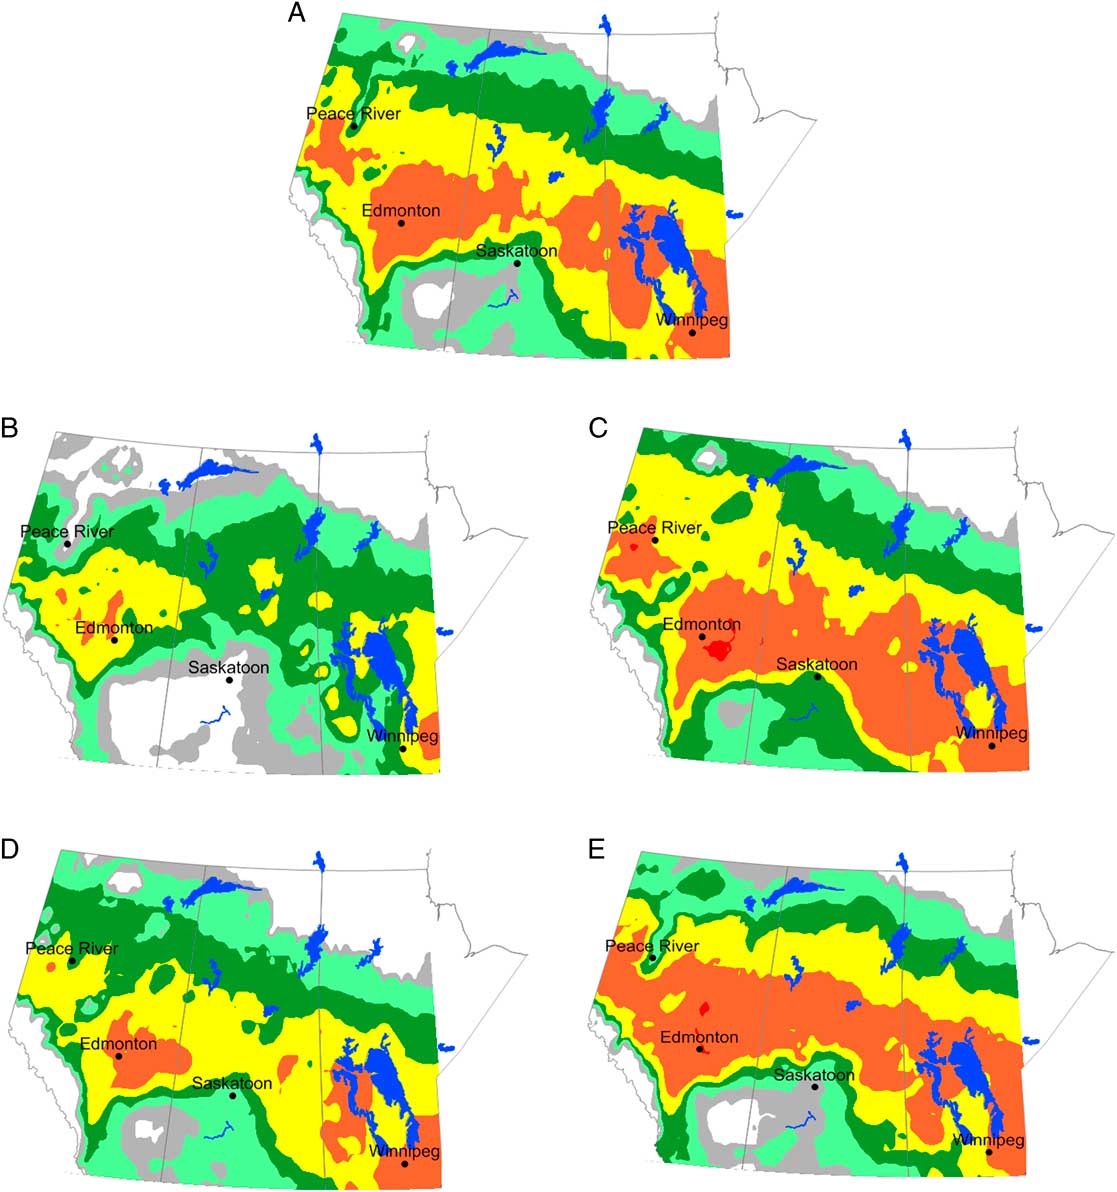
Potential distribution and relative abundance of Phyllotreta striolata in western Canada for current climate (A), precipitation levels that are 20% less (B) and 20% greater (C) than current climate; and temperatures that are 1 °C less (D) and 1 °C greater than current climate (E). Ecoclimatic index values were presented in six categories: grey=very unfavourable (1–5); light green=unfavourable (5–10); dark green=marginal (10–15); yellow=suitable (15–20); orange=favourable (20–25); and red=very favourable (>25).
Change in area from current conditions (expressed as a per cent of area for current climate) in western Canada with EI⩾20 for Phyllotreta cruciferae and Phyllotreta striolata based on temperatures that are 1 °C and 2 °C warmer and cooler than current climate; and precipitation levels that are 40%, 20% less than and greater than current climate.

Spatial responses of both species varied across Alberta, Saskatchewan, and Manitoba. Model output for current climate agreed with observed distributions of P. cruciferae (Fig. 4A) and P. striolata (Fig. 5A). Model projections indicated that there were species differences for distribution and relative abundance. Burgess (Reference Burgess1984) reported that P. cruciferae was most abundant in the dark brown soil zone and P. striolata was more prevalent in the Parkland region. Based on EI⩾20, P. cruciferae was predicted to be more abundant, over a wider range, than P. striolata. Analysis of site-specific EI values indicated that P. cruciferae would be the prevalent species in southern locations including Winnipeg and Saskatoon and P. striolata would be more abundant in northern locations including Edmonton and Peace River (Table 2). Models indicated that P. striolata (Fig. 5) would be more sensitive to changes in growing season precipitation than P. cruciferae (Fig. 4). Growing seasons with dryer than normal conditions (20% less precipitation) would result in range contraction and reduced densities for both species (Figs. 4B, 5B) with P. striolata being most sensitive to dry conditions. Growing seasons with above average precipitation (20% more than current climate) were not predicted to have a significant impact on P. cruciferae distribution or abundance across the prairies (Fig. 4C). However, these wetter conditions were shown to increase both range and abundance of P. striolata (Fig. 5C).
Relative to current climate, growing seasons that are cooler than normal (1 °C cooler) were predicted to result in a range contraction (south) and reduced EI values for P. cruciferae (Fig. 4D). This was particularly evident for the Peace River region of Alberta. Cooler conditions were predicted to reduce P. striolata abundance while having minimal impact on distribution (Fig. 5D). A warmer growing season by 1 °C, was predicted to result in favourable conditions for P. cruciferae (Fig. 4E). The EI values for the Peace River region would be greater than 20 across the region. The response of P. striolata to a 1 °C increase in temperature varied across the Prairies Ecozone (Fig. 5E). Warmer conditions would result in reduced abundance and range contraction for P. striolata across the southern Alberta and Saskatchewan while abundance and distribution would increase across the Parkland and Peace River regions.
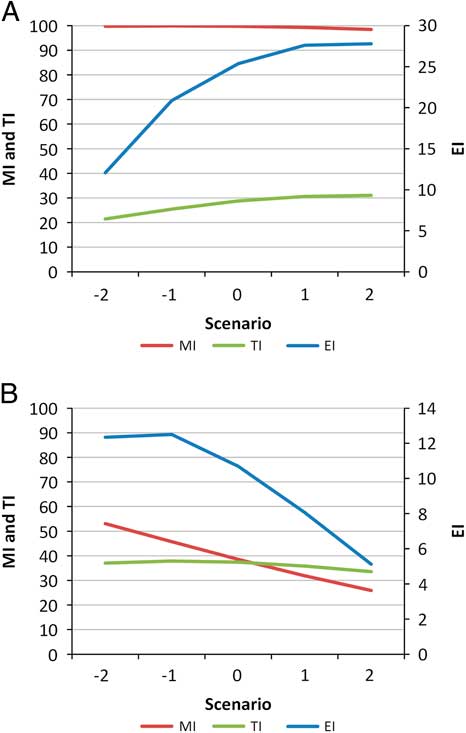
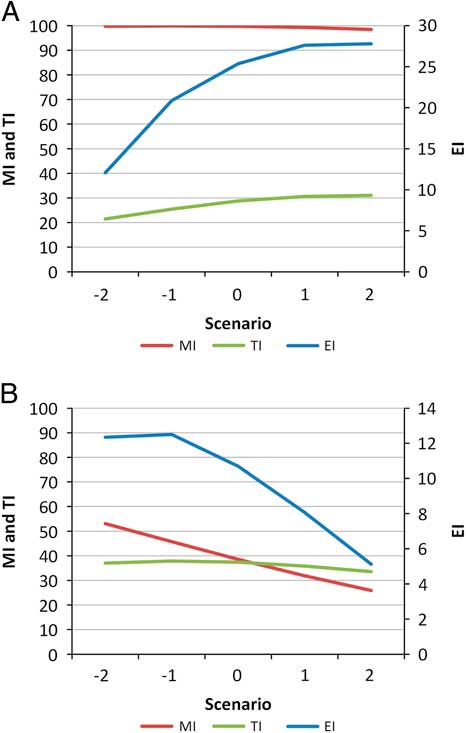
Both P. cruciferae and P. striolata demonstrated sensitivity to temperature changes in the range of −2 °C to +2 °C (compared with normal climate values) though the observed differences were due to species-specific responses. Based on model runs for Saskatoon, P. cruciferae EI values increased with increasing temperatures, with minimal difference between 1 °C and 2 °C above average (Fig. 6A). Model output indicated that the increased EI was a result of increasing temperature index values whereas the moisture index was optimal across all temperatures. Ecoclimatic index values for P. striolata declined with increasing temperatures (Fig. 6B). The decline was related to a rapid decline in moisture index. Based on calculation of moisture index, the decrease in moisture index was due to increased evapotranspiration and subsequent reduction in soil moisture. Results indicate that at Saskatoon P. cruciferae would be more abundant during warmer periods while P. striolata populations would be greatest for cooler than average growing seasons.
Annual ecoclimatic index (EI), moisture index (MI), and temperature index (TI) for Phyllotreta cruciferae (A) and Phyllotreta striolata (B) based on current climate and temperature levels that are 1 °C and 2 °C greater and less than current climate at Saskatoon, Saskatchewan. Values were obtained by calculating the average across all grid cells (n=144) delineated by a geographic rectangle, 2° latitude by 2° longitude centred on Saskatoon.
Concluding comments
Given the potential difference in the response of the two flea beetle species to selected climate variables, it is important to continue documenting their current and future distribution and abundance. Our results indicate that there were species-specific responses to climate. Furthermore, responses varied spatially and temporally. Of note, the bioclimatic model for P. striolata was developed without a diapause requirement in order to accurately predict the distribution of P. striolata throughout North America.
Currently, mitigation strategies to prevent flea beetle damage in canola crops in western Canada rely heavily on insecticidal seed treatments. However, management practices involving different insecticidal seed treatments are becoming specific to each species (Tansey et al. Reference Tansey, Dosdall, Keddie and Sarfraz2008). This study highlights the regions of the Prairies and Boreal Plains Ecozones that are most sensitive to shifts of the two populations and which may require changes in insecticidal seed treatments for effective control. As Soroka and Elliott (Reference Soroka and Elliott2011) note, there are other management strategies that could reduce producer dependency on insecticidal control of the two species. To implement these alternate strategies, advance risk warnings of the distribution and density of flea beetle populations would be required in order to forewarn producers of potential economic populations the next spring. These include increasing seeding rate (Soroka Reference Soroka2013), growing canola under zero-tillage (Dosdall et al. Reference Dosdall, Dolinski, Cowle and Conway1999), using large seeds (Bodnaryk and Lamb Reference Bodnaryk and Lamb1991), and planting with wide row spacings (Dosdall et al. Reference Dosdall, Dolinski, Cowle and Conway1999). In western Canada, where insecticidal seed treatments are widely used, Tansey et al. (Reference Tansey, Dosdall, Keddie and Sarfraz2008) reported that differences in susceptibilities to neonicotinoid seed treatments have the potential to influence interactions between P. cruciferae and P. striolata populations as well.
Acknowledgements
The authors would like to acknowledge the financial support of the Canola/Flax Canadian Agri-Science Cluster Program. Debbie Nordstrom’s input into the development of the bioclimate models is much appreciated.