I. INTRODUCTION
In the past 30 years, considerable attention has been paid to the hot ductility trough which is present when high strength low alloy steels are tension-tested at low strain rates (10−3 to 10−4 s−1) in the temperature range 1000 to 700 °C, and the hot ductility trough occurs through intergranular failure.Reference Mintz, Yue and Jonas1 Steels are prone to transverse cracking during the continuous casting over this temperature and strain rate range.Reference Ouchi and Matsumoto2
In the past 100 years, many scientists used lots of theories to explain the hot ductility loss, such as equi-cohesive temperature,Reference Bengough3 ferrite mechanism for steels, grain boundary sliding, and precipitate mechanism at grain boundaries for alloys, and so on. But these theories cannot satisfy all the metals and alloys which include austenitic steels without ferrite and those without precipitates at grain boundaries.Reference Mintz, Yue and Jonas1,Reference Tang, Emura and Hagiwara4–Reference Mintz and Crowther8 For example, grain boundary sliding is one of the deformation mechanisms of materials which includes displacement of grains against each other at high homologous temperature and low strain rate. This mechanism is the main reason for ceramics failure at high temperatures due to the formation of glassy phase in their grain boundary.Reference Rösler, Harders and Bäker9 This mechanism can only explain the phenomenon that the hot ductility decreases with the increasing temperature, however, it cannot explain the hot ductility minimum value phenomenon. Sun et al.Reference Sun, Yamane and Hirao10 also reported that no glassy phase was observed in their grain boundary of ferritic stainless steel.
To make the mechanism clear, Mintz et al.Reference Mintz, Shaker and Crowther11 investigated the effects of grain size and strain rate on the hot ductility of austenitic and ferritic stainless steels. It was found interestingly that the hot ductility of the austenitic steel decreased with decreasing strain rate whereas the hot ductility of the ferritic steel increased. It was quite confusing for them, and the mechanism was not figured out.
In 2013, Xu et al.Reference Xu, Zheng, Wang and Misra12 suggested a universal mechanism of the intermediate temperature embrittlement (ITE), namely, NGS mechanism. In this study, we expand this mechanism to the ITE of stainless steels and calculate the critical time and critical cooling rate to explain the experimental results quantitatively.
II. EXPERIMENTAL RESULTS
Mintz et al.Reference Mintz, Shaker and Crowther11 investigated the influences of strain rate and grain size on the hot ductility of austenitic stainless steel and ferritic stainless steel. They examined two kinds of stainless steels at the same time, which are typical of stainless steels. More importantly, the effect of strain rate on the hot ductility was studied, obtaining very interesting results. However, it is so pity that the mechanism is still unclear. The following gives a description of this fancy phenomenon.
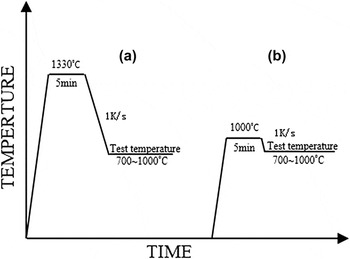
The different austenitizing temperatures give two grain sizes, as shown in Fig. 1. The coarse grain size, 600 μm, was obtained by heating the samples at 1330 °C and the fine grain size, ∼30 μm, by heating at 1000 °C. After held for 5 min at these two temperatures, the samples were cooled at 1 K/s to different test temperatures (750∼1000 °C) and tension-tested at different strain rates (10−1–10−4 s−1). The reduction of area was taken as the measure of ductility.
(a) The hot history of coarse-grained austenitic and ferritic stainless steels; (b) the hot history of fine-grained austenitic and ferritic stainless steels.

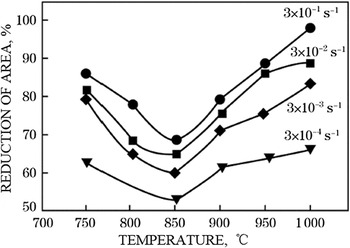
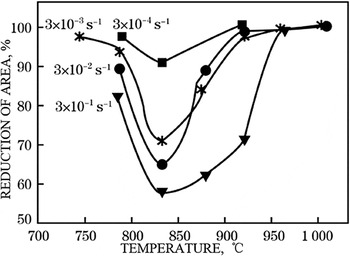
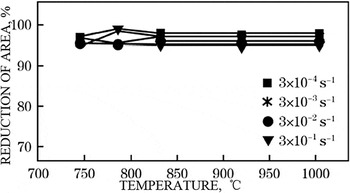
The experimental results are shown in Figs. 2–5. As shown in Figs. 2 and 4, the width and depth of the hot ductility troughs of both the austenitic and ferritic steels are similar. However, it is strange that the ductility of the austenitic steel improves with increasing strain rate whereas the ductility of the ferritic steel deteriorates in the case of coarse grain microstructure. However, the strain rate has no apparent influence on the hot ductility behaviors of the two steels in the case of fine-grained microstructure (see Figs. 3 and 5).
Hot ductility curves for coarse-grained austenitic stainless steel at four strain rates.Reference Mintz, Shaker and Crowther11

Hot ductility curves for fine-grained austenitic stainless steel at four strain rates.Reference Mintz, Shaker and Crowther11

Hot ductility curves for coarse-grained ferritic stainless steel at four strain rates.Reference Mintz, Shaker and Crowther11

Hot ductility curves for fine-grained ferritic stainless steel at four rates.Reference Mintz, Shaker and Crowther11

III. DISCUSSION
This section is divided into two parts: one introduces the micromechanism of NGS and the other explains the experimental phenomena demonstrated in Figs. 2–5 by virtue of the mechanism.
A. Micromechanism of NGS
The NGS includes thermally induced nonequilibrium grain-boundary segregation (TNGS)Reference Xu and Cheng13–Reference Xu16 and stress-induced nonequilibrium grain boundary segregation (SNGS).Reference Xu and Cheng13–Reference Xu20 They are both produced by the vacancy–solute atom complex effect.
1. Critical time
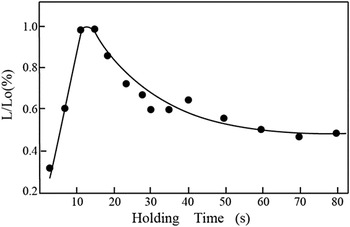
The mechanism of TNGS relies on the formation of vacancy–solute atom complexes. Within the matrix, solute atoms, vacancies and their complexes are in dynamic equilibrium.Reference Williams, Stoneham and Harries21–Reference Faulkner24 If a sample is solution treated at an elevated temperature and subsequently cooled to a lower temperature and held there, there must be a holding time at which the grain boundary concentration reaches a maximum value, as shown in Fig. 1 of Ref. Reference Xu15. This holding time is called the critical time of TNGS.Reference Xu and Cheng13,Reference Xu and Song14,Reference Xu, Song, Shi, Gust and Yuan25 When the holding time is shorter than the critical time, the grain boundary concentration of solute increases with the increasing holding time, being referred as the segregation. In the segregation process, the forward diffusion of complexes from the matrix to the grain boundary is dominant. When the holding time is beyond the critical time, the grain boundary concentration of solute decreases with increasing holding time, being referred as the desegregation. In the desegregation process, the backward diffusion of solute atoms from the grain boundary to the matrix is dominant. The fact that a critical time exists is a characteristic aspect of TNGS.Reference Xu and Cheng13,Reference Xu and Song14,Reference Xu, Song, Shi, Gust and Yuan25 The critical time is given byReference Xu and Cheng13,Reference Xu and Song14,Reference Faulkner22 :
 $${t_{\rm{c}}} = {{\left[ {{r^2}\ln {{{D_{\rm{c}}}} \mathord{\left/ {\vphantom {{{D_{\rm{c}}}} {{D_{\rm{i}}}}}} \right. \kern-\nulldelimiterspace} {{D_{\rm{i}}}}}} \right]} \mathord{\left/ {\vphantom {{\left[ {{r^2}\ln {{{D_{\rm{c}}}} \mathord{\left/ {\vphantom {{{D_{\rm{c}}}} {{D_{\rm{i}}}}}} \right. \kern-\nulldelimiterspace} {{D_{\rm{i}}}}}} \right]} {\left[ {\delta \left( {{D_{\rm{c}}} - {D_{\rm{i}}}} \right)} \right]}}} \right. \kern-\nulldelimiterspace} {\left[ {\delta \left( {{D_{\rm{c}}} - {D_{\rm{i}}}} \right)} \right]}}\quad ,$$
where D i and D c are the diffusion coefficients of solute atoms and complexes in the matrix, respectively. r is the grain radius and δ is the critical time constant. The TNGS concentration depends on how close the holding time is to the critical time. As shown in Fig. 6, the closer the holding time to the critical time, the higher the TNGS concentration and thus the severer the intergranular embrittlement.
Variation of L/Lo with the isothermal hold time at 1050 °C for a Fe–30Ni(B) alloy. All samples were water-quenched to 0 °C after isothermal holding at 1250 °C for 0.5 h. Where Lo is the total length of the grain boundaries in a unit cross-section area of the sample and L is the length of the grain boundaries in the same area in which continuous segregation regions of boron are formed by particle tracking autoradiograph.Reference Xu16

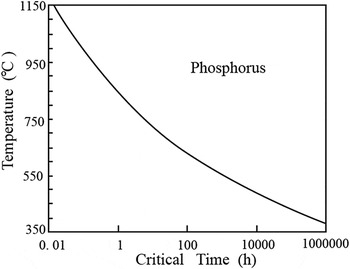
The relationship between the critical time and the aging temperature for phosphorus in steel is calculated from Eq. (1) and is represented in Fig. 7.Reference Xu and Cheng13 It is obvious that the critical time increases with decreasing aging temperature, which was confirmed experimentally, such as TNGS of phosphorus measured in 2.6NiCrMoV low alloy steelReference Misra and Balasubramanian26,Reference Misra and Rama Rao27 and 304L stainless steel.Reference Briant28
Calculated relationship between critical time and isothermal temperature, with phosphorus in steel as an example using critical time Eq. (1).Reference Xu and Cheng13

2. Effect of temperature difference
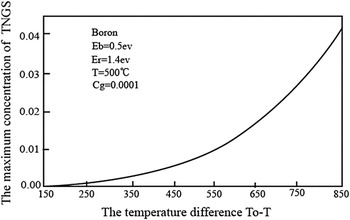
The relationship between the maximum concentration of TNGS and the cooling temperature difference is shown in Fig. 8. It is seen that the maximum concentration of TNGS increases monotonically with increasing cooling temperature difference, which is called the effect of temperature difference.Reference Mintz, Shaker and Crowther11 This is another characteristic of TNGS, which is a thermodynamic property and is not related to the cooling rate. The difference between the solution treatment temperature and the aging temperature acts as a prerequisite for the occurrence of TNGS. This effect was formulated by XuReference Xu15 in 1987, which was confirmed by a number of researchers.Reference Mintz, Shaker and Crowther11,Reference Williams, Stoneham and Harries21,Reference Aust, Hanneman, Niessen and Westbrook29–Reference Karlsson, Norden and Odelius31 It is envisaged from this effect that the depth and width of ductility trough will increase when the solution temperature rises during tensile tests at elevated temperatures.
The relationship between the maximum TNGS concentration, C m, and the temperature difference, T o−T.Reference Xu, Zheng, Wang and Misra12

3. Critical cooling rate
As discussed in Refs. Reference Xu and Cheng13 and Reference Xu16, a continuous cooling curve for a sample cooled from temperature T j to T i can be replaced by a corresponding stepped curve, where each step is formed by horizontal and vertical segments to enable the calculation of an effective time at temperature T i for the cooling curve. The effective time of the stepped curve consisting of n infinitesimal steps is given byReference Xu and Cheng13,Reference Xu16 :
 $${t_{\rm{e}}} = \mathop\sum\limits_{j = 1}^n {{t_j}} \exp \left[ {{{ - {E_{\rm{A}}}\left( {{T_{\rm{i}}} - {T_{\rm{j}}}} \right)} \mathord{\left/ {\vphantom {{ - {E_{\rm{A}}}\left( {{T_{\rm{i}}} - {T_{\rm{j}}}} \right)} {k{T_{\rm{i}}}{T_{\rm{j}}}}}} \right. \kern-\nulldelimiterspace} {k{T_{\rm{i}}}{T_{\rm{j}}}}}} \right]\quad ,$$
where E A is the activation energy for diffusion of complexes in the matrix. The diffusion effect of complexes during cooling along the continuous cooling curve is equal to that during holding for the effective time, t e, at temperature T i.
According to the concept of effective time and Eq. (2), there will be a cooling rate with which the effective time is equal to the critical time at the lower temperature. This cooling rate is called the critical cooling rate. If the samples are cooled at the critical cooling rate, the TNGS will reach a maximum value. If the samples are cooled at a slower or faster rate than the critical cooling rate, the amount of TNGS will be lower.Reference Xu and Cheng13 The existence of the critical cooling rate has experimentally been demonstrated for Sn segregation in low-carbon steelReference Yuan, Jia, Guo, Shen and Song32–Reference Yuan, Jia, Guo, Shen, Song and Liu34 and for boron segregation in interstitial-free steel.Reference El-Kashif, Asakura and Shibata35 Accordingly, the hot ductility will reach a minimum value if the samples are cooled at the critical cooling rate, and it will be higher if the sample is cooled at a slower or faster rate than the critical cooling rate.
B. The ITE of the testing steels induced by TNGS
Wang et al.Reference Wang, Wang, Si and Xu36 investigated the phosphorus segregation in 304L stainless steel and Sun et al.Reference Sun, Yamane and Hirao37 reported phosphorus and sulfur segregation in Fe–17Cr alloy. Based on this situation, phosphorus is chosen as the segregating element for both stainless steels. The quantitative analysis of the experimental results is as follows.
1. The effect of temperature difference on hot ductility
The ITE can be produced by both TNGS prior to tensile testing and SNGS during the testing. According to the hot history of coarse-grained austenitic and ferritic steels (see Fig. 1), the temperature difference between 1330 °C and test temperatures (700–1000 °C) is enough to produce TNGS. Hence, it may be suggested that the hot ductility of coarse-grained austenitic and ferritic steels shown in Figs. 2 and 4 was mainly induced by the TNGS of phosphorus during cooling from 1330 °C to the test temperatures with a cooling rate of 1 K/s.
The fine grain sizes for both the austenitic and ferritic steels (30 μm and 40 μm, see Figs. 3 and 5) were obtained by heating the samples at 1000 °C, as indicated in Fig. 1. According to the effect of temperature difference on hot ductility, the solution temperature 1000 °C is too low to produce TNGS. This should be the reason why there is no ductility trough in the hot ductility curves in both steels.
2. Correlation between critical time and ductility trough
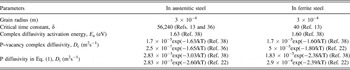
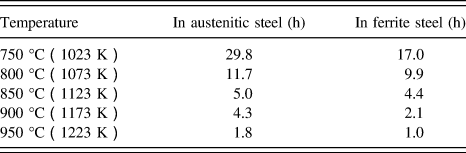
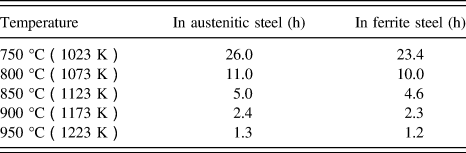
The critical times at different test temperatures and the corresponding effective times for phosphorus with a cooling rate of 1 K/s are calculated by Eqs. (1) and (2). The parameters used in the calculations are listed in Table I. The calculated results are shown in Tables II and III.
The parameters used in calculations.

The critical time of phosphorus TNGS at different test temperatures for both steels.
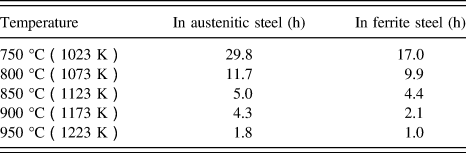
The effective time of complex diffusion at different test temperatures for both steels with the cooling rate of 1 K/s.
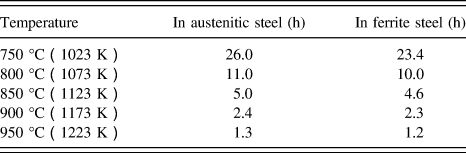
For the austenitic steel, the effective time of cooling from 1330 °C to 850 °C is 5.0 h, which is very close to the critical time at 850 °C. According to the definition of the critical time, the TNGS reaches a maximum at 850 °C, which means that the ductility achieves a minimum value. As a consequence, the ductility trough appears at 850 °C. The effective times at other test temperatures are shorter than the corresponding critical times, implying that they are still in the segregation phase where the segregation has not reached its maximum value. Thus, the ductility values are higher than that at 850 °C. Similarly, for the ferritic steel, the effective time for the cooling from 1330 °C to 800 °C is 10.0 h, which is very close to the corresponding critical time of 9.9 h. The effective times at the other test temperatures are longer than the corresponding critical times, indicating that they have been in the desegregation phase. Accordingly, the ductility trough emerges at 800 °C.
As stated above, it is concluded that the hot ductility trough for both steels is prevailingly induced by the TNGS of phosphorus.
3. The effect of critical cooling rate on hot ductility
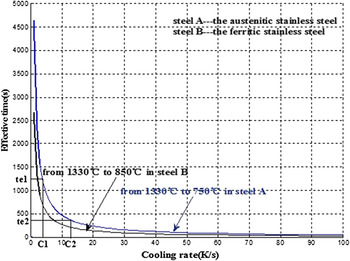
Figure 9 shows the relationship between the effective time and the cooling rate for the test temperatures of 850 and 750 °C. It is clear that the effective time decreases with increasing cooling rate (t e1>t e2, C1<C2). As described in Sec. III. A. 3, the critical cooling rate corresponds to an effective time which approaches the critical time at the holding temperature (test temperature). Comparing Tables II and III, one may conclude that the effective time for the austenitic steel with the cooling rate of 1 K/s is no longer than the critical time at each test temperature whereas that for the ferritic steel is on the contrary. That is to say, for the austenitic steel which was cooled from 1330 °C to 850 °C, the critical cooling rate is close to the cooling rate of 1 K/s while those of the other cooling processes are lower than the cooling rate of 1 K/s. But for the ferritic steel which was cooled from 1330 °C to 800 °C, the critical cooling rate is close to the cooling rate of 1 K/s while those of the other cooling processes are higher than the cooling rate of 1 K/s.
The calculated effective time as a function of cooling rate for both steels.

In the above discussion, a maximum amount of TNGS may be obtained only when the samples are cooled with the critical cooling rate. If the samples were cooled at a slower or faster rate than the critical cooling rate, the amount of TNGS will be lower. When taking these into consideration, it is suggested that the ductility trough should also occur at 850 °C for the austenitic steel and 800 °C for the ferritic steel. Meanwhile, the ductility is better at the other test temperatures.
As shown in Table I, the complex diffusion activation energy in the austenitic steel is higher than that in the ferritic steel. In other words, the P–vacancy complex diffusivity in the austenitic steel is slower than that in the ferritic steel at the same temperature, which has been confirmed in the above paragraph. As described in Sec. III. A. 1, the critical time increases with decreasing aging temperature (see Fig. 7). Therefore, it can be inferred that the ductility trough temperature of the austenitic steel would be higher than that of the ferritic steel with the same cooling rate, which is consistent with the experiment results in Figs. 2 and 4.
C. The ITE of the testing steels induced by SNGS
In Ref. 11, the TNGS and SNGS have a unified critical time equation with the same critical time phenomenon. As shown in Tables II and III, the austenitic steel is in the segregation phase whereas the ferritic steel is in the desegregation phase for the same hot history.
As is well known, decreasing strain rate would increase the elastic stress aging time. For the austenitic steel which is in the segregation phase, the segregation of impurity increases with decreasing strain rate, thereby causing the ductility to deteriorate as shown in Fig. 2. However, for the ferritic steel which is in the desegregation phase, the segregation of impurity decreases with decreasing strain rate, thereby improving the ductility as shown in Fig. 4.
As just mentioned, the SNGS during tensile test is only to change the degree of hot ductility loss. That is the reason why increasing strain rate did not move the ductility trough at a higher temperature.
IV. CONCLUSIONS
The hot ductility deterioration in two kinds of stainless steels is mainly induced by the TNGS of phosphorus. The calculated results along with the experimental evidence for the proposed mechanism are discussed, which confirm the following viewpoints:
(1) According to the calculation results, the temperature at which the effective time is closest to the critical time is 850 °C for the austenitic steel whereas 800 °C for the ferritic steel. The critical cooling rate also confirms this phenomenon. As a result, the ductility trough is induced by the TNGS of phosphorus.
(2) The SNGS during tensile test is only to change the degree of hot ductility loss. For the austenitic steel, decreasing strain rate increases the elastic stress aging time, which increases the segregation of impurity and thus induces the ductility to deteriorate with decreasing strain rate. For the ferritic steel, decreasing strain rate increases the elastic stress aging time, which decreases the segregation of impurity and thus induces the ductility to improve with decreasing strain rate.
ACKNOWLEDGMENT
The work was supported by the National Nature Science Foundation of China (Grant No. 51171050).