1. INTRODUCTION
The central decades of the 19th century, which include the modernisation of the country, were a crucial period in Spanish economic history. After the end of the Napoleonic Wars, Spain experienced intense social and political liberal reforms, influenced by the liberal revolutions in Europe, that produced profound changes in its institutions. The financial system was modernised with the creation of the Code of Commerce, the Bank of San Fernando and the stock market in Madrid (Artola Reference Artola1983, p. 307; Tedde Reference Tedde1994). Legislation regulating intellectual property rights was introduced in 1826 producing a rise in patents that was especially high between 1843 and 1864 (Sáiz González Reference Saiz González1996, p. 14). Burdens on economic incentives were eliminated; the tithe was abolished in 1837 and internal trade for primary products was liberalised in 1834 (Artola Reference Artola1983, p. 297). At the same time, the restrictions on participation in industrial activities enforced by the guilds were finally lifted in the mid-1830s (R.D. 20th January 1834 and 6th December 1836).
The economic changes were equally important, and the Spanish economy was able to reach growth rates that had not been seen before in its history. The transformations reached every corner of the economy and produced a rapid improvement in wages, agricultural productivity, and even in the terms of trade with economic powerhouses such as Britain (Prados de la Escosura Reference Prados de la Escosura1994; Alvarez-Nogal and Prados de la Escosura Reference Álvarez-Nogal and Prados de la Escosura2013). This take-off of the economy continued during the second half of the 19th century with growth levels that would not be achieved again until the roaring twenties. Between 1850 and 1883, Spain grew more quickly than Germany and France, and as fast as Britain. The economy suffered a deep transformation with the rapid growth of the industrial sector that by 1870 represented 20 per cent of total production (Prados de la Escosura Reference Prados de la Escosura2017). The construction of the railroad and telegraph networks were the final push and made the creation of an integrated national market possible for the first time in Spanish history (Peña and Sánchez-Albornoz Reference Peña and Sánchez-Albornoz1984).
However, the knowledge that we have of this crucial period of Spanish economic history is far from perfect, especially that related to the measurement of key aspects such as economic inequality or socio-economic mobility. The work on inequality in Spain before the end of the 19th century is very scarce. Alvarez-Nogal and Prados de la Escosura (Reference Álvarez-Nogal and Prados de la Escosura2013) estimated the levels of economic inequality in Spain using information related to wages and land rents. Rosés et al. (Reference Rosés, Martínez-Galarraga and Tirado2010) used information at the provincial level to calculate the changes in regional inequality between 1860 and 1900, while Beltrán Tapia and Martínez-Galarraga (Reference Beltrán Tapia and Martínez-Galarraga2015) computed provincial estimations of inequality using the Williamson Index for 1860 and 1900. These studies seem to conclude that there was an upswing of inequality in Spain as from the 1860s that continued at least until 1900. The rise in inequality found in late 19th-century Spain appears to be the continuation of a process that started centuries earlier, when long-term inequality trends show, as in the rest of Europe, a general and monotonic growth with very high levels already found in the 18th centuryFootnote 1.
Studies of pre-industrial intergenerational mobility are limited by the scarce information available. In the international literature, a significant number of estimates of the levels of intergenerational social mobility in the 19th century are available. To mention a few, Miles (Reference Miles1999) and Mitch (Reference Mitch, Miles and Vincent1993) used marriage records to study the mobility between generations in Britain, finding relatively low mobility as around two-thirds of the grooms had the same occupational status as their fathers. Their results, and particularly their source, were criticised by Long (Reference Long2013) and Long and Ferrie (Reference Long and Ferrie2013), who saw it as unrepresentative as they only recorded only Anglican marriages and their data had not been adjusted by the life cycle. Their results found surprisingly high levels of mobility in Britain and particularly in the United States during the second half of the 19th century. Similar studies were carried out using transition matrices in France (Bourdieu et al. Reference Bourdieu, Ferrie and Kesztenbaum2009), Sweden (Maas and van Leeuwen Reference Maas and Van Leeuwen2002; Dribe et al. Reference Dribe, Helgertz and Van De Putte2015) or Belgium (van Bavel et al. Reference Van Bavel, Moreels, Van De Putte and Matthijs2011). Boberg-Fazlic and Sharp (Reference Boberg-Fazlic and Sharp2013) found relative stability of social mobility in England but also regional differences with higher levels in the north than in the south, while Clark and Cummins (Reference Clark and Cummins2014) showed that wealth was persistent in England not only between relatively close generations, but also in the very long term. However, the amount of evidence for preindustrial Spain is far more limited; we can highlight the work by Pujadas-Mora et al. (Reference Pujadas-Mora, Brea-Martínez, Jordà Sánchez and Cabré2018) that focused on the 16th and 17th centuries, or the work by Ros Navarro (Reference Ros Navarro2004) in the town of Mataró. In a recent paper, Espín-Sánchez et al. (Reference Espín-Sánchez, Gil-Guirado and Vickers2020) analysed the transmission of status between different generations in Murcia (a neighbouring region of Valencia) in the 18th century, showing a persistence that could be linked over at least three generations. This paper will attempt to fill in this gap in the literature using as a case study the region of Valencia, in an exercise that, using comparable methodologies and sources, would allow us to put the Spanish case in the international context in the age of industrialisation.
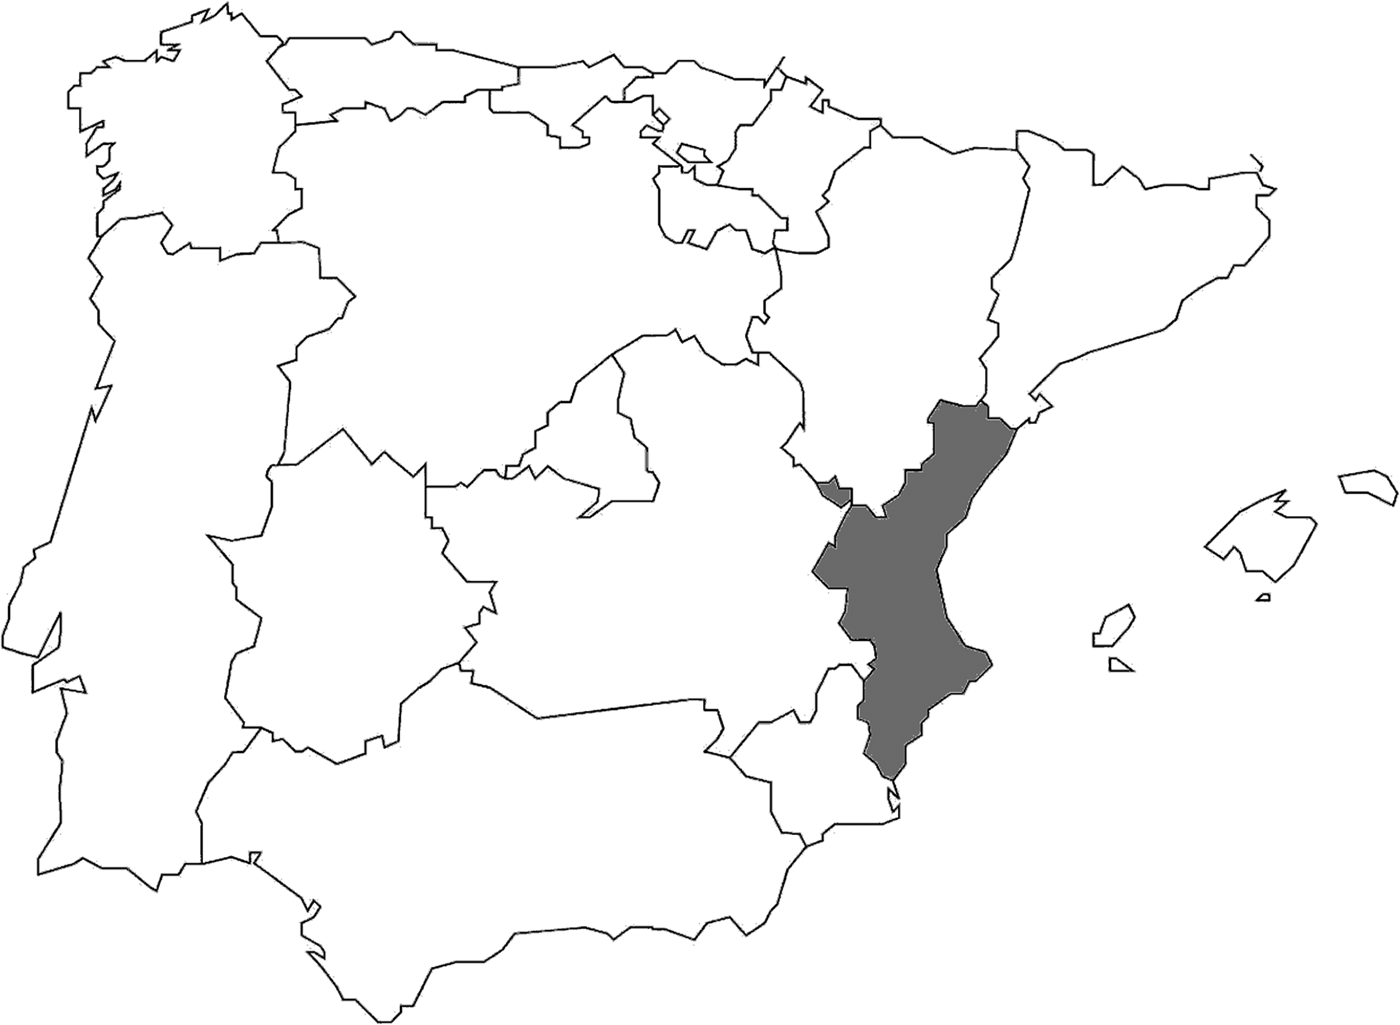
Valencia was one of the main regions of Spain and by 1860 represented 8 per cent of the Spanish population and 8.4 per cent of its GDPFootnote 2 (See Figure 1). Like the rest of the country, Valencia also experienced an important economic transformation during the 19th century that cannot be understood without the changes that also took place within its own society. In the cities, the economic interests of the elites changed from trade and silk production in the late 18th century to commercial agriculture in the mid-19th century. The diversion of capital from manufacturing and services to agriculture was encouraged by the opportunities provided by the sale of confiscated lands in the 19th century (Furió Reference Furió1995, p.486). The process also implied a change in the composition of the ruling elite of the region where, after the abolition of seigniorial rights, the higher nobility lost influence in favour of a rising class of agrarian capitalists (Calatayud Giner Reference Calatayud Giner, Millán and Romero Mateo1992, p. 127). Manufacturing in the region was mainly concentrated in textiles, especially in production related to silk. The attempts to modernise the production of silk textiles in the mid-19th century failed, especially after the crisis that the industry suffered in 1854. The creation of new financial institutions in the city of Valencia related with transport also suffered a severe setback after the financial crisis of 1866, reinforcing the diversion of resources to a primary sector increasingly connected with international markets (Palafox Reference Palafox1984, p. 300). At the same time, the economic position of the poorest social classes worsened, making the creation of institutions to provide shelter and food for the poor necessary, while their working conditions also deteriorated (Furió Reference Furió1995, p. 494).
GEOGRAPHICAL LOCATION OF VALENCIA.

In rural areas, the primary sector had been involved in a transformation process since the late 18th century, characterised by an extension of irrigated lands. The social changes experienced in the cities were reflected in the countryside, although the effect was less homogeneous. While the increasing accumulation of land in the hands of urban elites was clear, there were also cases where smaller farmers were able to increase their properties (Palafox Reference Palafox1984, p. 300; Furió Reference Furió1995, p. 497). According to Furió, the years between 1840 and 1875 mark the final triumph of agrarian capitalism in Valencia, with the creation of an efficient primary sector oriented to trade (Furió Reference Furió1995, p. 475). Therefore, the dualism of the rural economy of Valencia comprised a rising capitalist class connected to international markets and traditional producers who suffered increasing difficulties that led to peasant revolts, banditry and migrations. The main consequence of these social and economic changes was an unequal growth model that became characteristic of the Valencian economy of the 19th and 20th centuries (Palafox Reference Palafox1984, pp. 298-302).
After this introduction, section two of the paper presents the first civil registry created in Spain as the main source of our study and the information that we extracted from it. We later describe in section three the different methodologies used to estimate the levels of occupational mobility. Section four presents the results obtained from each method; these results are then discussed in section five. The paper finishes with a summary of the main conclusions.
2. SOURCE AND DATA
The need to understand the changes in population was seen as an important objective by the governments that followed the end of the Napoleonic Wars. Few attempts had been made before this apart from isolated population recounts carried out mainly for fiscal purposesFootnote 3. Therefore, the only consistent and long-term estimates that existed previously were in the hands of the church, which systematically recorded the numbers of baptisms, marriages and burials. This situation was seen as untenable by many liberal politicians who saw a weakness in this reliance and pushed for the creation of the first registries controlled by civil authorities. There was a first attempt in the Decree of the 3rd of February 1823 (Decreto de XLV de 3 de febrero para el gobierno económico-político de las provincias, 1823) where the government attempted to create a civil registry of births, marriages and deaths controlled by local authorities, who were also in charge of its custody. This attempt was a failure, and with very few exceptions, including the city of Madrid, it was never implemented. The main problem was that the government did not provide the resources to maintain the registry, and many very small municipalities did not have the capacity to cover its cost.
In 1841, the government tried again, this time learning from the mistakes of the earlier attempt. The Decree of the 24th of January (Decreto de 24 de enero, 1841) laid the foundations for the new registry, and after complaining about the lack of success of its predecessor, it limited the establishment of the new registry to those municipalities that were provincial capitals, heads of a judiciary district, or had more than 500 families or roughly 2,000 inhabitants. These requirements were imposed to guarantee that the municipalities were large enough to guarantee that they would be able to cover the cost of creating and maintaining the registry. The idea that national authorities had in mind was to use this sample as the foundation of a registry that would later be extended to the rest of the country. Important steps were also taken to guarantee the reliability of the records included in the registry. Special orders were given to the church forbidding priests to baptise or bury any individual without the approval of the registry, while all marriages also had to be communicated to the registry within 24 hours of taking place. The instructions also included punishments for those who did not comply with the rules, with penalties proportional to the transgression for officials of the registry and fines for the priests in line with the non-compliance (Decreto de 24 de enero para la creación de un registro civil. Art. 7, 1841).
Therefore, the new instructions tried to avoid the financial constraints that made the implementation of the first registry impossible, and at the same time provided the incentives so those agents involved in its creation complied with the rules. Research that compares the records maintained by the registry with those kept by the church shows that the system worked, and that there was a proper transfer of records from ecclesiastical to civil authorities (Valero Escandell Reference Valero Escandell1986, p. 94). The instructions were also very clear regarding the way in which all the information had to be recorded, following the template of the civil registry successfully created in Madrid years earlier. This was important for our research, as the collection of standardised documents in most of the country made a systematic collection, processing and analysis of all the records possible.
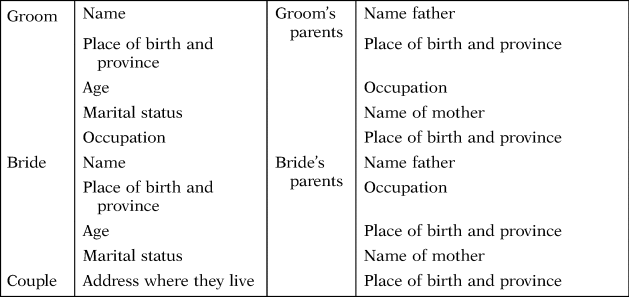
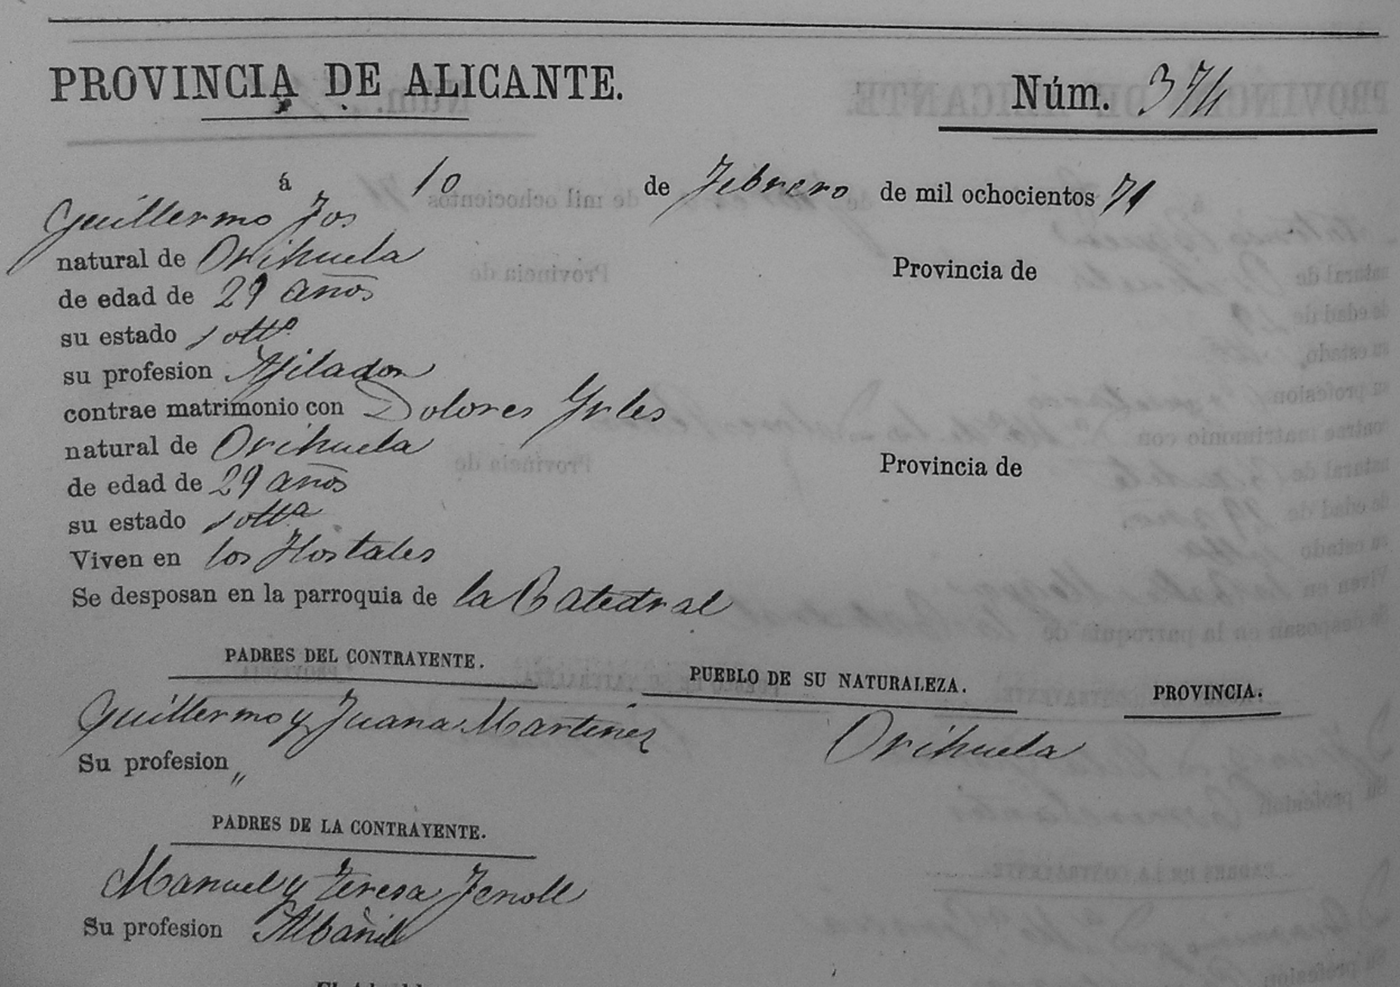
However, this first successful civil registry came to an end in 1870 when the government decided to create a new one with the provisional law 2/1870 on 17th June. This time the new civil registry would be controlled not by local civil authorities, but by the courts of justice, and was extended to all municipalities in the country without any minimum population requirements. The new registry was the logical follow-up to the liberal reforms of 1869 which decreed freedom of religion and abolished the requirement of having to register births, marriages and deaths in church records. The consequences were disastrous for the 1841 registry; it was completely abandoned and also neglected, not being transferred to the courts of justice and kept in the archives of the local councils. Although many of these records were destroyed in events such as the Spanish Civil War, some of them survived and provide a unique and underexploited source with key information for a little-known period in Spanish economic history. In our case, we focus our analysis on the study of the marriage records kept by the 1841 civil registry. These records are very rich in content and include information related to the socio-economic status of two generations which can be used to estimate the levels of intergenerational mobility; this information did not appear in the new registry which makes it impossible to extend our analysis beyond 1870. Table 1 shows an example of the information contained in the templates used throughout the country, and Figure A1 in the online Appendix presents a real example of a marriage record.
INFORMATION RECORDED IN MARRIAGE RECORDS

The record included key information about the couple but also about their parents, the most important field for our study being the profession of the groom and his father. The connection between the status of the father and the son reflected by their occupations will be the basis of our study of intergenerational mobility. We also collected the occupation of the groom's father-in-law, the ages of the couple, the province where they were born and the provinces of origin of their parents. As we will see in the following pages, part of this information will be important to calibrate our results and will provide relevant insights explaining the dynamics of our estimations.
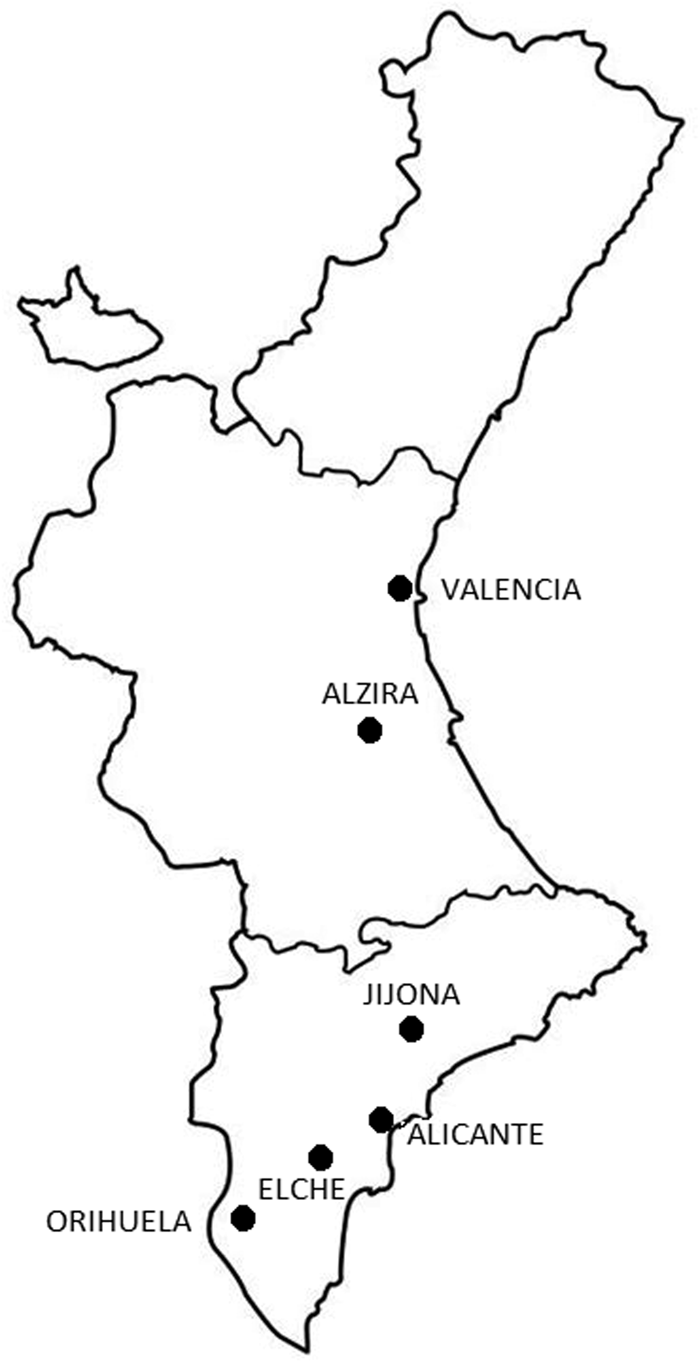
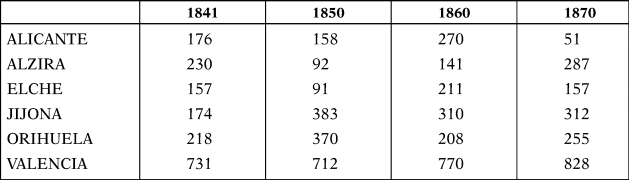
After a survey of the archives in Valencia, we were able to find information for six locations presented in Figure 2, including the capital of the region that also became the third largest city of Spain during the period under analysis. Our sample also includes medium-sized cities with a clear urban character such as Alicante, large, mainly rural, municipalities but also having a significant urban economy, large municipalities whose economies were clearly rural and also smaller rural locations. Although our sample is geographically biased towards the provinces of Alicante and Valencia, our interest in the urban/rural character to calibrate a regional sample does not affect its creation. From municipal archives and online sources, we were able to gather around 7,300 marriage records with information for over 40,000 individuals around four benchmark years; 1841, 1850, 1860 and 1870. Given the over-representation of large urban centres such as Valencia or Alicante, we used proxies of the urban/rural character of the municipalities to estimate a more representative regional sample of the whole region. In the final regional sample, estimated from the original records collected, the weight of rural areas increased to take into account the fact that they contained most of the population. We used information from population censuses to check the representativeness of the regional sample; the comparison suggests that the sample represents the sectorial structure of the Valencian economy and its occupational structure quite wellFootnote 4.
SAMPLE OF MUNICIPALITIES.

3. METHODOLOGY
The measurement of intergenerational mobility is usually addressed by analysing the extent to which the socio-economic status of parents is directly transferred to their children. In order to do so, researchers have focused on different estimates whose choice is heavily influenced by the sources and information at their disposal. The most common indicator used to estimate intergenerational mobility is income, although recent studies pointed out the problems that its use creates when accounting for social improvement (Reference PolaviejaPolavieja forthcoming). However, given the lack of reliable long-term microeconomic evidence on income, studies with a historical perspective usually had to rely on alternative proxies. In our case and like other studies before, we make use of marriage records. They provide information about the occupations of the groom, his father and his father-in-law that we use as proxies of socio-economic status. There are, however, some limitations derived from the use of occupations in the measurement of intergenerational mobility that we must acknowledge. One of them originates from the impossibility to take into account the differences within each occupation, as all individuals with the same occupation are considered equal, creating potential biases in the estimation of social mobility. A second problem derives from the requirement to transform these occupations into comparable units, so the mobility between the two generations can be estimated.
The choice of an appropriate methodology also depends on the kind of mobility that is being measured; a distinction can be made between absolute and relative mobility. Absolute mobility implies that the second generation changes its status with respect to their parents in absolute terms, while relative mobility implies that it changes relative to the rest of the distribution. Although both can move in the same direction, this does not have to be the case. Taking income as an example, if all the members of the second generation double their income with respect to their parents, all their members experienced absolute upward mobility as their income has improved in absolute terms (doubled) with respect to the previous generation. Relative mobility on the other hand did not experience changes, as the relative position of each individual of the second generation in the income distribution has not changed with respect to that occupied by their fathers. Absolute mobility can be closely associated with the modernisation of an economy, as new job opportunities in highly-skilled occupations could offer new possibilities to climb up the social ladder for those raised in poorer families. However, as Dribe et al. (Reference Dribe, Helgertz and Van De Putte2015) show, the relationship between social mobility and industrialisation does not have to be linear. Downward mobility can increase during the first stages of industrialisation, while upward mobility could be more common when the industrial economy has matured. For example, traditional middle-class occupations, such as artisans, and job opportunities in the rural economy could be negatively affected by the modernisation of the economy in the short term. On the other hand, the positive effects related to the creation of new highly-skilled occupations associated with a mature industrial economy take time to materialise (Dribe et al. Reference Dribe, Helgertz and Van De Putte2015, p. 27). This paper includes measures of both absolute and relative intergenerational mobility. In terms of relative mobility, we estimate intergenerational elasticities, intergenerational rank associations (IRAs) and the probabilities that individuals raised by families in the lowest quartile of the distribution have to fall in the upper quartiles themselves. To measure absolute mobility, we make use of transition matrices after dividing all individuals into five occupational classesFootnote 5.
3.1 Intergenerational Elasticity
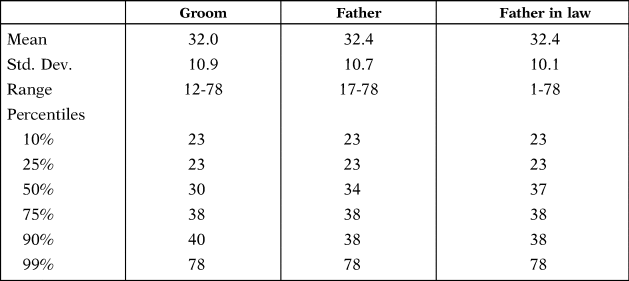
Intergenerational elasticity is the most common measure used by the literature in the analysis of relative mobility. However, in order to estimate elasticities, we need to transform the qualitative information provided by the occupations into a quantitative and continuous variable. Following research in other countries, we decided to use a version of the Standard International Occupational Prestige Scale (SIOPS) established by Treiman (Reference Treiman1977), updated in Ganzeboom and Treiman (Reference Ganzeboom and Treiman1996)Footnote 6. The scores assigned in the index are considered by the literature as time invariant and internationally comparable (Hout and DiPrete Reference Hout and DiPrete2006, p. 2). The SIOPS scale has been used by researchers to justify the validity of other similar historical indexes, such as HISCAM, which has a very high correlation with it (Lambert et al. Reference Lambert, Zijdeman, Van Leeuwen, Maas and Prandy2013, p. 86). As a robustness check, we also codified all occupations into HISCAM and repeated the same estimations. The conversion of 19th-century occupations, which in some cases were quite specific for Spain, is not a straightforward process. In many cases, we were able to find the exact equivalent to the occupation in our sample in the SIOPS scale, but this was not always the case. As a general rule, when we did not find an exact match, we used the most approximate occupation that we could find in the SIOPS scale. For example, an esterero (mat maker) was assigned to the group «Basketry weavers, brush makers, etc. workers. Incl. Broom Maker» in the scale, or a tratante (dealer) was assigned to the group «Small Enterprise: Businessman, Trader, Manager». In addition to this matching process through similarity, we also had to deal with problems at both extremes of the distribution. At the top, we had to assign scores to occupations that belonged to the most privileged classes like the aristocracy or prestige titles like hacendados or proprietors which did not have an exact equivalent in the SIOPS scale. In this case, we assigned them the highest score (78), which is the same as assigned to occupations such as liberal professionals. We also tried assigning them a higher value (80) and the results were robust, mainly given their small number in the sample and the relative similarity with the previous assigned score. At the bottom part of the distribution, we had a very small number of cases where occupations such as «blind poor» were recorded. In these cases, we assigned them the lowest values found in the scale (12), which corresponds to the group Street Services Elementary Occupations. Incl. Billposter, Shoeshiner, Car Window Washer Footnote 7. Table 2 presents the main descriptive statistics of the scores assigned to grooms, their fathers and their fathers-in-law.
DESCRIPTIVE STATISTICS OF SIOPS SCORES

Source: Marriage records.
After codifying all the occupations into SIOPS, we can estimate the intergenerational elasticity using a linear regression model like the one presented in equation [1], where  ${\rm SIOPS}_{it}^S $ represents the SIOPS score of the son i in year t and
 ${\rm SIOPS}_{it}^F $ the SIOPS score of his father in the same year.
 $${\rm ln}( {{\rm SIOPS}_{it}^S } ) = \alpha + \beta _1\ln ( {{\rm SIOPS}_{it}^F } ) + \varepsilon _{it}$$
The value of β 1 would capture the persistence, taking value 0 in the case of absolute mobility and 1 in the complete absence of it. A β of 0.4 would indicate that 40 per cent of the SIOPS score of the fathers is directly transferred to the next generation. The model can be improved to take into account life cycles, or in other words, the possibility that sons have of improving their status during their lives. As explained above, using marriage records usually compares sons at an early age leading to a potential underestimation of mobility. For that reason, to take into account the potential life cycle bias, we can also include age (AGE) and son's age squared (AGE2) in the regression as controls as shown in equation [2].
 $${\rm ln}( {{\rm SIOPS}_{it}^S } ) = \alpha + \beta _1\ln ( {{\rm SIOPS}_{it}^F } ) + \beta _2{\rm AGE}_{it}^S + \beta _3{\rm AG}{\rm E}^2_{it}^S + \varepsilon _{it}\;$$
3.2 Intergenerational Rank Association
An alternative estimation of relative mobility used by Chetty et al. (Reference Chetty, Hendren, Kilne and Saez2014) as proposed by Dahl and DeLeire (Reference Dahl and DeLeire2008) consists of estimating the correlations between the ranking that sons and fathers occupy in the distribution. Following the specification suggested by Dahl and DeLeire (Reference Dahl and DeLeire2008), the IRA is estimated to regressing the son's percentile in the SIOPS distribution on the percentile of the SIOPS distribution occupied by their fathers following equation [3].
 $$P_{it}^S = \alpha + \beta _1P_{it}^F + \beta _2{\rm AGE}_{it}^S + \beta _3{\rm AG}{\rm E}^2_{it}^S + \varepsilon _{it}$$
where  $P_{it}^S $ is the percentile in their SIOPS scores distribution of son i in year t,
 $P_{it}^F $ is the corresponding value for his father or his father-in-law and AGE and AGE2 the groom's age and its square. As in the case of intergenerational elasticities, the value of β 1 would capture the persistence.
3.3 Movements Between Quartiles
To obtain a better understanding of the changes in intergenerational elasticities or IRAs, we add a new estimate of relative mobility. We used the information from the previous estimations to calculate the probability that a son raised by a family in the bottom quartile of the SIOPS distribution has to be found in the different quartiles of his SIOPS distributionFootnote 8. These probabilities will offer us information regarding the percentage of sons who were able to escape from the lowest part of the distribution and the change of this upward mobility over time. We estimate the probabilities through a multinomial logistic regression using the following equation:
 $$Q_{it}^S = \alpha + \beta Q_{it}^F + \beta _2{\rm AGE}_{it}^S + \beta _3{\rm AG}{\rm E}^2_{it}^S + \varepsilon _{it}$$
where  $Q_{it}^S $ represents the quartile in the SIOPS distribution of the son i in year t,
 $Q_{it}^F $ the quartile of his father in the same year, and AGE and AGE2 the age and the age squared of the son, respectively, to control for the life cycle. From the model, we estimated the predicted probabilities that sons raised by fathers belonging to the lowest quartile had to fall in each one of the quartiles of his SIOPS distributionFootnote 9.
3.4 Transition Matrices
The use of intergenerational elasticities or rank–rank correlations has several methodological limitations. The first is that by construction they impose a linear relationship between the statuses of both generations. The second is that although they provide a value of persistence that is easily comparable with other estimates, they do not provide information regarding the origin of this persistence or the sources of its changes. Therefore, improving mobility obtained from decreasing intergenerational elasticities or IRAs may be the consequence of undesirable effects such as increasing downward mobility (Chetty et al. Reference Chetty, Hendren, Kilne and Saez2014, p. 7).
Transition matrices offer a non-parametric alternative to measure mobility not restricted to linear relationships and can offer not only an estimation of persistence, but also of upward and downward mobility. In transition matrices, sons and fathers are clustered into different groups according to variables such as income, wealth or socio-economic status, ordered from higher to lower values. Although descriptive in their nature, transition matrices have been widely used as they offer a detailed examination of the stratification of a society that cannot be directly observed by other methods, such as identifying the movements that are taking place and explaining changes in mobility levels (Hauser Reference Hauser1978). On the other hand, the use of transition matrices also has its own weaknesses, including the fact that the matrices are truncated at both ends leading to a potential underestimation of the mobility consequences of ceiling and floor effects (Moonen and Van den Brakel Reference Moonen and Van Den Brakel2011).
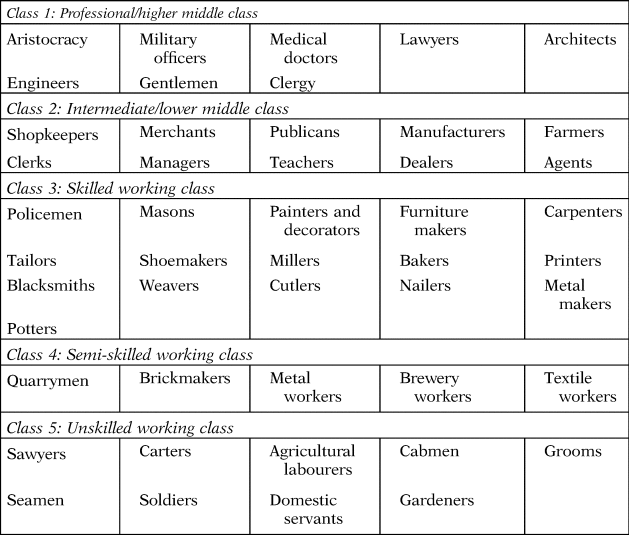
Transition matrices can be estimated in different ways, such as using percentiles of incomes, estimations of wealth or a division into social or occupational classesFootnote 10. However, given the nature of our source and the information it provides, we had to rely on the use of occupational classes, one of the most common methods used in the literature and that would also allow us to compare our results with similar studies in other countries. Therefore, our study would focus on occupational mobility, an important part of social mobility which also has its own limitations, as previously mentioned. The main one would be the underestimation of the real mobility consequence of considering all individuals from the same class as equals. Defining the classes and the occupations that each one of them contains is a key decision that could also affect the results. In our case, we decided to follow a categorisation similar to Miles (Reference Miles1992) and Long (Reference Long2013); this will also allow us to compare our estimations with results of similar studies in other countries in the same period of time. The classification is based on the methodology followed by the Registrar General's occupational and social classification scheme for the 1951 census in Britain which divided occupations into five classes. As a robustness check, we also used the five-class version of HISCLASS (Van Leeuwen and Maas Reference Van Leeuwen and Maas2011), a different method to codify occupations. The five classes identified and some examples of the occupations included are presented in Table 3Footnote 11.
EXAMPLES OF OCCUPATIONS BY CLASS

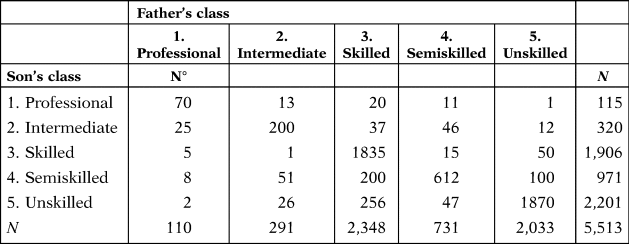
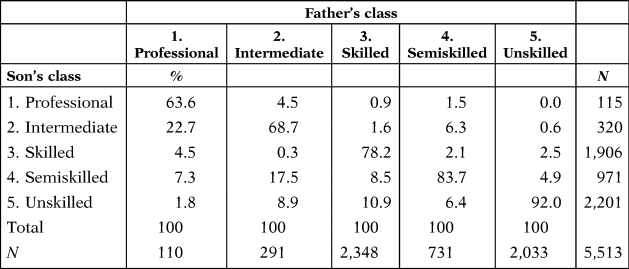
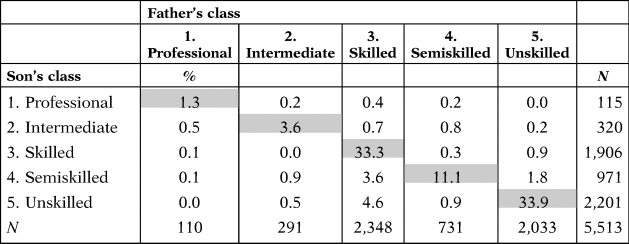
The classification assumes that those occupations included in group 1 represent the top occupational class, following a descending order where group 5 represents the bottom. Therefore, we can position all sons in a matrix depending on the class of their fathers and their own as shown in Table 4. The matrix shows the number of sons that fall in each cell. For example, of the 5,513 sons included in the example, seventy of them came from a family in class 1 and fell themselves in class 1 too. From this matrix, we can estimate Table 5, where the matrix is transformed so it shows the probability that sons raised in each class have of falling in each one of the classes themselves. In the example given, 92.0 per cent of all the sons who were raised by families belonging to class 5 ended up in class 5. This is the way in which transition matrices are usually presented, showing the movements of sons between their class of origin and the one they achieve. Finally, dividing the values of the cells from Table 4 by the total number of sons in the sample (5,513), we can estimate the percentage of ALL sons who fall in each one of the cells as presented in Table 6. In this example, 33.9 per cent of all the sons in the sample had a father from class 5 and fell themselves in that same class. From Table 6 we can estimate the levels of persistence (or lack of mobility), calculated as the sum of all the percentages that fall within the main diagonal highlighted in grey, presenting the percentage of all sons in the sample who fall in the same class as their fathers. In the same way, the sum of the percentages of all the cells above the main diagonal represents the level of upward mobility, or sons who achieve a higher class than their fathers, while the sum of the cells behind the main diagonal represents total downward mobility.
EXAMPLE OF TRANSITION MATRIX (NUMBER OF OBSERVATIONS)

EXAMPLE OF TRANSITION MATRIX

EXAMPLE OF TOTAL TRANSMISSION MATRIX

We repeated most of the estimations presented above substituting the information for the father with the information for the father-in-law. Although it is not the main objective of this paper, our data allow us to check the potential existence of social networks in the marriage market that we could identify by detecting correlations between the status of the groom and his father-in-law.
4. RESULTS
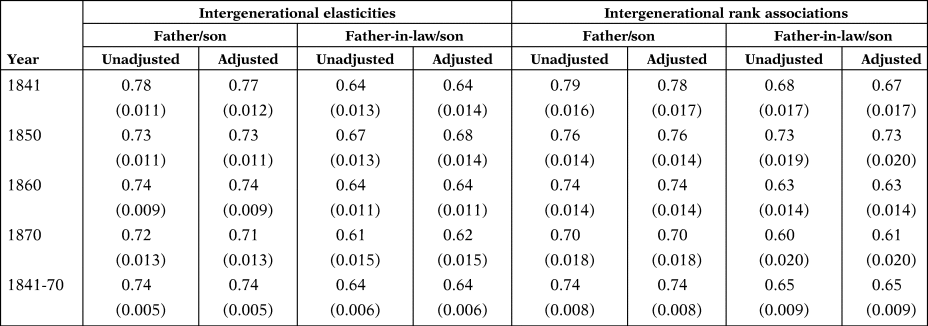
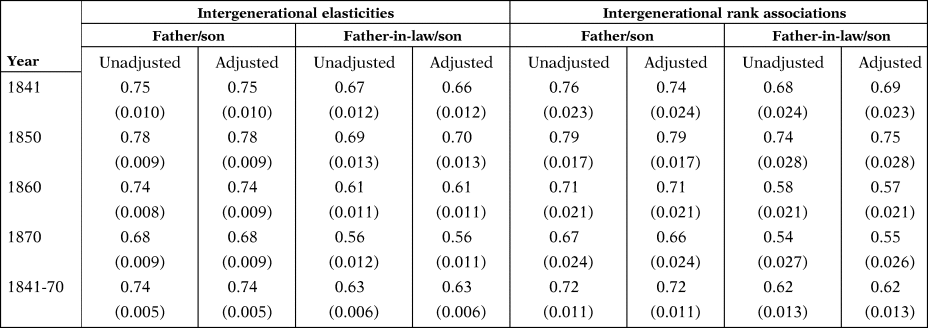
After the creation of a representative sample for the whole region from our sample as described earlier, we proceeded to estimate the measures of relative mobility. Table 7 presents the intergenerational elasticities and the IRAs between the son and his father and father-in-law as defined in section 3. The table includes both estimates adjusted and unadjusted by the life cycle as defined in equations [1]-[3].
INTERGENERATIONAL ELASTICITIES AND INTERGENERATIONAL RANK ASSOCIATION (IRA) 1841-1870

The most striking result is the high level of persistence, with age-adjusted intergenerational elasticities ranging between 0.71 and 0.77 and an average of 0.74 for all the period. Therefore, for every 10 per cent increase in the SIOPS score of the father, the score of the son increased by an average of 7.4 per cent between 1841 and 1870. We find similar levels of persistence using IRAs, where the intercept estimated in the model reveals similar levels. We also find that although lower than with the father, there was also a high correlation between the scores of the sons and their fathers-in-law, suggesting a strong presence of social homogamy. In terms of trends, the highest persistence levels are reached at the beginning of the period with a small reduction between 1841 and 1870. We also observe that the estimations after adjusting by grooms' ages were practically the same. The results using HISCAM are reported in Table A3 in the online Appendix, and show very similar values to those estimated with SIOPS, with a very high intergenerational elasticity which, when age-adjusted, ranged between 0.68 and 0.78 with an average of 0.74 for the whole period, showing a general decrease from the first decades. The values of IRAs were also very high, ranging between 0.66 and 0.79 with an average of 0.72 for the whole period with higher values in the first decades.
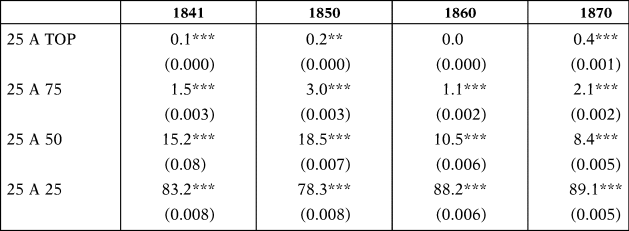
However, and as already explained, the problem with the use of elasticities or IRAs is that, as the analysis of the main diagonal in a transition matrix, they simply tell us whether there is an increasing or decreasing correlation between the status of father and son, but not whether the higher (or lower) correlation is the consequence of changes in upward or downward mobility. An alternative derived from the previous calculations is the estimation of the predicted probabilities that sons raised in families at the bottom of the distribution had of climbing the occupational ladder. Table 8 presents the predicted probabilities that a son raised in the lowest quartile of the distribution had of ending up in each one of the four quartiles when he married, estimated from equation [4]Footnote 12. The results show that between 1841 and 1850, the probability of sons raised in the lowest quartile remaining in it decreased by 5 per cent, with most of those improving moving to the third quartile, and the probabilities of falling in the first and second quartiles also increasing. However, by 1860 the situation had reversed and worsened even more by 1870, when more than 89 per cent of those born in the lowest quartile remained at the bottom of the distribution. Therefore, from the analysis of relative mobility measures, we can conclude that persistence levels were very high in Valencia between 1841 and 1870, and that the small increase in mobility that took place over time had a very different effect on the bottom part of the distribution depending on the benchmark analysed.
PREDICTED PROBABILITIES OF SONS RAISED IN THE LOWEST QUARTILE

Note: Probabilities that a son whose father's SIOPS was in the bottom quartile of the distribution had to fall in the four different quartiles, estimated from equation [4] using the Stata command margins. ∗, ∗∗, and ∗∗∗ denote significance at 10, 5, and 1 percent levels, respectively.
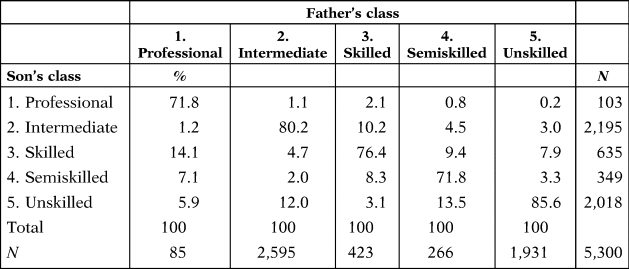
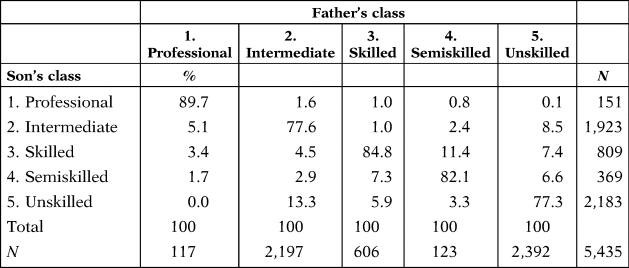
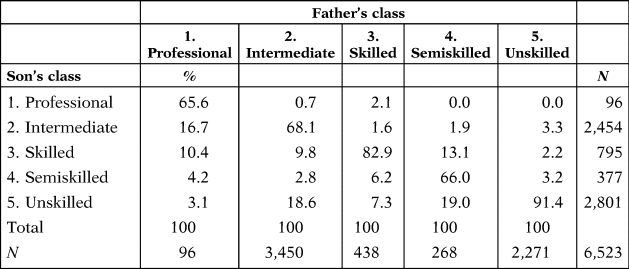
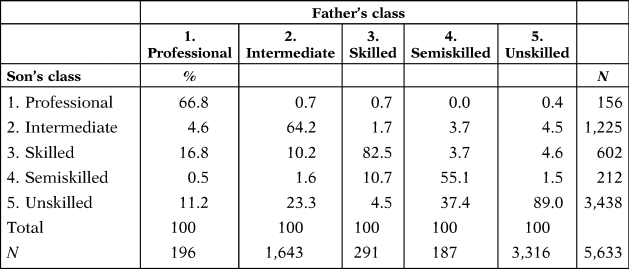
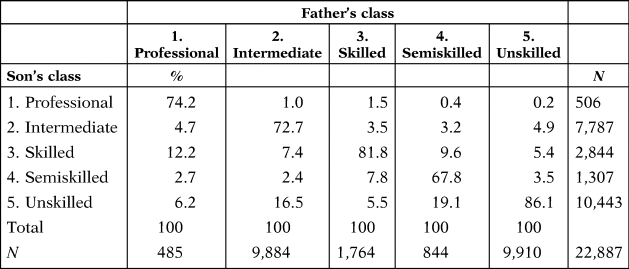
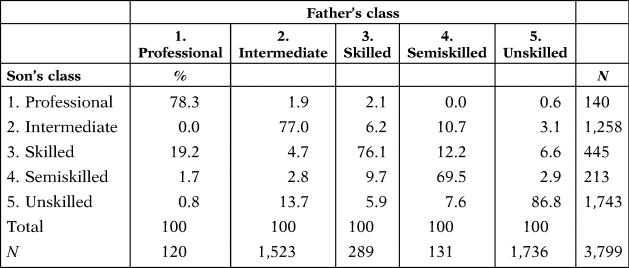
The use of transition matrices would offer us a better idea of the movements between occupations taking place between 1841 and 1870. Tables 9–12 present the transition matrices in their traditional specification as described in Table 5, showing the probabilities that sons raised in each class had of falling in each one of five classes when they married. We observe that although they change over time, the average levels of persistence within each class of origin (observations that fall within the main diagonal) are again very high, particularly for those sons coming from a humble occupational background (Class 5: Unskilled) with high persistence levels also found in general in the other four classes.
TRANSITION MATRIX FOR VALENCIA, 1841

Sources: Civil registry as indicated in the online Appendix.
TRANSITION MATRIX FOR VALENCIA, 1850

Sources: Civil registry as indicated in the online Appendix.
TRANSITION MATRIX FOR VALENCIA, 1860

Sources: Civil registry as indicated in the online Appendix.
TRANSITION MATRIX FOR VALENCIA, 1870

Sources: Civil registry as indicated in the online Appendix.
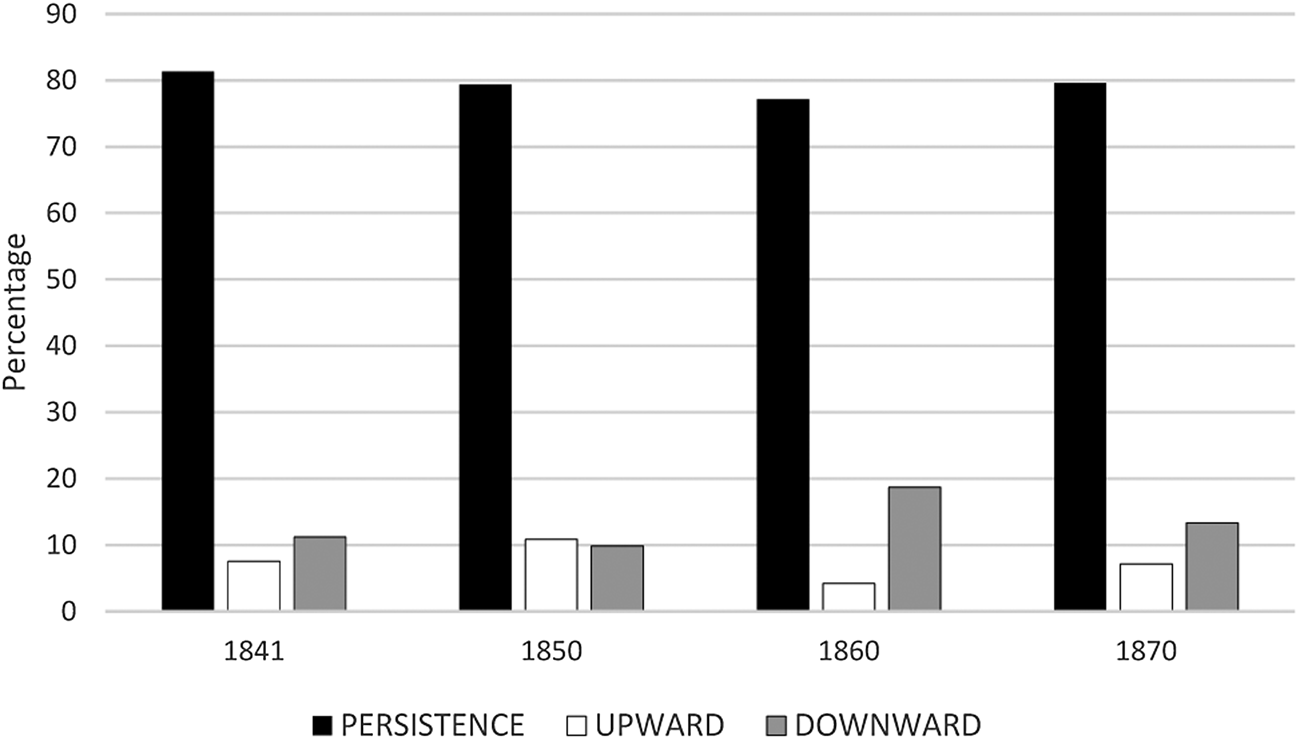
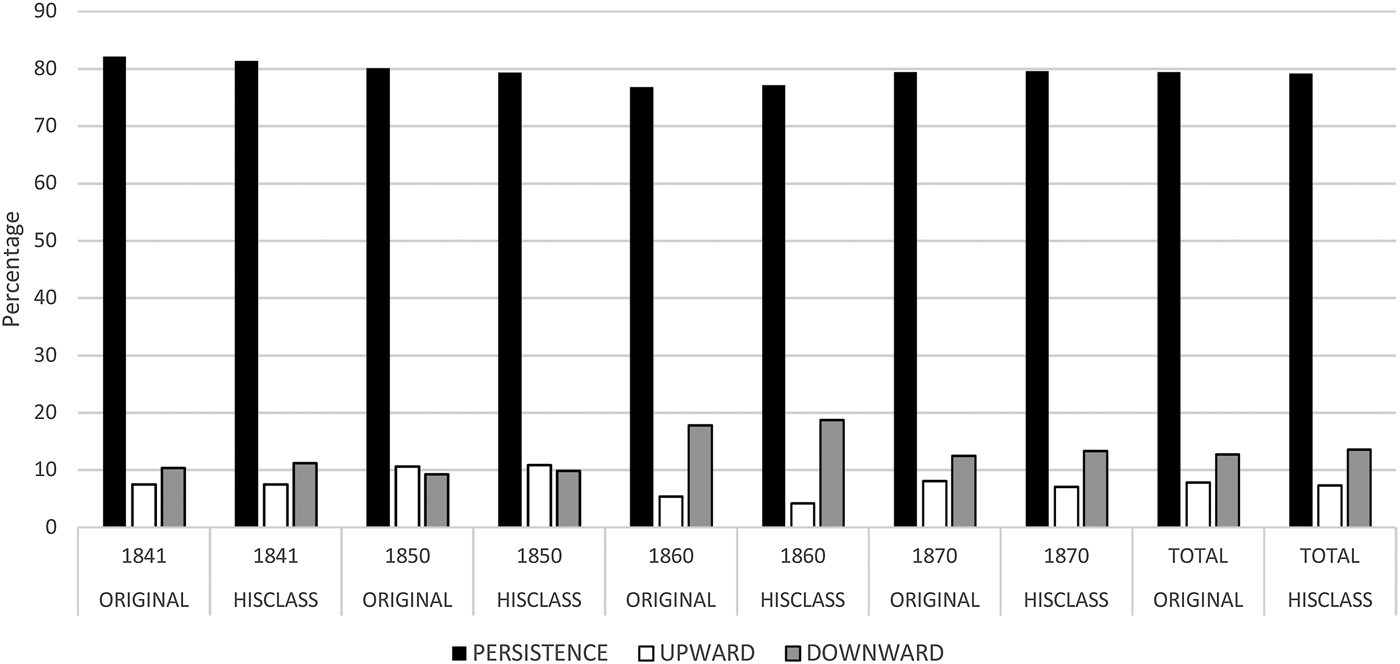
Although transition matrices are good for identifying where upward and downward movements take place, their analysis to obtain a general picture over the period is not straightforward. For that reason, different estimators have been proposed in the literature to synthesise their results. The most common consists of using the sum of the probabilities in the main diagonal, as defined in Table 6, as an estimator of persistence in the whole sample, while those falling outside were used as an estimation of mobility. As explained above, the sum of those cells falling above the diagonal would represent upward mobility, while those falling below it would represent downward mobility. Adding all the cells in each category will give us an idea of the levels of persistence, upward and downward mobility in each benchmark as presented in Figure 3.
INTERGENERATIONAL MOBILITY FROM TRANSITION MATRICES, 1841-1870.
Sources: Civil registry as indicated in the online Appendix.

In the same line as intergenerational elasticities and IRAs, transition matrices show that high persistence levels remained during the whole period, with values either close to or above 80 per cent. However, we also observe significant differences between benchmarks in the levels of upward and downward mobility. Compared with 1850, the other three benchmarks show worse prospects for improvements. Although the highest persistence is found in 1841, the lower levels reached in 1860 and 1870 were mainly the consequence of a significant increase in downward mobility, while upward mobility remained at relatively similar levels. The year 1850, however, seems to be the benchmark when the possibilities for improvement were highest, as although persistence was still higher than in 1860, the levels of upward mobility were by far the highest of the period and the levels of downward mobility the lowest.
A closer look at the transition matrices presented in Tables 9–12 shows that the improvement of upward mobility of 1850 was not systematic in all classes. Persistence increased for sons raised in class 1 families, although the existence of a ceiling effect could underestimate upward mobility and therefore overestimate persistenceFootnote 13. Downward mobility increased slightly for sons coming from class 2, especially towards class 5. Sons from class 3 experienced a similar situation, although the increase of persistence was more related to a decrease in upward mobility to class 2. Sons from class 4 reduced persistence, but mainly thanks to a reduction in downward mobility to class 5. Finally, the most significant changes took place with sons raised in the lowest class, who were able to improve their situation, climbing to classes 2 and 4. The situation reversed quickly in 1860, and for sons coming from classes 1-4, persistence was reduced but through considerable increases in downward mobility compared to the levels achieved in 1850. Sons from the lowest class experienced a sharp decrease in upward mobility. The situation worsened for sons from classes 1-4 in 1870, while sons from class 5 had similar mobility levels to those of 1870, although we cannot estimate to what extent downward mobility was underestimated given the existence of a floor effect. Summarising, the information from transition matrices offers a detailed explanation of the evolution of occupational mobility in Valencia, and suggests that the improvements that sons from some of the classes (especially from class 5) enjoyed between 1841 and 1850 quickly reversed and worsened during the following decades. The transition matrices using HISCLASS are presented and compared in Table A4 and Figure A5 in the online Appendix, showing practically the same estimates and changes for persistence, upward and downward mobility for every benchmarkFootnote 14.
A potential explanation of the high persistence found in transition matrices could be a consequence of the fact that we are comparing the social status of the son at an early stage of his life cycle with the status of the father at an older age. This means that we do not take the fact that sons could improve their status over time into account, and that this sort of «first job» collected in the marriage record is underestimating their real upward mobility. We decided to explore whether this was the case by analysing the effect of age on the predicted probabilities presented in the transition matrices, using a multinomial logistic regression where we regressed the status of the father on the status of the son using the five classes defined before adding the age of the groom as control following equation [5].
 $$C_{it}^S = \alpha + \beta C_{it}^F + \beta _2{\rm AGE}_{it}^S + \varepsilon _{it}$$
where  $C_{it}^S $ represents the class of the son i in year T,
 $C_{it}^F $ the class of his father on the same year and
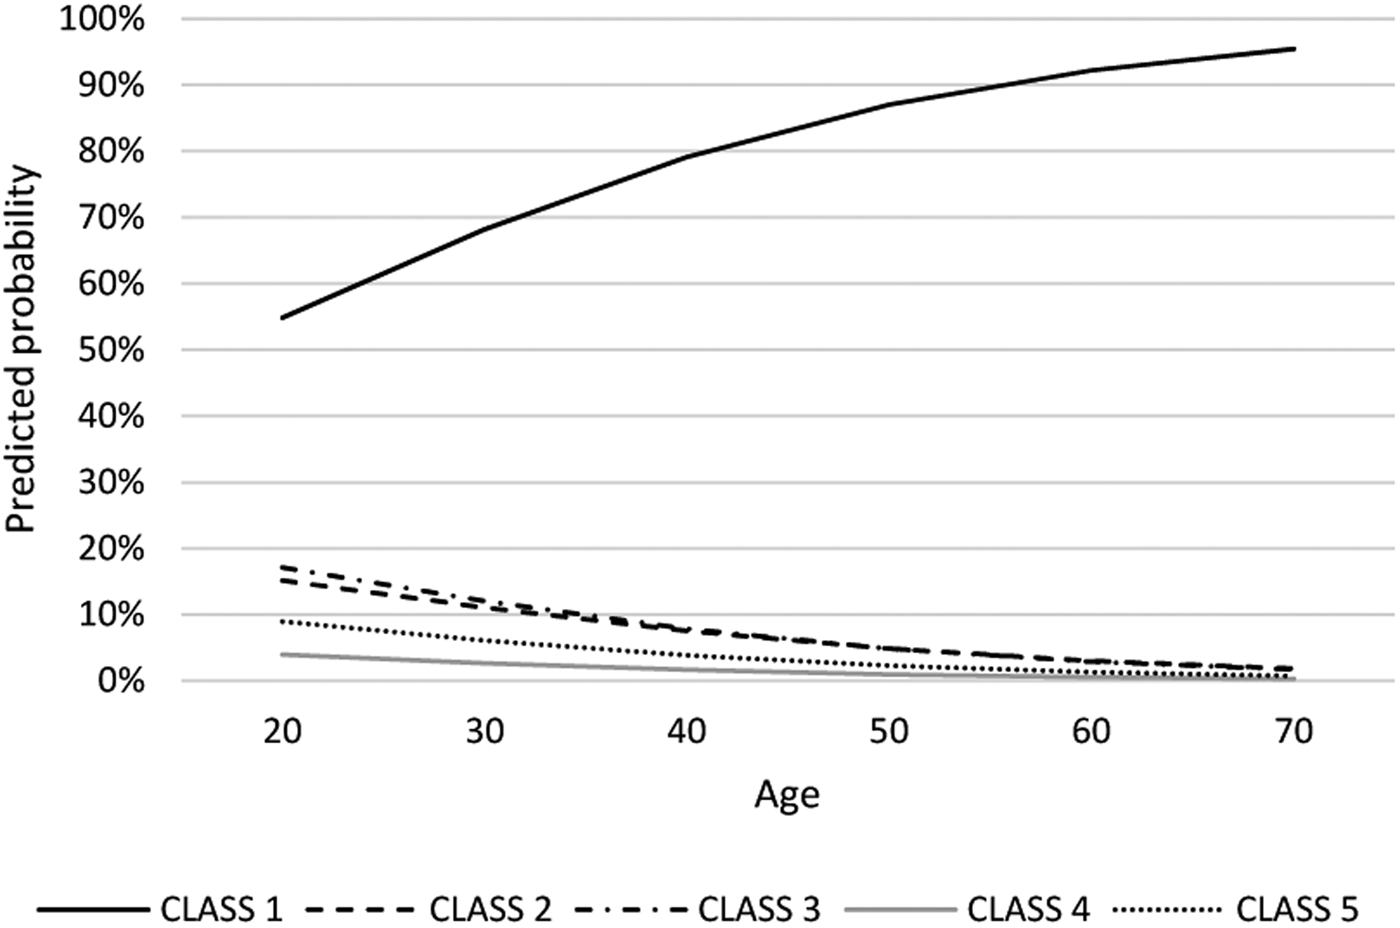
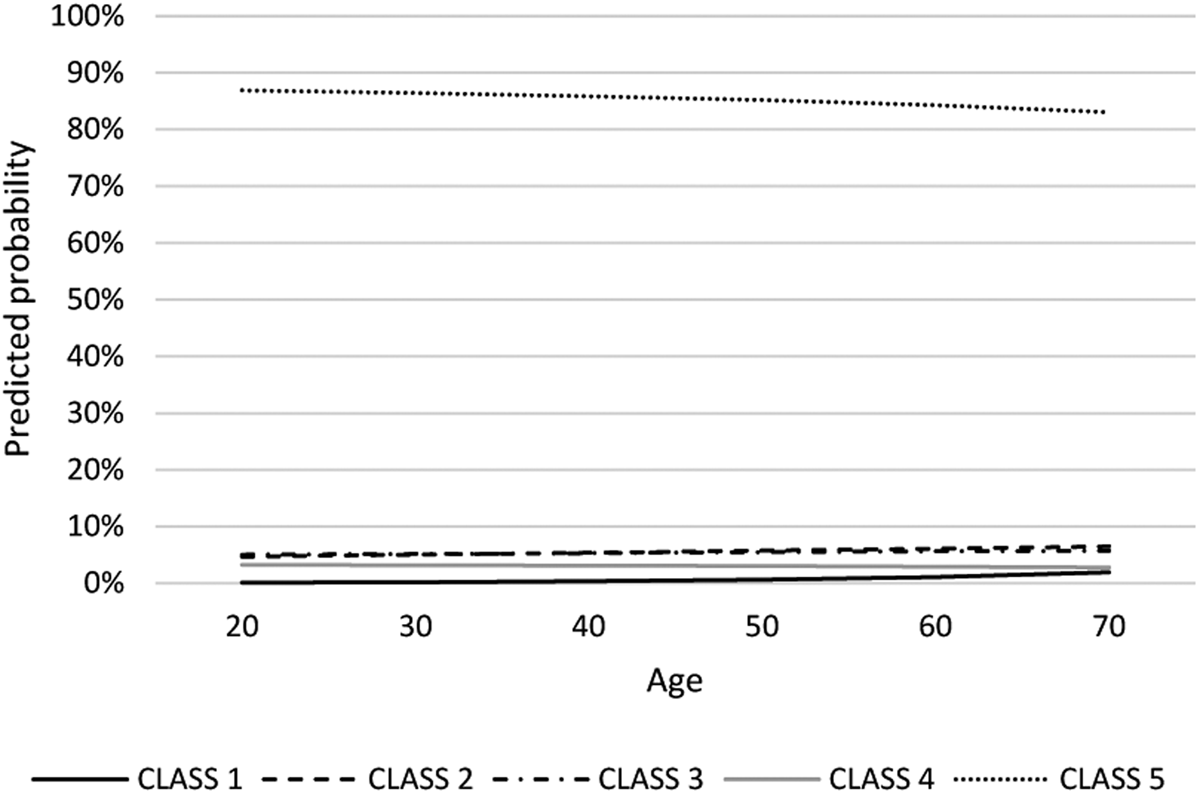
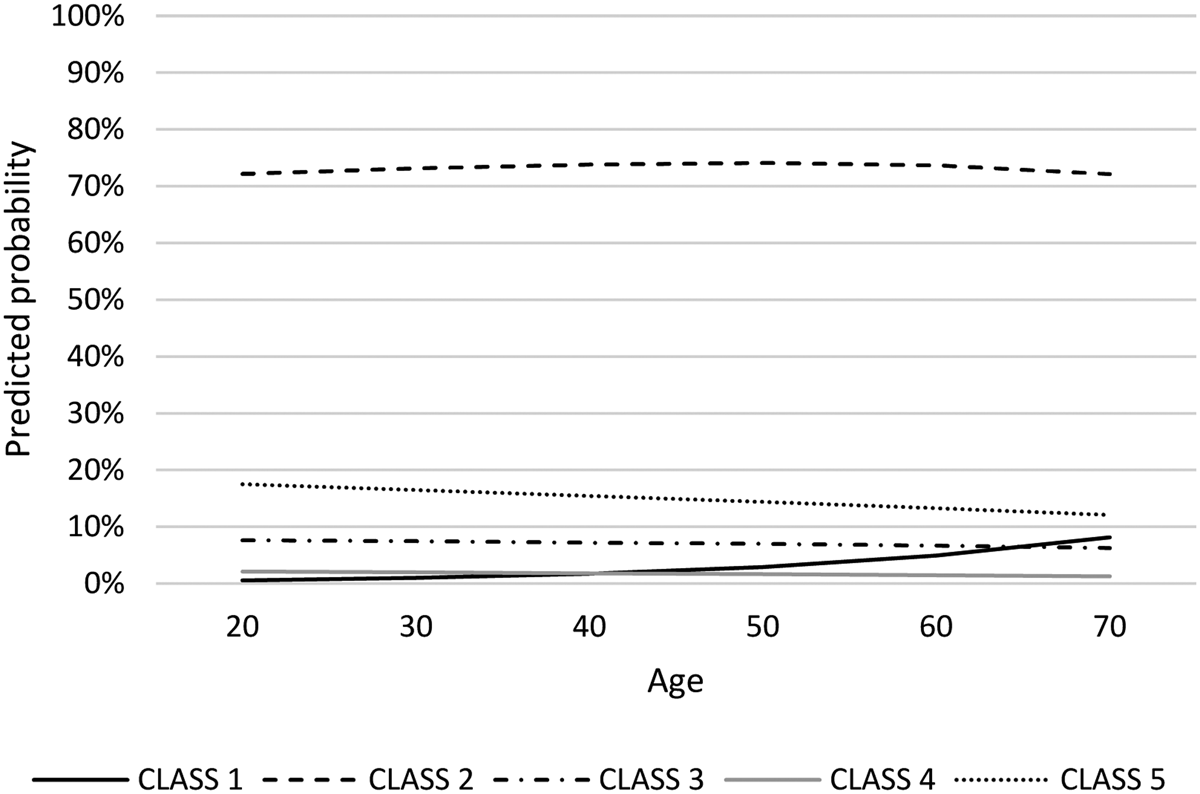
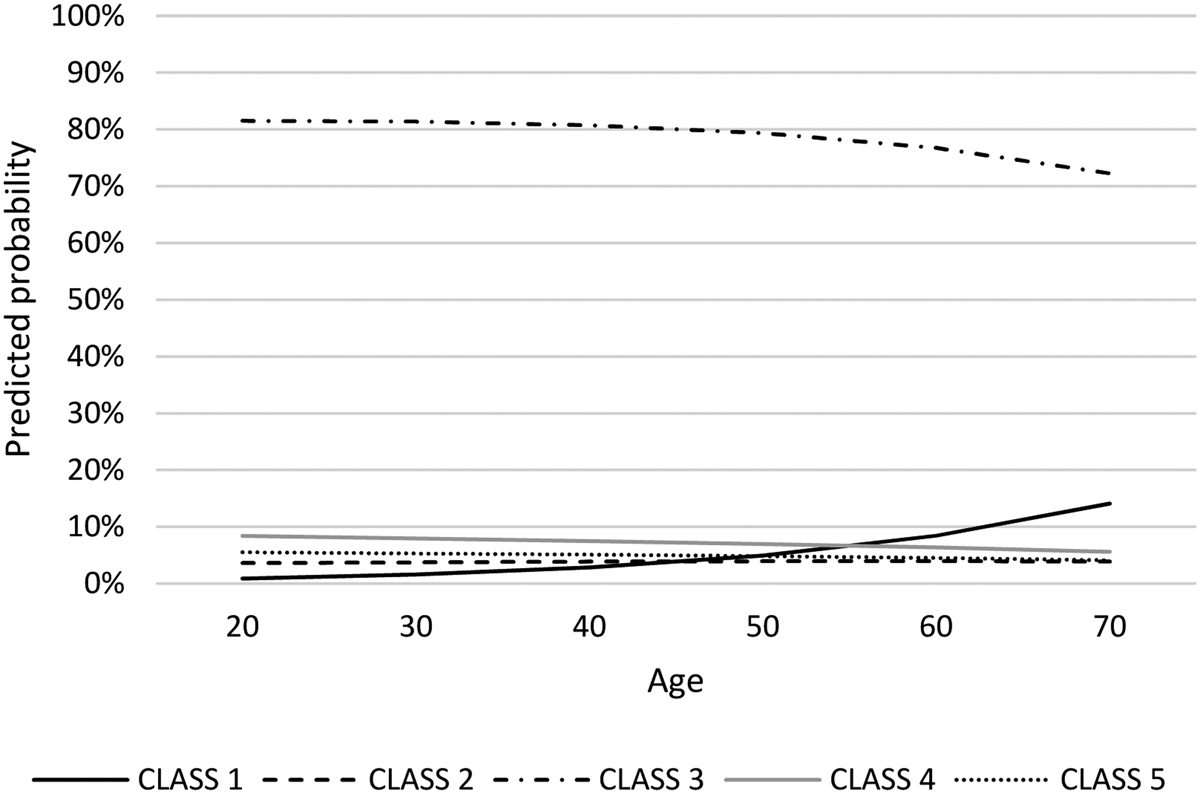
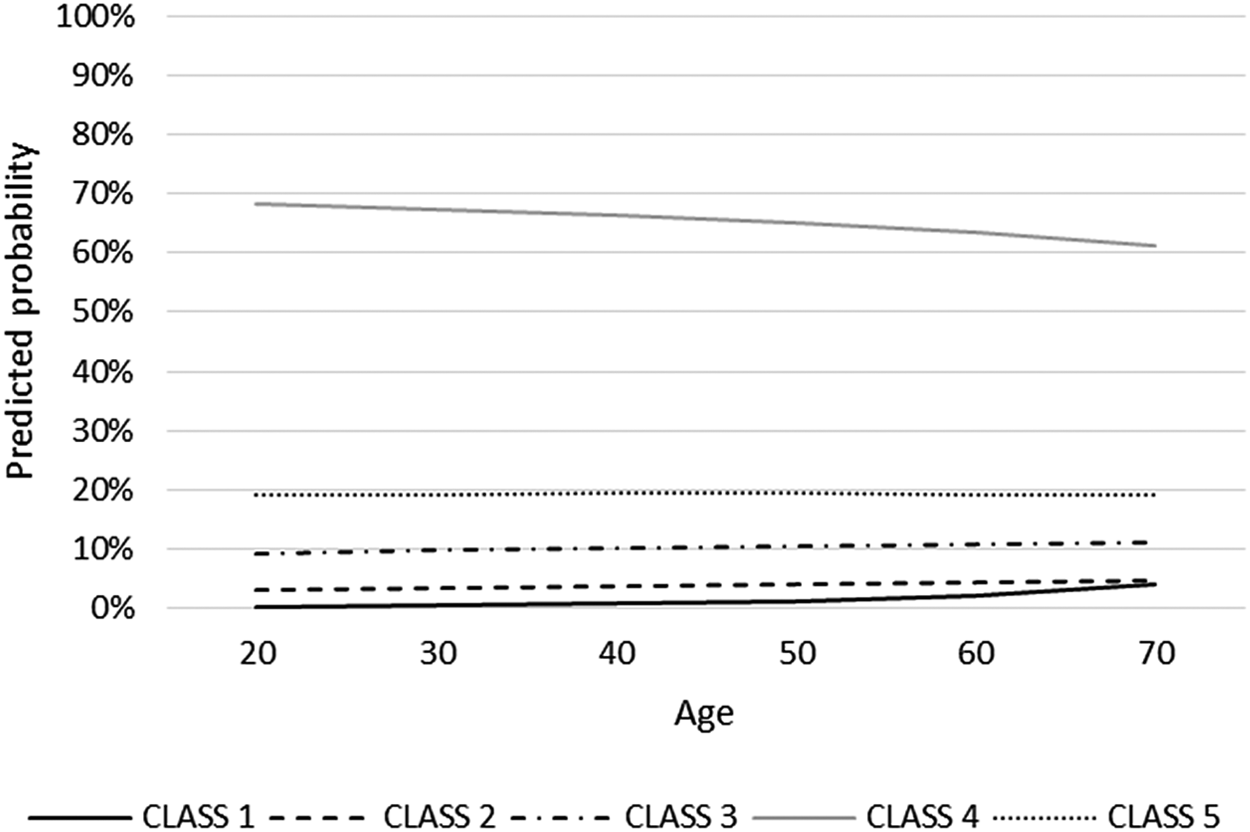
 ${\rm AGE}_{it}^S $ the son's age. The idea of this exercise is to use the results from the model to estimate the probability that a son raised in a certain class had of falling in the different five classes conditional to different ages, to analyse whether, as expected, sons were able to improve their positions as they grew older. Figures 4 and 5 show the probabilities that a son raised in a family that belonged to class 1 and 5, respectively, had of falling into each one of the five classes at different ages. Although in the main text we only report the results for sons raised in families belonging to class 1 and 5, Figures A2-A4 in the online Appendix show the same results for the other classes.
PREDICTED PROBABILITIES FOR SONS WITH FATHERS FROM CLASS 1 (PROFESSIONALS) BY AGE.
Sources: Civil registry as indicated in the online Appendix.

PREDICTED PROBABILITIES FOR SONS WITH FATHERS FROM CLASS 5 (UNSKILLED) BY AGE.
Sources: Civil registry as indicated in the online Appendix.

The results show that age played a significant role in the case of sons coming from class 1, as they paid a high penalty at early ages but very quickly recovered the status of their parents as they grew older. If at age 20 the predicted probability that they had of reaching class 1 was just 54.8 per cent, almost 80 per cent of them had been able to reach this class at age 40. However, the results for sons born in the other four classes showed a far more stable probability of remaining within the same class as their fathers as they grew older. Although we also observe some improvements with a reduction of the probabilities of falling within the same class as their fathers at older ages, this reduction is much smaller. For instance, even at age 70, the probability that sons from class 5 had of falling in the same class themselves was 79.9 per cent. The inclusion of 95 per cent confidence intervals shows that both the penalty paid for marrying younger paid by sons raised in class 1 and the relative stability for the rest of the classes are robust, especially in the classes that contained a larger number of individualsFootnote 15.
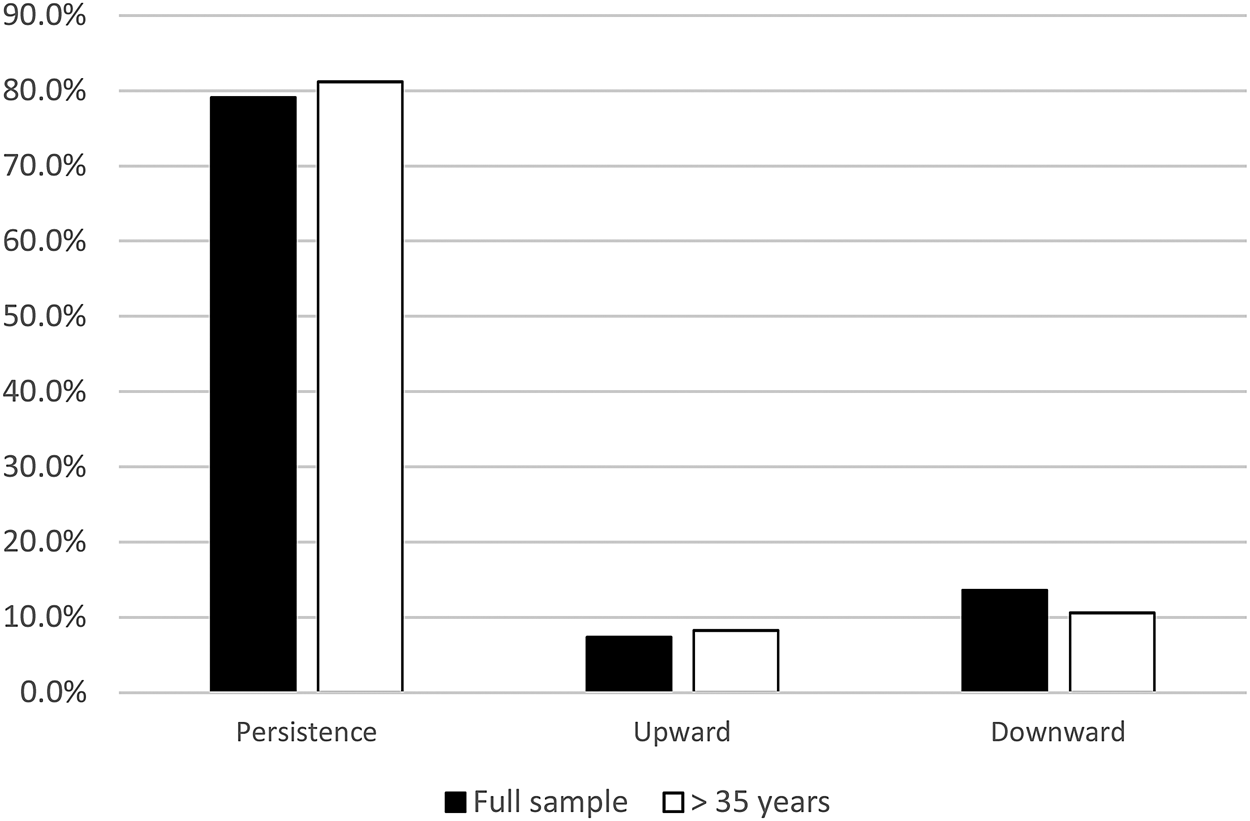
As a robustness check, we estimated two transition matrices as those already presented gathering the information for all the years, one with the full sample and a second one including only sons 35 years old or older. We chose the age of 35 as a threshold as Dahl and DeLeire (Reference Dahl and DeLeire2008, p. 13) suggest that earnings after age 35 are a good proxy of lifetime earnings. The results presented in Tables A5 and A6 in the online Appendix show that, as explained above, using a sample restricted to sons older than 35 improves upward mobility for some classes (although not for those raised in class 5), and reduces downward mobility for those from families in class 1. However, the changes of total persistence, upward and downward mobility estimated as in Table 6 and compared in Figure A6 are relatively small; the reason being that the cells most affected by the changes represented a small percentage of the whole sample. Compared with the full sample, the restricted sample for older sons reduces downward mobility from 13.6 to 10.6 per cent, increases upward mobility from 7.3 to 8.2 per cent and increases persistence from 79.1 to 81.2 per centFootnote 16.
4. DISCUSSION
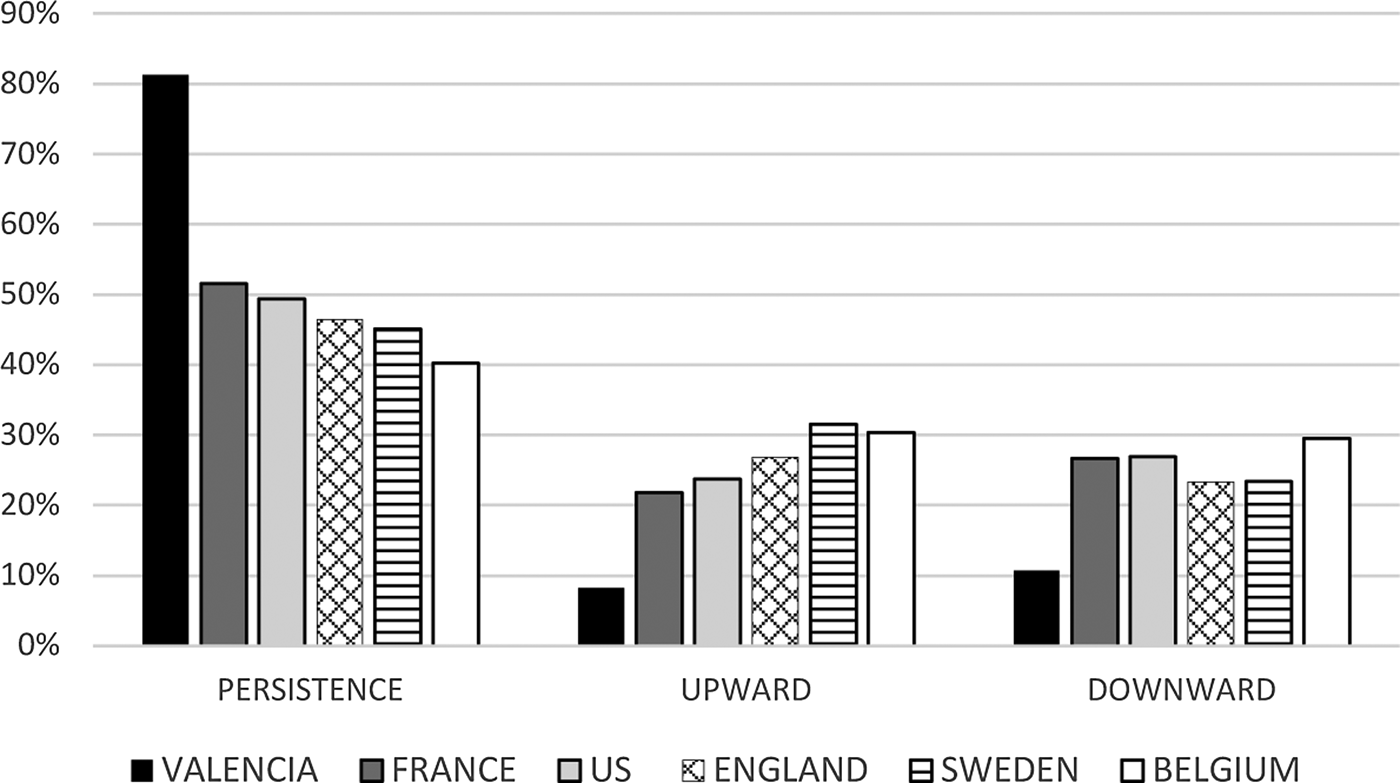
Our results suggest that the levels of social mobility in Valencia between 1841 and 1870 were relatively low. But, how low? How do these estimates compare with similar studies in other countries? What forces lie behind the increasing mobility that we observe in 1850 and the rapid setback that followed during the next decades? Figure 6 compares the levels of persistence, upward and downward mobility in different countries in the 19th century with our estimations for Valencia. As the data for other countries are mostly adjusted by life cycle, we compared the results with our estimations for grooms of 35 years old and olderFootnote 17.
INTERNATIONAL COMPARISONS OF TRANSITION MATRICES.
Sources: for France 1836-74 (Bourdieu et al. Reference Bourdieu, Ferrie and Kesztenbaum2009), for US 1860-80 (Long and Ferrie Reference Long and Ferrie2013), for England 1851-81 (Long Reference Long2013), for Sweden 1840-70 (Maas and van Leeuwen Reference Maas and Van Leeuwen2002), for Belgium 1846-1920 (van Bavel et al. Reference Van Bavel, Moreels, Van De Putte and Matthijs2011) and for Valencia 1840-70 our own estimations from marriage records (see online Appendix).

The results are remarkable and show that Valencia presented by far the highest levels of persistence almost doubling the values in other countries, as well as the lowest levels of both upward and downward mobility. Valencian society appears to be an outlier in the sample where all the other countries present values that are much more homogeneous. We found a similar situation if we compare intergenerational elasticities where the average value of 0.74 found for Valencia appears to be in the upper range. Olivetti and Paserman (Reference Olivetti and Paserman2015) used a similar operationalisation of fathers/sons occupations to estimate an intergenerational income elasticity of just 0.35 for the United States in 1870. The levels also appear to be high compared with the value estimated for Spain in later periods, such as the 0.45 elasticity estimated by Collado et al. (Reference Collado, Ortuño-Ortín and Romeu2012) for Spain in the early 20th century.
Explaining the dynamics of social mobility in Valencia in our different benchmark years will also help us to understand the changes that were taking place in Valencian society and the reasons behind the low levels of intergenerational mobility. The transition matrices for Valencia presented above showed an improvement in social mobility between 1841 and 1850, when persistence and downward mobility decreased while upward mobility rose. A detailed analysis of the microdata reveals that an important part of the improvement was based on changes in the lowest part of the distribution. Compared with 1841, in 1850, a larger share of sons of unskilled rural workers were able to become farmers and also found jobs in the manufacturing sector, mainly in large cities such as Alicante but also in smaller towns such as Elche. We can therefore observe two different forces increasing upward mobility: one led by agriculture and a second by the manufacturing sector.
Concerning the former, the role of agriculture in the increase of upward mobility in 1850, we should firstly understand how the descendants of landless rural workers were able to have more access to land in 1850 than in 1841. The most probable answer stems from the Spanish confiscation of land carried out by the central government; in this case, the seizure led by Mendizabal, the prime minister who in 1836 confiscated the lands in the hands of the church. The confiscation of 1836 is a well-studied event in Spanish economic history and represented a massive transfer of property from the hands of church to private buyers. Although the confiscation happened in 1836, it was not until years later that most of the sales took place. As in the case of Spain, in Valencia and neighbouring regions such as Murcia, most of the sales took place in the 1840s, a delay that affected rural properties especially (Villabona Blanco Reference Villabona Blanco1993, p. 132; Brines i Blasco Reference Brines i Blasco1978, p. 143). Partially as a consequence of the confiscation, the area of land under cultivation in Valencia doubled between 1834-1848 and 1866-1890 (Furió Reference Furió1995, p. 475).
There is a general consensus around the idea that the effect of the transfer of properties from the church to private investors in Valencia produced a concentration of land in the hands of a small number of large landowners. However, it is also true that the sale allowed the increase in the number of small- and medium-sized farmers who either bought or rented land, and also that the process presents geographical differences, the concentration being more intense around the large cities such as Valencia (Furió Reference Furió1995, pp. 472-473). Our data show that the ratio between unskilled rural workers and farmers increased more rapidly in Valencia and its hinterland than in the rest of the locations, supporting the idea that the concentration of properties around the capital was indeed particularly intense. Places such as Cullera, in the region of Valencia, on the other hand, experienced the same concentration of land but were also able to maintain an increasing number of small farmers (Romero and Cucó Reference Romero and Cucó1979, p. 63). Our records also confirm that the improvement in upward mobility of 1850 was exceptional and temporary. In 1860 and 1870, the rise in upward mobility from rural areas had not only disappeared, but reversed, explaining part of the increase in regional downward mobility in 1860 and 1870 and the rising polarization within the rural economy. During these two decades, we observe that an increasing number of sons of farmers became unskilled rural workers, exactly the opposite movement to that found between 1841 and 1850.
However, we should also take into account that the increase in upward mobility in 1850 did not mean that in absolute terms the situation in the countryside was better for the lowest classes. In fact, compared with 1841, in 1850, the percentage of sons recorded in our sample as unskilled rural workers increased from 32 to 36 per cent, while the percentage of those who declared themselves to be farmers fell from 38 to 32 per cent. However, the deterioration of their fathers was even worse; the share of fathers recorded as unskilled rural workers increased from 33 to 42 per cent and farmers decreased from 43 to 27 per cent. Therefore, part of the improvement in upward mobility from the lowest class between 1841 and 1850 was the consequence of sons resisting better, probably and as explained earlier, thanks to the opportunities that they found in the sale of confiscated lands. This hypothesis would also explain why, while the position of sons in rural areas deteriorated very rapidly in the years after 1850, their fathers (most of whom were the sons in 1850) showed a higher resilience. The opportunities that the sale of confiscated lands provided for the sons of unskilled rural workers in the 1840s were not available for the offspring of these new farmers decades later. While in the case of the fathers the ratio unskilled rural worker/farmer increased by 83 per cent between 1850 and 1870, the same ratio taking into account their sons more than doubled. This means that the concentration of land in fewer hands intensified with each new generation. The increasing barriers that recently married sons faced compared with the first years (especially 1850) produced an expansion in the number of unskilled workers at the expense of farmers, while the process affected the previous generation less.
Therefore, the process produced an increasing division of the rural world between a growing number of unskilled workers and a relatively smaller but still important number of farmers from previous generations. The polarisation was accompanied by a decrease in living standards, as the rise of infant mortality rates in rural areas of Alicante shows (Reher et al. Reference Reher, Perez Moreda, Bernabeu Mestre, Corsini and Viazzo1997). The process of increasing accumulation of land by the upper classes in large cities such as Valencia intensified during the last two decades, creating a new elite of rich large landowners. The reforms of the liberal governments had also eliminated institutional rigidities, which had acted as a brake for the development of an efficient agriculture. This new commercial and agrarian bourgeoisie was the main beneficiary of the domestic and international economic integration, specialised in the exploitation of an intensive market-oriented agriculture.
The second source of increasing upward mobility in 1850 with respect to 1841 was the movement of individuals from unskilled rural families to the manufacturing sector in urban areas. Did this sector really offer better opportunities in 1850? Our data allow us to estimate the sectorial shares in the economy during the whole period. We observe that the share of workers in the secondary sector in the region increased between 1841 and 1850 from 15.8 to 18.4 per cent, being the only period between 1841 and 1870 when the sector increased its weight in the regional economy. The secondary sector increased in the city of Valencia, but also in smaller towns such as Orihuela. Therefore, the upward mobility that we observe in 1850 from unskilled rural families to the manufacturing sector is also supported by a growing secondary sector in the region. However, and as in the case of the opportunities in agriculture, this new chance to climb the social ladder was exceptional and had disappeared by 1860. Our estimation of labour shares once again confirms the reversal of the situation as, after peaking in 1850, the share of the secondary sector decreased in 1860 to levels lower than in 1841 (15.7 per cent) and fell even more by 1870 when it reached its lowest value (13.1 per cent), a decrease that also took place in the tertiary sector. Palafox (Reference Palafox1984, p. 302) showed that between 1860 and 1887, the share of agriculture did not recede in most of Valencia. One of the reasons for this de-industrialisation was the collapse of the silk industry in the city of Valencia, one of the main manufacturing centres in the region. Our data support the complete collapse of the textile industry in the capital between 1850 and 1860; this situation continued until 1870 when our estimations of the labour share of the textile sector in the economy halved, a decrease that was even larger in the case of silk artisans.
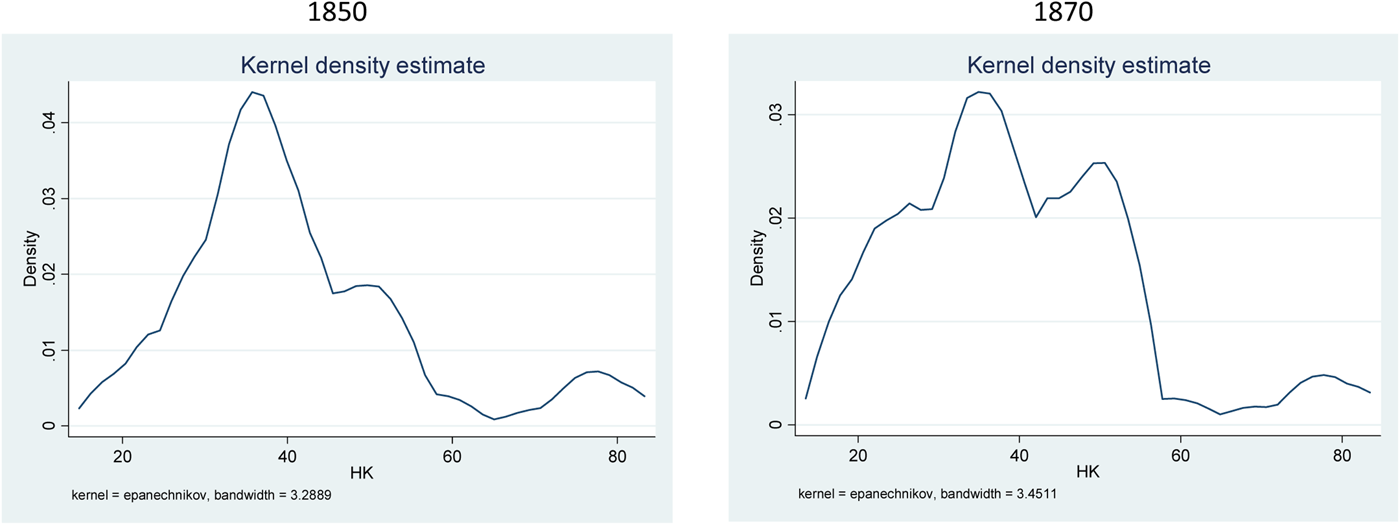
The study of the city of Valencia and the changes it experienced are a good example of the polarisation that took place in the region, a situation which was particularly intense in its capital city between 1850 and 1870. While that part of its population composed of large landowners, merchants and liberal professionals took advantage of trade opportunities, the arrival of poor migrants from the region and the pauperisation of the lowest social classes reached unsustainable levels which even led to civil unrest. Furió describes the situation as a rapid advance in polarisation where, at the same time that a small elite was being created, an increasing number of people stuck at subsistence levels was living in the city (Furió Reference Furió1995, p. 494). Studies using anthropometric measures also show an unequal social impact during the first years of industrialisation in Valencia (Puche and Cañabate-Cabezuelos Reference Puche and Cañabate-Cabezuelos2016, p. 139). Do our data support the polarisation in the city of Valencia described by the literature? Figure 7 shows the kernel distributions of SIOPS scores of the males who married in the city of Valencia in the benchmark years of 1850 and 1870.
KERNEL DISTRIBUTIONS OF SIOP SCORES FOR MALES MARRIED IN VALENCIA, 1850 AND 1870.
Sources: Civil registry, city of Valencia.

As we can see, the story of polarisation presented by the literature is supported by our data. In 1850, the distribution was clearly centred on a single peak with a SIOPS score close to 40, corresponding mainly to artisans employed in textiles. However, the industrial collapse produced a significant reduction of this peak by 1870; it was eroded by the emergence of a growing lower class with scores around 20 and an increase in the share of individuals with a high score around 50. A closer look at the occupations in 1870 shows that those joining the lower part of the distribution were mainly unskilled workers who trebled their share compared with 1850, and also servants who almost doubled their share in the sample. On the other hand, skilled occupations related to trade increased by 60 per cent and were largely responsible for the growth in the upper part of the distribution. Therefore, the chances for upward mobility offered by the city to those with humble backgrounds in the manufacturing sector were increasingly scarce. Worsening living conditions were also observed in the rest of the region; Martinez Carrión and Perez Castejón found trends in living conditions that match our estimations for the same town, worsening as inequality increased (Martinez Carrión and Perez Castejón Reference Martínez Carrión and Pérez Castejón1998, p. 217)Footnote 18.
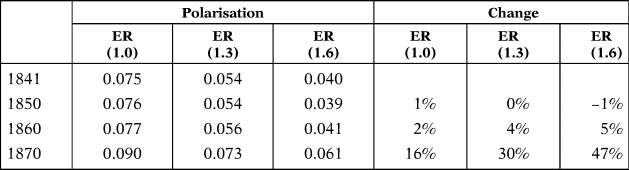
To get a better idea of the changes in polarisation levels in the whole region, Table 13 presents the estimation of the Esteban and Ray (Reference Esteban and Ray1994) polarisation index for discrete data, estimated using the SIOPS score of our regional sampleFootnote 19. For robustness, the index was estimated at different polarisation sensitivity levels (ER) that can take values between 1 and 1.6. As the information from the change in the occupational structure in the city of Valencia suggested, polarisation in the whole region increased slowly between 1850 and 1860 but very rapidly between 1860 and 1870 when it increased between 16 and 47 per cent depending on the sensitivity level chosen. This movement reflected the increasing polarisation that was also taking place in rural areas as described above.
POLARISATION IN VALENCIA, 1841-70

Note: Esteban and Ray polarisation index (Esteban and Ray Reference Esteban and Ray1994).
In a reversal of fortunes, the same forces that had allowed an increase in upward social mobility in 1850 disappeared very quickly in the following decades, leading to an intense process of polarisation that intensified by 1870. The accumulation of land in the hands of large landowners in the countryside polarised the rural economy between a growing number of unskilled workers and a proportionally smaller number of large landowners. In the urban economy, the industrial development between 1841 and 1850 also reversed quickly and fostered the polarisation between a pauperised lower class and a rising upper class which benefited from a dynamic agriculture connected to domestic and international trade. Therefore, the rapid development of the region and its opening up to world trade clearly benefited a small share of the population in the upper part of the income distribution, while it did not provide more opportunities to those in the lowestFootnote 20.
5. CONCLUSIONS
The central decades of the 19th century were a key period in the economic history of Spain. The modernisation of the country included rising industrialisation, rapid economic growth, the development of transport and communications technologies, increasing domestic and international economic integration and institutional reforms influenced by the liberal revolutions. On the other hand, the amount of information that we have on these key decades is far from perfect. This paper has attempted to shed some light on the period putting a special emphasis on the study of occupational mobility, a field practically unexplored in Spain in preindustrial times. Using a detailed and extensive sample of marriage records in the region of Valencia, we have presented several estimations of occupational mobility to conclude that the region was characterised during the whole period by a high persistence. Upward and downward mobility improved between 1841 and 1850, thanks to the new opportunities offered to those raised in poorer families in agriculture and manufacturing. However, these opportunities quickly disappeared in the following decades as a consequence of the increasing concentration of land in the rural economy and the collapse of urban industry. The result was a decrease in upward and an increase in downward mobility, also producing a higher polarization in Valencian society between wealthy urban and rural elites and a growing group in the lower part of the income distribution. This process, which can be observed in our data, is also supported by the available evidence in the literature. Intergenerational mobility was not only low during the whole period, but also much lower than the levels observed in other countries which systematically showed more dynamic societies with mobility levels that almost doubled those observed in Valencia.
Concluding, we believe that the use of marriage records for the period 1841-1870 can provide us with important insights not only into changes in social mobility, but also regarding key economic dynamics paramount to an understanding of the modernisation of Spain. The example of Valencia also presents interesting consequences related to the increasing economic integration that Spain and the rest of the world were experiencing. Part of the agricultural sector in Valencia, under the control of large landowners, was able to take advantage of these new opportunities and oriented their production to a growing domestic and international market. On the other hand, while this new commercial and agrarian elite appeared as the clear winners of the first globalisation, the children of small farmers and skilled workers were clearly the losers. The opening up of Valencia to the world and the subsequent growth did not provide more opportunities for the lowest classes, who suffered an increasing pauperisation that ended up with the creation of a more polarised and unequal society.
SOURCES AND OFFICIAL PUBLICATIONS
Primary Sources Consulted
-
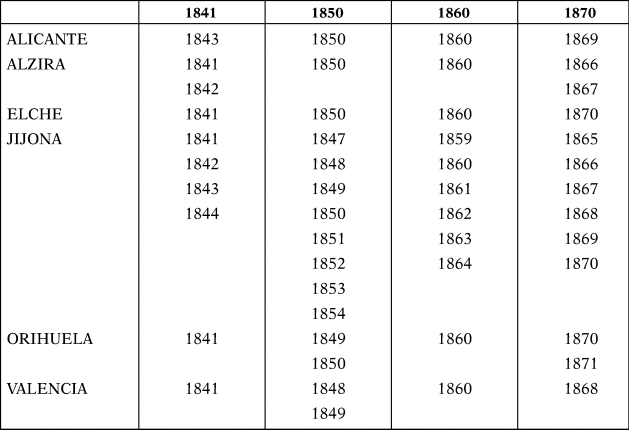
Alicante: Marriage records for the years 1843, 1850, 1860 and 1869 retrieved from: Familysearch.org.
-
Alzira: Marriage records for the years 1841, 1842, 1850, 1860, 1866 and 1867 retrieved from: Familysearch.org.
-
Aspe: Marriage records for the years 1841, 1843, 1844, 1859, 1860 and 1869 retrieved from: Familysearch.org.
-
Elche: Marriage records for the years 1841, 1850, 1860 and 1870 retrieved from: Familysearch.org.
-
Jijona: Marriage records for the years 1841, 1842, 1843, 1844, 1847, 1848, 1849, 1850, 1851, 1852, 1853, 1854, 1859, 1860, 1861, 1862, 1863, 1864, 1865, 1866, 1867, 1868, 1869 and 1870 from the municipal historical archive of Jijona.
-
Orihuela: Marriage records for the years 1841, 1849, 1850, 1860 and 1868 from the municipal historical archive of Orihuela.
-
Valencia: Marriage records for the years 1841, 1848, 1849, 1860 and 1868 from the municipal historical archive of Valencia.
Legal Sources
-
Decreto de XLV de 3 de febrero de 1823, para el gobierno económico-político de las provincias. Retrieved from: http://bvpb.mcu.es
-
Real Decreto 20th January 1834, declarando que las asociaciones gremiales no gozan fuero privilegiado, y que no se podrá formar ninguna que monopolice el trabajo. Retrieved from: http://www.boe.es.
-
Decreto de 24 de enero de 1841 (Gaceta de Madrid, 26 de enero de 1841). Retrieved from: http://boe.es
-
Ley provisional de 17 de junio de 1870 del registro civil. (Gaceta de Madrid, 14 de diciembre de 1870). Retrieved from: http://boe.es
Other
-
JUNTA GENERAL DE ESTADÍSTICA (1866-1867): Anuario estadístico de España, 1862-1865. Madrid: Imprenta Nacional.
-
JUNTA GENERAL DE ESTADÍSTICA (1863): Censo de la población de España, según el recuento verificado en 25 de diciembre de 1860. Madrid: Imprenta Nacional.
Supplementary material
The supplementary material for this article can be found at https://doi.org/10.1017/S0212610920000282.
ACKNOWLEDGEMENTS
I would like to thank three anonymous referees for their comments that helped to improve the quality of the paper substantially, the efficient work of the editor and Alejandro Fernández-Roldán Díaz for his research assistance. All remaining errors are entirely mine. I would also like to thank the comments received by the attendants at the EHS annual conference in Belfast and for the feedback that, as a participant, I received from the SMITE project and network. Finally, this article was possible thanks to the financial support from Fundación Ramón Areces through the project «Los orígenes de la desigualdad regional en España, 1840-2015».
Appendix
YEARS OF MARRIAGE RECORDS COLLECTED BY LOCATION AND BENCHMARK

NUMBER OF MARRIAGE RECORDS COLLECTED BY LOCATION AND BENCHMARK

INTERGENERATIONAL ELASTICITIES AND INTERGENERATIONAL RANK ASSOCIATION (IRA) 1841-1870 USING HISCAM


TRANSITION MATRIX IN VALENCIA, 1841-70 (FULL SAMPLE)

TRANSITION MATRIX IN VALENCIA, 1841-70 (GROOMS OLDER THAN 35)

EXAMPLE OF MARRIAGE RECORD.
Source: Municipal archive of Orihuela.

PREDICTED PROBABILITIES FOR SONS WITH FATHERS FROM CLASS 2 (INTERMEDIATE) BY AGE.
Sources: Civil registry as indicated in the online Appendix.

PREDICTED PROBABILITIES FOR SONS WITH FATHERS FROM CLASS 3 (SKILLED) BY AGE.
Sources: Civil registry as indicated in the online Appendix.

PREDICTED PROBABILITIES FOR SONS WITH FATHERS FROM CLASS 4 (SEMI-SKILLED) BY AGE.
Sources: Civil registry as indicated in the online Appendix.

COMPARISON OF PERSISTENCE, UPWARD AND DOWNWARD MOBILITY ORIGINAL VS HISCLASS, 1841-70.

COMPARISON OF PERSISTENCE, UPWARD AND DOWNWARD MOBILITY OF FULL SAMPLE AND SONS ⩾35 YEARS OLD