

INTRODUCTION
Studies focusing on Amazonian white-sand vegetation are of ecological interest (Adeney et al. Reference ADENEY, CHRISTENSEN, VICENTINI and COHN-HAFT2016, Anderson Reference ANDERSON1981, Higgins et al. Reference HIGGINS, RUOKOLAINEN, TUOMISTO, LLERENA, CARDENAS, PHILLIPS, VÁSQUEZ and RÄSÄNEN2011, Moulatlet et al. Reference MOULATLET, COSTA, RENNÓ, EMILIO and SCHIETTI2014, ter Steege et al. Reference TER STEEGE, PITMAN, PHILLIPS, CHAVE, SABATIER, DUQUE, MOLINO, PRÉVOST, SPICHIGER and CASTELLANOS2006, Tuomisto et al. Reference TUOMISTO, RUOKOLAINEN and YLI-HALLA2003), because of the high proportion of endemic species adapted to these nutrient-poor sandy soils (Anderson Reference ANDERSON1978, Reference ANDERSON1981; Lisboa Reference LISBOA1975). The habitat endemism in white-sand forests is a characteristic of great relevance for biological interactions (Naka et al. Reference NAKA, COHN-HAFT, MALLET-RODRIGUES, SANTOS and TORRES2006), particularly for advancing the knowledge on how lineage diversification and community assembly occur in the tropical flora (Fine & Baraloto Reference FINE and BARALOTO2016). Despite this importance, the cause for the distribution of the white-sand vegetation within the vastness of the Amazonian lowlands remains largely unknown, with the main hypotheses including soil properties (Anderson Reference ANDERSON1981), heritage from past glacial dry climates (Pessenda et al. Reference PESSENDA, BOULET, ARAVENA, ROSOLEN, GOUVEIA, RIBEIRO and LAMOTTE2001) and burning by man-made fires (Lisboa Reference LISBOA1975).
The Negro-Branco River basins have the largest areas of white-sand vegetation in the Amazonian lowlands, which is in great part confined to triangular-shaped palaeo-landforms associated with Late Pleistocene-Holocene megafans (Rossetti et al. Reference ROSSETTI, ZANI, COHEN and CREMON2012a, b, Reference ROSSETTI, COHEN, BERTANI, HAYAKAWA, PAZ, CASTRO and FRIAES2014a, b; Zani & Rossetti Reference ZANI and ROSSETTI2012). These features record fan-like sedimentary deposits developed on large flat areas by downstream bifurcating distributary drainage networks (Hartley et al. Reference HARTLEY, WEISSMANN, NICHOLS and WARWICK2010), a drainage pattern no longer existing in Amazonian areas. The best-known Amazonian megafan is the Viruá megafan, which is represented by triangular-shaped residual sandy deposits located at the eastern margin of the Branco River in northern Amazonia (Rossetti et al. Reference ROSSETTI, ZANI, COHEN and CREMON2012a, Zani & Rossetti Reference ZANI and ROSSETTI2012). The Viruá megafan deposits are highlighted by several types of white-sand vegetation (i.e. grasslands, shrublands and forests) in sharp contact with the surrounding areas of rain forest (Cordeiro & Rossetti Reference CORDEIRO and ROSSETTI2015). Recent publications stated that the vegetation in the Viruá megafan reflects soil propertiers (Damasco et al. Reference DAMASCO, VICENTINI, CASTILHO, PIMENTEL and NASCIMENTO2013, Mendonça et al. Reference MENDONÇA, SIMAS, SCHAEFER, FILHOS, VALE and MENDONÇA2014). This proposition neglects the entire sedimentary history of the residual megafan deposits preserved in this region, thereby offering only a partial understanding of the full processes that might be involved in the origin of this white-sand vegetation.
In this work, we characterize the physical environment of the Viruá megafan by modelling its topography and canopy height based on a digital elevation model. We also compared the composition and structure of the megafan white-sand forest with that of the neighbouring rain forest using field inventories integrated with remote sensing data. The aim was to determine how and to what extent the megafan palaeo-landform influenced the distribution of contemporaneous plant species in this area. We considered if topographic gradients resulting from the overall megafan morphology and variations of depositional sub-environments affect tree composition and structure. Associating the sedimentary processes responsible for the geomorphological evolution of the physical environment with plant ecology and distribution in Amazonian areas is not novel (Damasco et al. Reference DAMASCO, VICENTINI, CASTILHO, PIMENTEL and NASCIMENTO2013, Higgins et al. Reference HIGGINS, RUOKOLAINEN, TUOMISTO, LLERENA, CARDENAS, PHILLIPS, VÁSQUEZ and RÄSÄNEN2011, Tuomisto & Ruokolainen Reference TUOMISTO and RUOKOLAINEN1997), but relating floristic dissimilarities to late Quaternary sedimentary dynamics of megafan depositional systems within this region is a novel hypothesis, tested here by the integration of topographic and floristic data. Thus, the hypothesis tested is that sedimentary disturbances imposed by the geological evolution of the Viruá megafan is the main ecological factor controlling the distribution and structuring of white-sand plant communities in this environment.
STUDY SITE
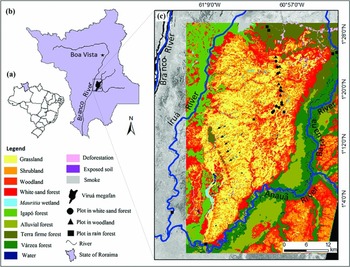
The Viruá megafan consists of sedimentary deposits having a conical geometry and a topographic gradient averaging 26 cm km−1. This megafan is located in the south-central part of the State of Roraima, district of Caracaraí, northern Brazil (Figure 1a, b), where it encompasses ~1000 km2, with maximum length and width of 45 km and 25 km, respectively. Climate in this region is tropical, with monthly temperatures of 26°C to 33°C (Radambrasil 1976), average annual rainfall of 1800 mm, a well-defined dry season between December and March, and a wet season between June and September.
Location map of the study area in the south-central part of the State of Roraima, northern Amazonia (a). Location of the Viruá megafan in the central southern part of the State of Roraima (b). Vegetation map of the Viruá megafan (from Cordeiro & Rossetti Reference CORDEIRO and ROSSETTI2015) on an Advanced Spaceborne Thermal Emission and Reflection Radiometer (ASTER) image (band 1), with location of the 26 plots used for the floristic inventories (c).

Geologically, the Viruá megafan is included in the north-east of Solimões Basin. The megafan deposits consist of moderately to well-sorted and very fine- to medium-grained quartzose sands, although coarse-grained sands and silty or muddy deposits are locally present. Radiocarbon dating from superficial deposits recorded latest Pleistocene and Holocene ages ranging from 36607–38161 cal y BP to 634–695 cal y BP (Rossetti et al. Reference ROSSETTI, ZANI, COHEN and CREMON2012a). Sediment sources are from neighbouring Precambrian rocks of the Guiana Shield.
A remarkable characteristic of the Viruá megafan is the vast expanse of white-sand vegetation that is in sharp contrast with the surrounding forests. The white-sand vegetation varies from grasslands, shrublands, woodlands to forests developed on poorly drained and poorly structured soils (Mendonça et al. Reference MENDONÇA, SIMAS, SCHAEFER, FILHOS, VALE and MENDONÇA2014). The surrounding forests consist of terra firme and alluvial forest (Cordeiro & Rossetti Reference CORDEIRO and ROSSETTI2015) developed on well-drained and well-structured Oxisols (Mendonça et al. Reference MENDONÇA, SIMAS, SCHAEFER, FILHOS, VALE and MENDONÇA2014).
METHODS
The present study was based on botanical data from the outer and inner megafan, integrated with the characteristics of the physical environment. The botanical data comprised field inventories along 26 transects, plotted using a previously published vegetation map (Cordeiro & Rossetti Reference CORDEIRO and ROSSETTI2015) to compare the trees of white-sand forests and dense forests in the inner and outer Viruá megafan, respectively (Figure 1c). Five vegetation types were considered: two types (woodlands and forests) from the inner megafan and three types (várzea, terra firme and igapó) from the outer megafan. Sampling in the outer megafan comprised six 500 × 20-m (1ha) plots, each subdivided into a total of 20 subplots (25 × 20 m). All vascular plants with a diameter at breast height (dbh) ≥ 10 cm at 1.30 m above ground were inventoried, with 10 plots in the white-sand forest and 10 plots in the woodland (Figure 1). Each plot measured 50 × 20 m (0.1 ha), totalling 1 ha for each vegetation category. The plot sizes and dbh cut-off limits varied in the functions of the different physiognomies. All vascular plants with dbh ≥ 5 cm were inventoried in the white-sand forest, whereas in the woodland, the dbh limit was 3 cm. The vegetation types in the inner and outer megafan were compared using only trees with dbh ≥ 10 cm. Tree heights were visually estimated for all vegetation categories.
The comparison of the floristic groups from the inner and outer megafan, important to demonstrate the differences in vegetation types between these two environments, was achieved using two methods: the unweighted-pair group method with arithmetic mean (UPGMA) for clustering analysis, based only the floristic composition from field data; and the non-metric multidimensional scaling (NMDS) method of the R-package ‘MASS’ (Venables & Ripley Reference VENABLES and RIPLEY2002), applied based on the combination of field and remote sensing data. Compositional dissimilarities between sites were calculated using the Bray–Curtis dissimilarity index based on presence-absence data (Legendre & Legendre 1998). The dendrogram produced by the UPGMA was analysed by three R-packages: ‘vegan’, ‘MASS’ and ‘cluster’. In addition to the UPGMA, we also applied the NMDS method to better ordinate the plant community according to the normalized difference vegetation index (NDVI) (cf. Rouse et al. Reference ROUSE, HAAS, SCHELL, DEERING, Freden, Mercanti and Becker1973) or the digital elevation model (DEM) from the Shuttle Radar Topography Mission (SRTM). The NDVI was extracted from advanced space-borne thermal emission and reflection radiometer (ASTER) images with a high processing level (L3), positional accuracy of ± 0.1 pixel and digital numbers expressed in surface reflectance and corrected for atmospheric influence. The DEM-SRTM comprised the interpolated 30 m-resolution model freely available in the TOPODATA database (Valeriano & Rossetti Reference VALERIANO and ROSSETTI2012). The DEM and NDVI values were extracted from each sampled community and plotted in two separate NMDS graphics, together with the floristic composition based on the presence and absence of tree species considering 10 woodland plots, five in forest, two in várzea, one in igapó and four in terra firme. These plots accounted for the high frequency of rare species, diluted using only abundance data, reflecting the potentially high influence of a few common species (Figueiredo et al. Reference FIGUEIREDO, COSTA, NELSON and PIMENTEL2014). The Kolmogorov–Smirnov (KS) test was applied to detect differences in the NDVI and DEM values among forest classes.
To analyse the influence of the megafan deposits on the distribution of plant communities, we combined the botanical data acquired in the field and modelled from remote sensing data using regional megafan topography. This procedure was based on the preliminary assumption that topographic variation in this region results from sediment accumulation within an overall fan-shaped morphology. These data were preprocessed to improve the information potential by application of the kriging interpolation (from ~90 m to ~30 m). A slight smoothing was used to reduce artefacts and distribute spatial randomness (Valeriano et al. Reference VALERIANO, KUPLICH, STORINO, AMARAL, MENDES and LIMA2006). The topography of the megafan palaeo-landform was also characterized by surface trend analysis (cf. Davis Reference DAVIS1986, Jones et al. Reference JONES, HAMILTON and JOHNSON1986, Swan & Sandilands Reference SWAN and SANDILANDS1995), obtained by the application of polynomial regressions using the MDE-SRTM. A mask to extract only image fractions of soil and open vegetation (i.e. grassland and shrubland) was applied. Within this mask, we randomly selected 706 altimetric points to ensure sample spatial independence. Three polynomial equations of the first to the third degree using Arcgis 10.1 software was performed in the trend surface analysis. The statistical significance of the computed surfaces was based on the highest coefficient of determination (R²), with a P value < 0.05.
The influence of the outer rain forest and of the channels (modern and past) on the distribution of the white-sand forest was realized by the extraction of all patches of white-sand forest from the vegetation map shown in Figure 1 (see Cordeiro & Rossetti Reference CORDEIRO and ROSSETTI2015 for more details on the mapping of these patches). The Euclidean distances between the patches of white-sand forest and the nearest channels and between these patches and the nearest rain forest were calculated. Using the Kernel estimation method, each patch was converted into points to produce density maps containing the number of patches and surface areas, which were used to identify hotspots with a higher concentration of larger patches (cf. Silverman Reference SILVERMAN1986). Several visual tests were conducted to select a radius of 1 km as the minimum size to include all of the main patches of the white-sand vegetation.
The relationship between the white-sand forest and megafan palaeo-landform was also investigated by modelling the relationship of tree heights using NDVI, DEM, or both, in R-software with a statistical significance of P ≤ 0.05. This procedure followed the application of a mask for the rain forests from the outer megafan and Preto Ridge (Figure 1c). The best linear regression model was selected according to the highest coefficient of determination (R2) and lowest values of Akaike's information criterion (AIC) (Burnham et al. Reference BURNHAM, ANDERSON and HUYVAERT2011). The equation applied to produce the map of the estimated canopy height was:
 $$\begin{equation*}
y = {\beta _0} + {\beta _1}x
\end{equation*}$$
where, y is the estimated canopy height; β 0 is the interception point; β 1 is the line slope; and x is the NDVI reflectance value and/or the topographic DEM value. The resulting map selected 948 sample points, distributed regularly in each 1-km interval within the megafan, and interpolated through the kriging (Hengl et al. Reference HENGL, HEUVELINK and ROSSITER2007) in Arcgis 10.0 software.
RESULTS
Characterization of the megafan topography
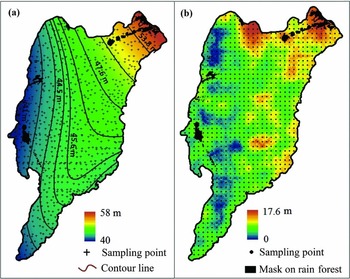
The Viruá megafan encompasses an area of approximately 1016 km2 that is 45 km in length and 25 km in width. This palaeo-landform (Figure 1c) comprises a triangular morphology that is primarily flooded during the greater part of the year. The topography of this area, based on the analysis of the topographic trend surface, indicated the third-order polynomial model as the most representative of the Viruá megafan topography (Figure 2a). This model was selected because it showed the highest R2 (0.75) relative to the other models, with R2 = 0.61 and 0.72 for the first- and second-order polynomial models, respectively. The P value for all models was < 0.001. The third-order polynomial model indicated that the megafan surface is extremely flat, but not horizontal, with trend surface isolines distributed radially southwestward from the megafan axis to the fringe. The megafan slope is gentle, as indicated by a topographic variation of less than 15 cm km−1, with altitudes ranging from 53.8 to 40.0 m. The highest topography was recorded to the north-east, i.e. toward the megafan axis, where the main feeding channel captured sediments from Precambrian basement rocks of the Guiana Shield. Although the megafan relief is smooth, this region controls the modern drainage, functioning as a headwater for modern channels.
Topographic characterization of the Viruá megafan, northern Brazil, based on the third polynomial model resulting from the surface trend analysis of the digital elevation model derived from the shuttle radar topography mission (DEM-SRTM) (a). Distribution of the estimated canopy height (m) along the Viruá megafan achieved from a linear regression model based on the normalized difference vegetation index (NDVI) (b). The rain-forest mask shown in a and b corresponds to rain forest covering basement rocks of Precambrian age within the megafan that were disregarded from the surface trend analysis and also from the analysis of the estimated canopy height.

Forest structure
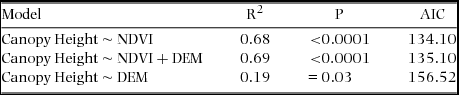
The NDVI was the most valuable data for modelling the canopy height in the Viruá megafan. This explanatory variable applied alone provided R2 = 0.68 and the lowest AIC values (134.10) among all models (Table 2). The inclusion of DEM generated only a slight improvement (R2 = 0.69). In both instances, the P-test was < 0.0001. The use of only DEM in the model provided the lowest correlation (R2 = 0.19, P = 0.03), probably reflecting the occurrence of white-sand forest at different topographies within the megafan. The parameters for the linear model considering β 0 = −12.9, β 1 = 34.4 and NDVI values produced a map with estimated canopy heights (Figure 4a), plotting the highest vegetation in the eastern/north-eastern part of the megafan. The canopy height significantly decreased eastward and south-westward from the centre to the fringe of the megafan, following the topographic gradient (Figure 2b).
The white-sand forest and rain forest were also differentiated, with dbh averaging 15.3 cm and 18.2 cm, respectively. The statistical test-D indicated only a slight difference in this parameter (D = 0.163; P ≤ 0.001). Similarly, the canopy height averages were 8.4 m in the white-sand forest and 14.1 m in the rain forest (D = 0.270; P ≤ 0.001). Thus, the white-sand forest showed trees with lower heights and smaller dbh than the rain forest.
Tree composition in the inner and outer megafan
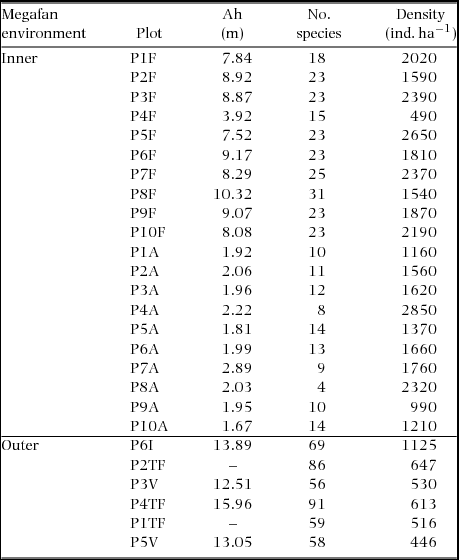
A total of 7357 tree individuals from 66 families and 362 species were identified. Approximately half (50.2%) of all trees belonged to six families: Rubiaceae (14.8%), Chrysobalanaceae (12.7%), Fabaceae (7.2%), Clusiaceae (6.1%), Annonaceae (5.8%) and Sapotaceae (4.9%). Among these trees, the outer megafan recorded 3683 individuals of 59 families, with the five most common individuals including Fabaceae, Chrysobalanaceae, Lecythidaceae, Annonaceae and Sapotaceae. A total of 314 tree species were identified in this environment, with the five main species including Eschweilera atropetiolata Benth., Licania micrantha Miq., Protium apiculatum Swart, Pterocarpus rohrii Vahl and Licania heteromorpha Benth. The inner megafan recorded a total of 3683 individuals of 59 families, with the five most common individuals including Fabaceae, Chrysobalanaceae, Lecythidaceae, Annonaceae and Sapotaceae. A total of 89 tree species were recorded in this environment, with the five main species comprising Ruizterania retusa (Spruce ex Warm.) Marc.-Berti, Licania heteromorpha Benth., Couma utilis (Mart.) Muell. Arg., Sacoglottis guianensis Benth. and Mezilaurus itauba (Meisn.) Taub. ex Mez. Table 1 shows the average heights and densities of the trees comparing the two megafan environments. Considering only trees with dbh ≥ 10 cm, a total of 4353 individuals from 63 families and 331 species were recorded, with 59 families and 290 species occurring in the outer mload egafan and 23 families with only 52 species occurring in the inner megafan.
Tree data for the inner and outer environments studied in the Viruá megafan area comparing the average height (Ah), number of species and density (number of individuals ha−1) of the white-sand forest (10 plots), woodland (10 plots) and rain forest (6 plots). The trees in the inner megafan generally had lower canopy, lower number of species and higher tree density than the trees in the outer megafan. The size of individual plots in the inner and outer megafan are 0.1 and 1 ha, respectively.

Linear regression models for canopy height of the white-sand forest in the Viruá megafan, indicated by the coefficient of determination R2 obtained with either normalized difference vegetation index (NDVI) or the digital elevation model of the shuttle radar topography mission (DEM-SRTM), and both (P = P-test; AIC = Akaike's information criterion).

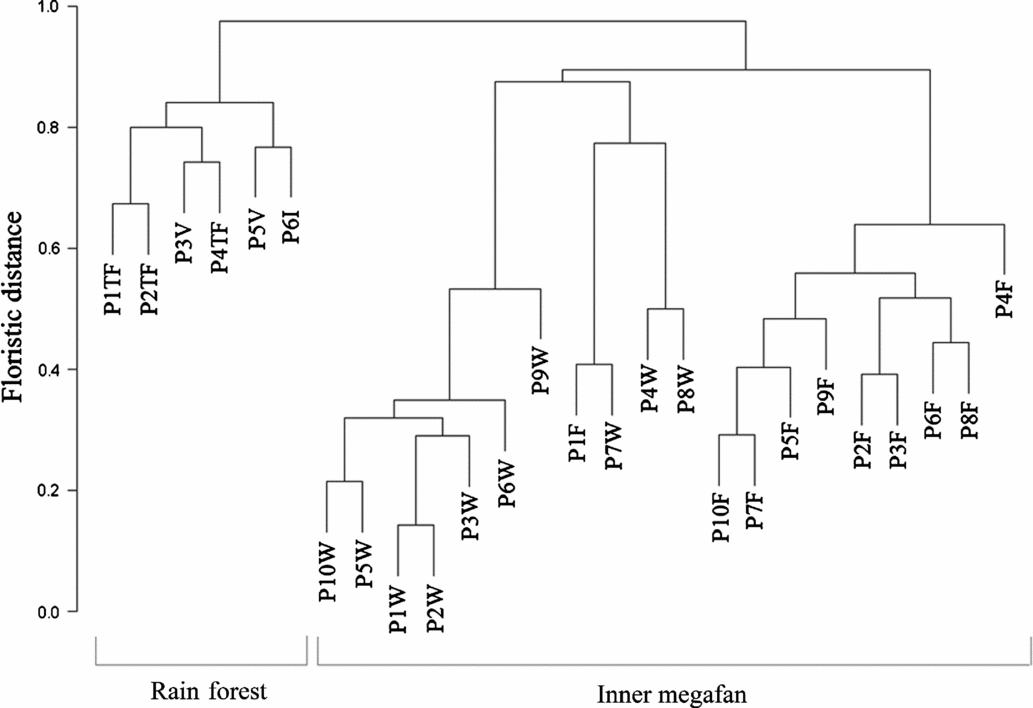
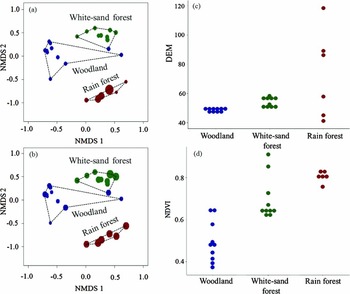
The UPGMA analysis indicated that the tree species from the outer and inner megafans formed two major clusters (Figure 3). The inner megafan presented two sub-clusters that distinguished all of the plots from forest and woodland, with only one forest plot (P1F) classified as woodland. The rain-forest vegetation shared a higher proportion of species, indicating a lower floristic distance among the groups. NMDS analysis using either DEM (Figure 4a) or NDVI (Figure 4c) further supported UPGMA clustering, white-sand woodland and forest vegetation from the inner megafan and the rain forest from the outer megafan. Interestingly, the NDVI provided the best separation among these classes (Figure 4c), consistent with the more uniform distribution of reflectance values within individual classes (circle sizes in Figure 4a, b) relative to DEM. This uniform distribution is even more evident comparing the graphic representation (Figure 4c, d), which increased the distance between classes using NDVI.
Dendrogram with clustering of vegetation types in the Viruá megafan and surrounding rain forest in northern Brazil. The dendrograms consider the twenty 0.1-ha plots on the white-sand vegetation from the inner megafan and six 1-ha plots in the rain forest from the outer megafan. This classification is based on unweighted-pair group method with arithmetic mean (UPGMA) analysis using Bray–Curtis dissimilarities with presence-absence data (P1 to P10 = floristic plots; TF = terra firme; V = várzea; I = igapó; W = woodland; and F = white-sand forest). This classification formed two main clusters, one joining all parcels sampled in the outer megafan and the other all parcels sampled in the inner megafan. Observe also that the inner megafan group separates into two sub-groups, one with the parcels from the white-sand forest and the other with the parcels from the white-sand woodland. The only exception is the parcel P1F, which was misleadingly grouped in the latter group, although it corresponds to a white-sand forest parcel.

Diagrams of floristic similarities for the Viruá megafan and surrounding rain forest in northern Brazil based on the number of tree species and their relation to remote sensing data. Ordination diagrams of the first two non-metric multidimensional scaling (NMDS) axes (a, b), with basis on their greatest variations (first axis = 50.6%; second axis = 27.2%) using digital elevation model (DEM) (a) and normalized difference vegetation index (NDVI) (b) values (circle = individual plot; circle size= NDVI and DEM values; and coloured circle = unweighted-pair group method using arithmetic mean (UPGMA) classification (green = white-sand forest; dark blue = woodland; red = rain forest). Distribution of DEM (c) and NDVI (d) values among the three analysed vegetation classes (c, d). Observe that the plots with all tree species formed three main clusters using either the DEM or NDVI, but the latter increased the distance between groups, as better illustrated by the diagram d.

Patches of white-sand forest
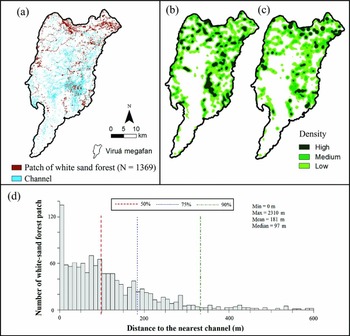
A total of 1369 patches of white-sand forest were mapped in the Viruá megafan (Figure 5a). These patches have individual areas up to 640 ha (mean of 586 ha), with 75% of the patches smaller than 4 ha and only ~10% of the patches larger than 10 ha. The largest patches were located in the north-east, at the megafan apex. This area contained a feeding channel, serving as a conduit through which sand, sourced from highland areas of the Precambrian crystalline basement rocks, was transported south-westward to form the megafan.
Channels and patches of white-sand forest in the Viruá megafan, northern Brazil. Hydrological map (modified from Zani & Rossetti Reference ZANI and ROSSETTI2012) with the patches over the channel network (modified from Cordeiro & Rossetti Reference CORDEIRO and ROSSETTI2015) (a). Map of the density of patches based on the number of patches (b) and areas of the patches (c) based on the Kernel estimation method. Distribution of the patches of white-sand forest within a range of 600 m of distance from the channels showing that most of the patches (i.e. ~50%) are located within a range of 100 m from the channels, with the highest concentration only 10 m distant from these features (d).

The distribution of the patches of white-sand forest within the Viruá megafan is parallel to channel morphologies (compare Figures 5a). The densities of these patches varied within the megafan (Figure 5b,c), concentrating to the east/north-east. The central-southern part of the megafan, with a higher concentration of intermittent and permanent active channels, also showed a high density of these patches. Nearly 90% of the patches were located less than 300 m from the channels, with half of the patches less than 100 m apart from these features. A total of 50% of the patches were located up to 98 m from the channels, while 75% of the patches were located 184 m and 90% of the patches were located 333 m from these features (Figure 5d). A total of 50% of the patches of white-sand forest were located up to 2.7 km from the nearest rain forest, while 75% of the patches were located up to 5.2 km and 90% of the patches were located up to 7.8 km from the nearest rain forest.
Considering only the plots of white-sand forest using floristic data, there was no significant relationship between the number of tree species and the number of channels (R2 = 0.001; P > 0.9) or the area of individual patches (R2 = 0.25; P > 0.13). In addition, the number of tree species was also not affected by the proximity to the rain forest from the outer megafan (R2 = 0.13; P > 0.3).
DISCUSSION
A comparison of the several tree data derived from the inner and outer megafan showed the main control exerted by this landform on the contemporaneous vegetation. For instance, this is shown by the conspicuous separation of tree species in the two major clusters obtained from the UPGMA analysis, as well as the perfect match of these clusters with the inner and outer megafan. The igapó, várzea and terra firme have moderate similarity in tree species composition, resulting in a single cluster. However, these classes display a higher degree of dissimilarity with species from the inner megafan, resulting in their grouping in a distant cluster (Figure 3). Notably, the species from this environment showed higher dissimilarity among white-sand forest and woodland as indicated by two subclusters that separated all of the plots. The only exception, represented by plot P1F which ambiguously joined the woodland cluster (Figure 3), reflects the low species diversity of this area, although its structure is similar to that of the white-sand forest. This plot might have been affected by fires, consistent with the observed local tree regrowth. Fire disturbance could have facilitated the colonization of this plot by pioneer and woodland trees likely representing an initial stage in white-sand vegetation succession. The success of the NMDS ordination diagrams based on the NDVI values (Figure 4) in the confirmation of the UPGMA result suggested that the clustering obtained for tree species from the inner and outer megafan does not reflect sampling artefacts, but is associated with differences in the forest structure with spectral responses. The two plots of woodland superposed with forest (Figure 4d) reflect the fact that these areas contain tree species with anomalously higher densities and heights (Table 1) than those from other plots of this same class. Similarly, the two outliers with the highest NDVI values from the white-sand forest have higher trees relative to the remaining plots of this group. Contrasts in temporal development reflecting differences in sedimentary stages inherent from the megafan evolution might explain these results.
The differences in tree composition comparing the inner and outer megafan environments are also remarkable and help in demonstrating the control exerted by this landform on the contemporaneous vegetation. The overall dominance of R. retusa (107) and the high number of S. guianensis and M. itauba in the white-sand forest of the inner megafan and near absence of these species in the outer megafan might reflect adaptation to areas initially more exposed to sunlight, where competition is likely lower than under the rain-forest environment. This interpretation is consistent with previous records of this species on white-sand substrates from other Amazonian areas (Habermann & Bressan Reference HABERMANN and BRESSAN2011, ter Steege & Zondervan Reference TER STEEGE, ZONDERVAN and ter Steege2000). However, L. heteromorpha, the second most abundant species in the inner megafan, is also common in the terra firme of the outer megafan. This occurs because this species has the advantage of changing from shrub to tree in areas of open or dense vegetation, respectively (Pereira Reference PEREIRA2013). Another key point concerning the tree composition in the inner megafan is the occurrence of only one or a few species from a limited number of families present in the outer megafan, primarily including Fabaceae and Chrysobalanaceae. These families are generally well represented in tropical regions (Rundel Reference RUNDEL, Stirton and Zarucchi1989), and are particularly abundant in South America, with the highest diversity in Amazonian areas. For example, Fabaceae are one of the 10 most important families in Amazonia (ter Steege et al. Reference TER STEEGE, PITMAN, PHILLIPS, CHAVE, SABATIER, DUQUE, MOLINO, PRÉVOST, SPICHIGER and CASTELLANOS2006) and Chrysobalanaceae comprises up to 10% of the trees in this region (Hopkins Reference HOPKINS2007). However, other common families in this region, such as Lecythidaceae, with nearly half of its species in Amazonia (Mori Reference MORI1990), were not observed in the inner megafan.
The influence of the megafan palaeo-landform on the distribution of the studied vegetation is further shown by the comparison of dbh and canopy height of tree species from the outer megafan rain forest and the white-sand forest. Hence, the outer megafan contained tree species that are more diversified and have a better-structured canopy than the inner megafan, as indicated by the higher number of species and higher dbh. These effects likely reflect the geological setting that provided a higher amount of nutrients favourable to the colonization of a wider tree spectrum. Several characteristics of the outer megafan environment might have contributed to this scenario, including: (1) terrain comprising low-grade metamorphic rocks from the Precambrian Guiana Shield or even the Plio-Pleistocene Içá Formation, a context that provided a long period for forest development; (2) varied lithological composition, which enhanced the potential for nutrients, reflecting the highest amount of chemical constituents from a diversified mineralogy; and (3) development of well-drained and well-structured areas of Oxisols. In contrast, the inner megafan is dominated by white-sand forest, which has lower and thinner trees than the rain forest. The presence of this dissimilar vegetation in the study area is related to several geological characteristics directly associated with the megafan evolution. First, the topographically low-lying terrain, caused by slow tectonic subsidence (Rossetti et al. Reference ROSSETTI, ZANI and CREMON2014b), might have been more affected by seasonal flooding. Second, the Viruá megafan consists of a widespread area characterized by the accumulation of high volumes of quartzose sands by distributary networks that remained active until the Late Pleistocene-Holocene (Rossetti et al. Reference ROSSETTI, ZANI, COHEN and CREMON2012a). Poorly drained, poorly structured and nutrient-poor soils developed in this terrain would have constrained the colonization of rain-forest species, despite the geographic proximity to the megafan palaeo-landform.
In addition, sand accumulation produced a triangular palaeomorphology with a gentle slope, which further constrained the white-sand vegetation to the megafan surface, consistent with reports of previous studies (Rossetti et al. Reference ROSSETTI, ZANI, COHEN and CREMON2012a, Zani & Rossetti Reference ZANI and ROSSETTI2012). The progressive increment in canopy heights toward the east/north-east of the study area supports the influence of the megafan topography on the growth of the white-sand forest. The data presented also suggest that this effect most likely reflects the topographic gradient of 15 cm km−1 from the megafan apex to the fringe, based on the analysis of the trend surface. According to the geometry that typifies megafan systems, proximal areas are slightly higher (Fielding et al. Reference FIELDING, ASHWORTH, BEST, PROKOCKI and SMITH2012, Hartley et al. Reference HARTLEY, WEISSMANN, NICHOLS and WARWICK2010, Nichols & Fisher Reference NICHOLS and FISHER2007), reflecting the aggradation of larger sand volumes, which occurs because these areas are located closer to main feeding channels responsible for transporting sediment into these systems. The proximal megafan areas are also generally the first ones to be abandoned when sedimentation ends. Thus, despite the overall similar sandy substrate throughout the Viruá megafan, the higher topography resulting from increased sediment aggradation, as reflected by the longer abandonment time of proximal depositional environments, might have generated more suitable conditions for tree colonization. The sedimentary dynamics of the proximal megafan would have lowered the water level, initiating the pedogenic processes and the establishment of tree roots. White-sand forests generally occur in areas with groundwater levels that are 0.4 to 1.0 m below the surface, enough to prevent rhizospheres from total flooding (Mendonça et al. Reference MENDONÇA, SIMAS, SCHAEFER, FILHOS, VALE and MENDONÇA2014). In contrast, the megafan fringes, located farther from the main sediment sources and at a lower elevation, had lower sediment aggradation rates and were abandoned at a later stage during the megafan evolution. Thus, these areas have lower elevations relative to proximal megafan areas and are, consequently, more influenced by seasonal flooding. Such an environmental constraint could explain the preferred development of grass and shrub vegetation toward distal megafan areas.
The analysis of the numerous patches of white-sand forest is in agreement with the proposed influence of the megafan sedimentary dynamics on tree distribution. This analysis showed that there is no relationship between the number of tree species of these patches and their areas, nor with their proximity to the surrounding rain forest. However, although there is also only a moderate relationship between the number of tree species and the number of channels, these features might be crucial for the development of the white-sand forest, as reflected by the fact that these patches are not randomly distributed, but are often aligned parallel and close to channels or palaeochannels, suggesting an origin associated with these megafan sub-environments. Considering that the rise of groundwater during rainy seasons creates anaerobic conditions in the soil that prevents root respiration (Pires & Prance Reference PIRES, PRANCE, Prance and Lovejoy1985), it is likely that micromorphologies associated with sedimentation in various megafan sub-environments would favour the development of the white-sand forest. Channelized systems, such as this one, display many sub-environments (i.e. sand bars, levees, islands and crevasse splays) that constitute positive reliefs of a few metres or even centimetres higher than the surrounding terrain. Additionally, sands that are exposed at the megafan surface formed aeolian dunes that further imposed topographic heterogeneities to this terrain. Although smooth, these positive morphologies, abundant in megafans as a result of the unstable nature of their distributary drainage (Slingerland & Smith Reference SLINGERLAND and SMITH2004), contributed to the maintenance of some sites free from the influence of the water table longer throughout the year. Thus, tree colonization was preferentially concentrated in these areas, forming white-sand forest patches.
Therefore, among all factors, hydrology controlled by topographic gradients reflecting the evolution of the various depositional sub-environments of the Viruá megafan is perhaps the most relevant factor explaining the highest concentration and greater heights of trees in the proximal megafan areas, opposed to distal areas dominated by grass and shrub vegetation. Publications have previously highlighted the importance of hydrology on the stratification of the Viruá white-sand vegetation (Damasco et al. Reference DAMASCO, VICENTINI, CASTILHO, PIMENTEL and NASCIMENTO2013, Gribel et al. Reference GRIBEL, FERREIRA, COELHO, SANTOS, RAMOS and SILVA2009, Mendonça et al. Reference MENDONÇA, SIMAS, SCHAEFER, FILHOS, VALE and MENDONÇA2014). However, the realization that the distribution of vegetation types is directly dependent on the megafan morphology, as discussed herein, is an innovative model. A tenuous hydrological balance reflecting micromorphologies imposed by environmental heterogeneities was key to the development of patches of forest in the Viruá megafan. The influence of sedimentary dynamics on the distribution of vegetation patterns along the Viruá megafan, as proposed here, is a useful model to also explain the white-sand vegetation that typifies the Negro-Branco River basins in the northern Amazonian lowland, as such vegetation types in this region are also associated with fan-shaped palaeo-landforms reflecting megafan depositional systems similar to the Viruá megafan (Rossetti et al. Reference ROSSETTI, BERTANI, ZANI, CREMON and HAYAKAWA2012b, Reference ROSSETTI, ZANI and CREMON2014b).
CONCLUSION
In contrast to previous studies emphasizing climate as the main factor influencing plant dissimilarity in Amazonia, the present survey consisting of field floristic inventories and remote-sensing modelling, integrated with pre-existing geological and geomorphological data, indicates sedimentary dynamics as the main factor controlling the establishment and distribution of the various types of white-sand vegetation in the study area. A main conclusion is that the evolution of a megafan depositional system in a relatively recent geological time disturbed the environment to generate a nutrient-poor sandy substrate undergoing seasonal flooding. This constituted a barrier to the colonization of rain-forest species and favoured the presence of various types of white-sand vegetation within a unique ecological context. In addition, the distribution of the various types of white-sand vegetation in the study area is directly dependent on topographic gradients imposed by the overall gently dipping megafan morphology. The tenuous hydrological balance reflecting micromorphologies imposed by environmental heterogeneities was key to the development of patches of forest in the Viruá megafan. The main conclusions of this study can help undertake further investigations to understand many other widespread areas of white-sand vegetation that are associated with megafan depositional systems in the northern Amazonian wetland.
ACKNOWLEDGEMENTS
This research was funded by the Research Funding Institute of the State of São Paulo-FAPESP (Projects #2010/09484-2 and #13/50475-5). The authors are also grateful to Antonio Lisboa and Beatriz Lisboa from the Chico Mendes Institute for Biodiversity Conservation- ICM-Bio, for helping with the logistic support during the fieldwork in the Viruá National Park. The acknowledgements are extensive to Dr Gabriel Damasco, for the numerous corrections and suggestions that helped to improve the early version of this manuscript.