


Introduction
Ikaite (CaCO3•6H2O) is a hydrated calcium carbonate polymorph that is generally found in cold and saline conditions (e.g. Reference PaulyPauly, 1963). The precipitation of calcium carbonate during the formation of polar sea ice was a controversial subject for decades and has only recently been shown to really occur (Reference DieckmannDieckmann and others, 2008, and references therein). Dieckmann and co-workers were the first to report the occurrence of ikaite in Antarctic sea ice (Reference DieckmannDieckmann and others, 2008) and shortly after in Arctic sea ice (Reference DieckmannDieckmann and others, 2010). Low-temperature and high-salinity conditions during sea-water freezing and brine formation in sea ice lead to supersaturation for ikaite and subsequent precipitation of ikaite crystals in sea-ice brine.
So far little is known about the fate of ikaite if the sea ice starts to melt. Two scenarios are possible: (1) during the sea-ice melt season, an increase in ice temperature and decrease in brine salinity could induce dissolution of ikaite crystals; or (2) ikaite crystals could be rejected from the melting ice to the underlying water column, which could affect the carbonate chemistry in underlying sea water (Reference Fransson, Chierici, Yager and SmithFransson and others, 2011). The precipitation/dissolution of ikaite crystals in sea ice could be an important contributor to the atmosphere-sea-ice-ocean carbon cycle in polar seas throughout sea-ice formation/melting processes (Reference Rysgaard, Glud, Sejr, Bendtsen and ChristensenRysgaard and others, 2007).
Thus far the quantification of ikaite in sea ice has been examined by measuring the weight of the ikaite crystals (Reference DieckmannDieckmann and others, 2008), by measuring the calcium concentration after dissolution of ikaite crystals (Reference FischerFischer and others, 2012) and by analyzing the carbonate system in melted ice/brine samples (Reference Rysgaard, Glud, Sejr, Bendtsen and ChristensenRysgaard and others, 2007; Reference Fransson, Chierici, Yager and SmithFransson and others, 2011; Reference GeilfusGeilfus and others, 2012). Reference DieckmannDieckmann and others (2008, Reference Dieckmann2010) described the typical morphology of ikaite crystals and based part of the phase identification on morphological grounds. However, to date, a detailed morphometric characterization of ikaite crystals found in polar sea ice is lacking.
In this study, we examine the shape and size distribution of ikaite crystals in Arctic first-year sea ice based on image analysis. A detailed characterization of crystal shape and size will provide important information to identify the environmental conditions and history leading to the formation/dissolution of ikaite crystals in polar sea ice. Additionally, total alkalinity (TA) was used as a simple indicator to quantify precipitation/dissolution.
Materials and Methods
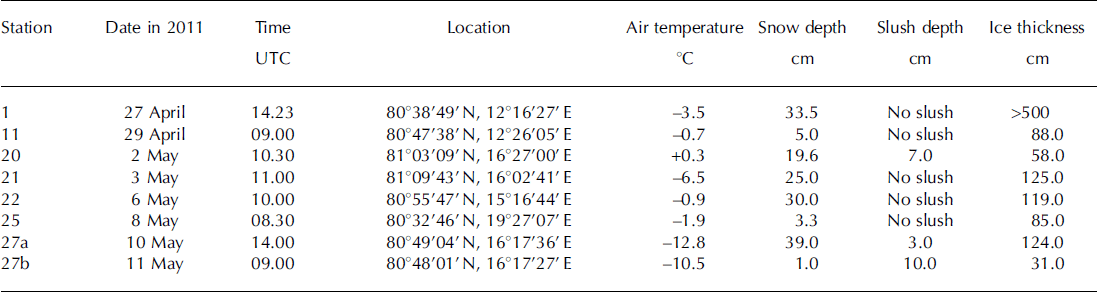
Sea-ice field observations were carried out at eight sea-ice stations on first-year Arctic pack ice at the spring melt onset north of Svalbard from 27 April to 11 May 2011 (Fig. 1; Table 1) during the Norwegian Polar Institute’s Centre for Ice, Climate and Ecosystems (ICE) cruise on R/V Lance.
Location map of the sampling area north of Svalbard.

Sampling date, time, location, air temperature, snow and slush depths and ice thickness at sampling stations
Snow and slush samples were collected using a clean polycarbonate shovel and transferred into polyethylene zip-lock bags. Snow and slush temperature was measured using a needle-type temperature sensor (Testo 110 NTC, Brandt Instruments, Inc., USA).
Sea-ice samples were collected using an ice corer with an inner diameter of 9cm (Mark II coring system, KOVACS Enterprises, Inc., USA). Immediately after sea-ice collection, ice temperature was measured by inserting a needle-type temperature sensor into holes drilled at 5–10cm intervals into the core. Thereafter, a second ice core for ikaite crystals was collected within 10 cm of the temperature core and cut into 5–10cm thick sections with a stainless-steel saw. The ice sections were placed in polyethylene zip-lock bags. At station 21, a third core for measurements of ice algal pigments and phosphate concentrations was collected within 10 cm of the ikaite core and cut into 3–20 cm thick sections, which were transferred into polyethylene zip-lock bags and stored in the dark in a large cooler box.
Brine samples from sea ice were obtained at station 21 using the sack hole method (e.g. Reference Gleitz, Van der Loeff, Thomas, Dieckmann and MilleroGleitz and others, 1995). Sack holes were made using an ice corer as described above for ice coring. A 25–50cm deep hole in the sea ice was covered with a 5 cm thick urethane lid to reduce heat and gas transfer across the brine-atmosphere interface. After the brine accumulated at the bottom of the hole over a period of ∼10–15 min, the brine was sampled with a diaphragm pump (EWP-01, As One Corporation, Japan) and collected into a 100 mL polypropylene bottle (I-Boy, As One Corporation, Japan) for measurement of salinity and a 120 mL amber glass vial (Maruemu Co. Ltd, Japan) for measurement of TA. Brine temperature was measured in situ after the sampling of brine by the same sensor as described above for ice cores.
A detailed account of ikaite sample treatment is provided by Reference DieckmannDieckmann and others (2008). Briefly, once back on board, snow, slush and sea-ice samples were immediately transferred into a refrigerator (+4°C) for melting. The melting process was checked regularly. During the final melt phase, samples were swirled until the last pieces of ice had melted. This ensured that the sample remained at a temperature of ∼0°C throughout the melting process of 2–3 days. The melted ice samples were transferred from polyethylene zip-lock bags into 1000 mL Nalgene polycarbonate containers (Thermo Fisher Scientific, USA). In order to examine the presence/absence of ikaite crystals in the samples, the meltwater was stirred in the container to induce a vortex. Ikaite crystals, if present, accumulated in the centre of the container and could be detected by eye. When present, the ikaite crystals were sampled with a pipette and filtered over 0.4 μm polycarbonate filters (Millipore, USA) under low vacuum, not exceeding 200 mbar. The filter was placed in a 2 mL Nalgene cryovial (Thermo Fisher Scientific, USA) with 75% cold ethanol and stored at –80°C. Photographs of ikaite crystals were taken with a stereomicroscope (Model M205C, Leica Microsystems, Germany) prior to filtration.
For TA measurements, the supernatant of the remaining melted snow, slush and sea-ice samples was transferred to a 120 mL amber glass vial.
Once on board, sea-ice samples for ice algal pigment and phosphate were transferred into light-proof ice-core boxes and thawed at +4°C. After thawing, meltwater was filtered onto Whatman GF/F glass-fiber filters under low vacuum. For ice algal pigment, filters were placed in a 2 mL Nalgene cryovial (Thermo Fisher Scientific, USA), shock-frozen in liquid nitrogen and stored at –80°C. For phosphate measurements, the filtered water was transferred into a double-rinsed 50 mL polypropylene tube (VWR, Germany) and stored at –20°C until analysis.
The salinities of the brine and melted snow, slush and sea ice were measured with a conductivity sensor (Cond 315i, WTW, Germany). The TAs of the brine and melted snow and sea ice were measured with a titration system (TitroLine alpha plus, SI Analytics GmbH, Germany). The TA measurements were calibrated using an in-house standard (North Sea water collected offshore of Helgoland) traceable to the Certified Reference Material (Batch 111) (Scripps Institution of Oceanography, USA). Ice algal and phytoplankton photosynthetic pigments (chlorophyll ä) were measured according to Reference Hoffmann, Peeken, Lochte, Assmy and VeldhuisHoffmann and others (2006) by high-performance liquid chromatography (HPLC) with a Waters 600 controller (Waters Corporation, USA).
Phosphate concentrations were determined with an autoanalyzer system (Quaatro, SEAL Analytical, Ltd, UK, method Q-031-04 Rev.2) according to the Joint Global Ocean Flux Study (JGOFS) spectrophotometric method (JGOFS, 1996). The analyzer was calibrated from 0 to 3mmolL−1 with standard reference materials for nutrient analysis (CertiPUR, Merck, Germany) and checked with spiked low-nutrient sea water (LNSW) provided by OSIL, UK.
Phase identification for the ikaite crystals was undertaken using a WITec alpha 300 R (WITec GmbH, Germany) confocal Raman microscope. Ikaite crystals stored in a freezer (–20°C) were transferred to a glass Petri dish in the cold room (+4°C) and immediately set to the microscope to keep cool during the investigation (within 2–3 min). Photographs of the ikaite crystals were also taken under the stereomicroscope (SteREO Discovery V12, Carl Zeiss Microscopy Co. Ltd, Germany).
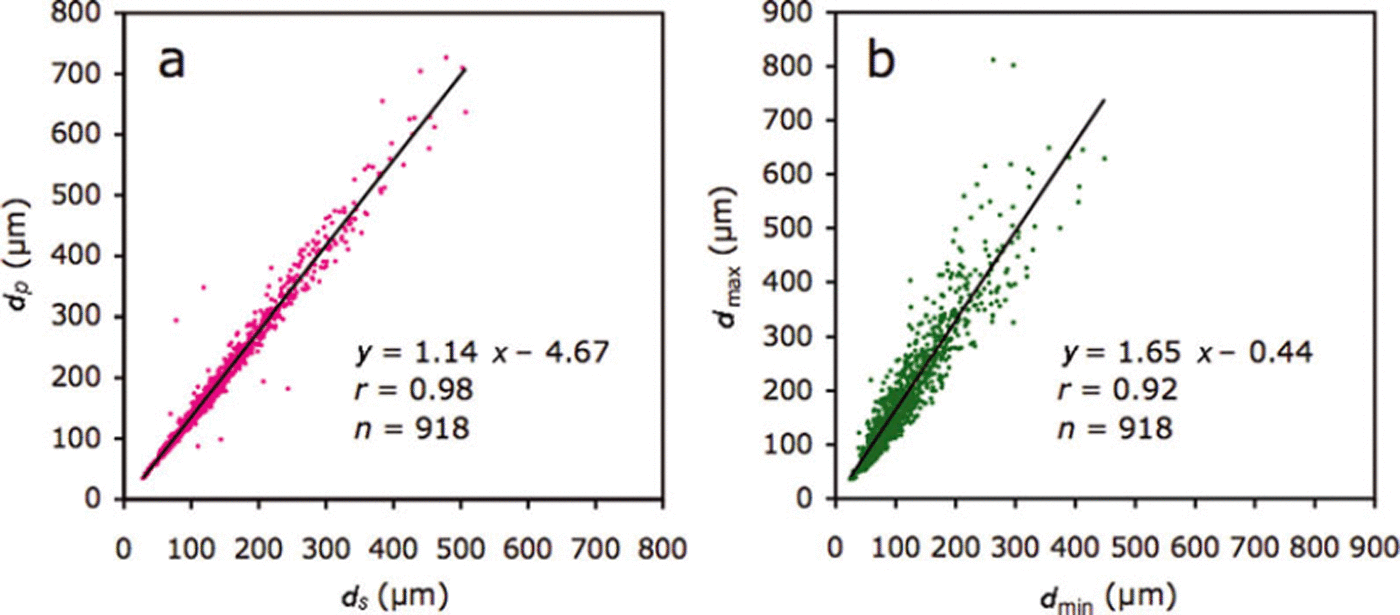
The image-analysis program ImageJ (software version 1.45s, Wayne Rasband, National Institutes of Health, USA; http://rsb.info.nih.gov/ij) was used to investigate the shape and size of the ikaite crystals from micrographs (Fig. 2). The surface area (S), perimeter (P) and maximum/minimum caliper diameters (dmax/dm in ) were determined for each crystal. The diameter of a circle that has the same area, ds=(4S)1/2, and the same perimeter, dP = P/π as the crystal was calculated. Relationships between dS and dP are measures of deformation of the crystals and have been used previously in a sea-ice floe study (e.g. Reference Toyota, Takatsuji and NakayamaToyota and others, 2006).
(a) Photographic image of ikaite crystals in slush. Owing to the overlap of ikaite crystals (a), ImageJ software could not extract each crystal. Therefore, each crystal was outlined by visually drawing a red line around its perimeter (b) and moved to eliminate the overlap between crystals (c). Each crystal was then colored red and extracted according to its brightness using ImageJ. Note that crystals touching the edge of the image were excluded from the analysis.

Results
Air temperature ranged from –12.8°C to +0.3°C during the sampling time (Table 1). Air temperatures measured continuously at 30s intervals during the study period (27 April–11 May) over R/V Lance indicated that the mean air temperature was –5.3 ±4.4°C.
A slush layer had developed at the snow-sea-ice interface at stations 20, 27a and 27b (Table 1). Snow accumulation over sea ice leads to the formation of a slush layer below sea level (Reference Haas, Thomas and BareissHaas and others, 2001). In this study, slush was generally observed at stations with high snow depth/low ice thickness (Table 1).
Snow and slush depth ranged from 1.0 to 39.0 cm for all stations and 3.0 to 10.0 cm for stations 20, 27a and 27b, respectively (Table 1). Ice thickness ranged from 31.0 to 125.0 cm, with the notable exception of >500.0 cm at station 1 (multi-year or rafted ice). Generally, slush was observed at stations with high snow depth/low ice thickness (Table 1).
Mean temperature ranged from –5.3°C to –0.4°C for snow, –2.8°C to –1.5°C for slush (–3.9°C for brine) and –4.2°C to –0.8°C for sea ice (Table 2). For sea ice, temperatures at the top of the core were generally lower than those at the middle and bottom of the core.
Mean (range) temperature and salinity for sampled snow, slush (brine) and sea ice
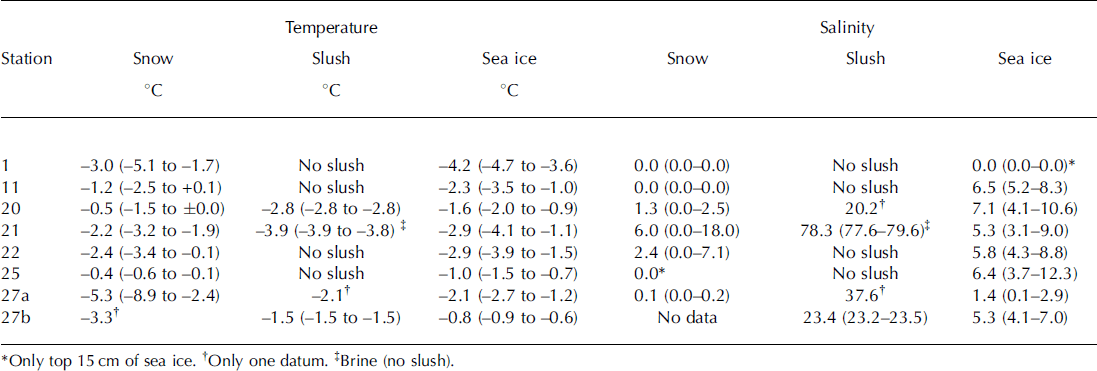
Mean salinity ranged from 0.0 to 6.0 for snow, 20.2 to 23.4 for slush layers and 0.0 to 7.1 for sea ice (Table 2). In general, slush salinity was higher than snow and sea-ice salinity. Extremely high salinity (78.3) was measured for the brine samples at station 21 (Table 2).
Phase identification of collected crystals with a confocal Raman microscope confirmed that the crystals found during the cruise were indeed ikaite. The general appearance of ikaite crystals is shown for the slush sample collected at station 20 (Fig. 2a). Similar images of ikaite crystals were obtained from other stations.
During the study period, a total of 96 samples of melted snow (n = 13), slush (n = 5) and sea ice (n = 78) were checked for the presence of ikaite crystals. We found ikaite crystals in 32 samples (one-third of all samples). Ikaite was more often found in sea-ice samples (n = 26) than snow (n = 4) and slush (n = 2) samples. The highest numbers of crystals were found in samples from the bottom of snow, slush layers at the ice-snow interface (e.g. Fig. 2a) and the topmost part of sea ice, while only small amounts were discovered in the remaining samples, especially in the down-core samples where crystals were virtually absent.
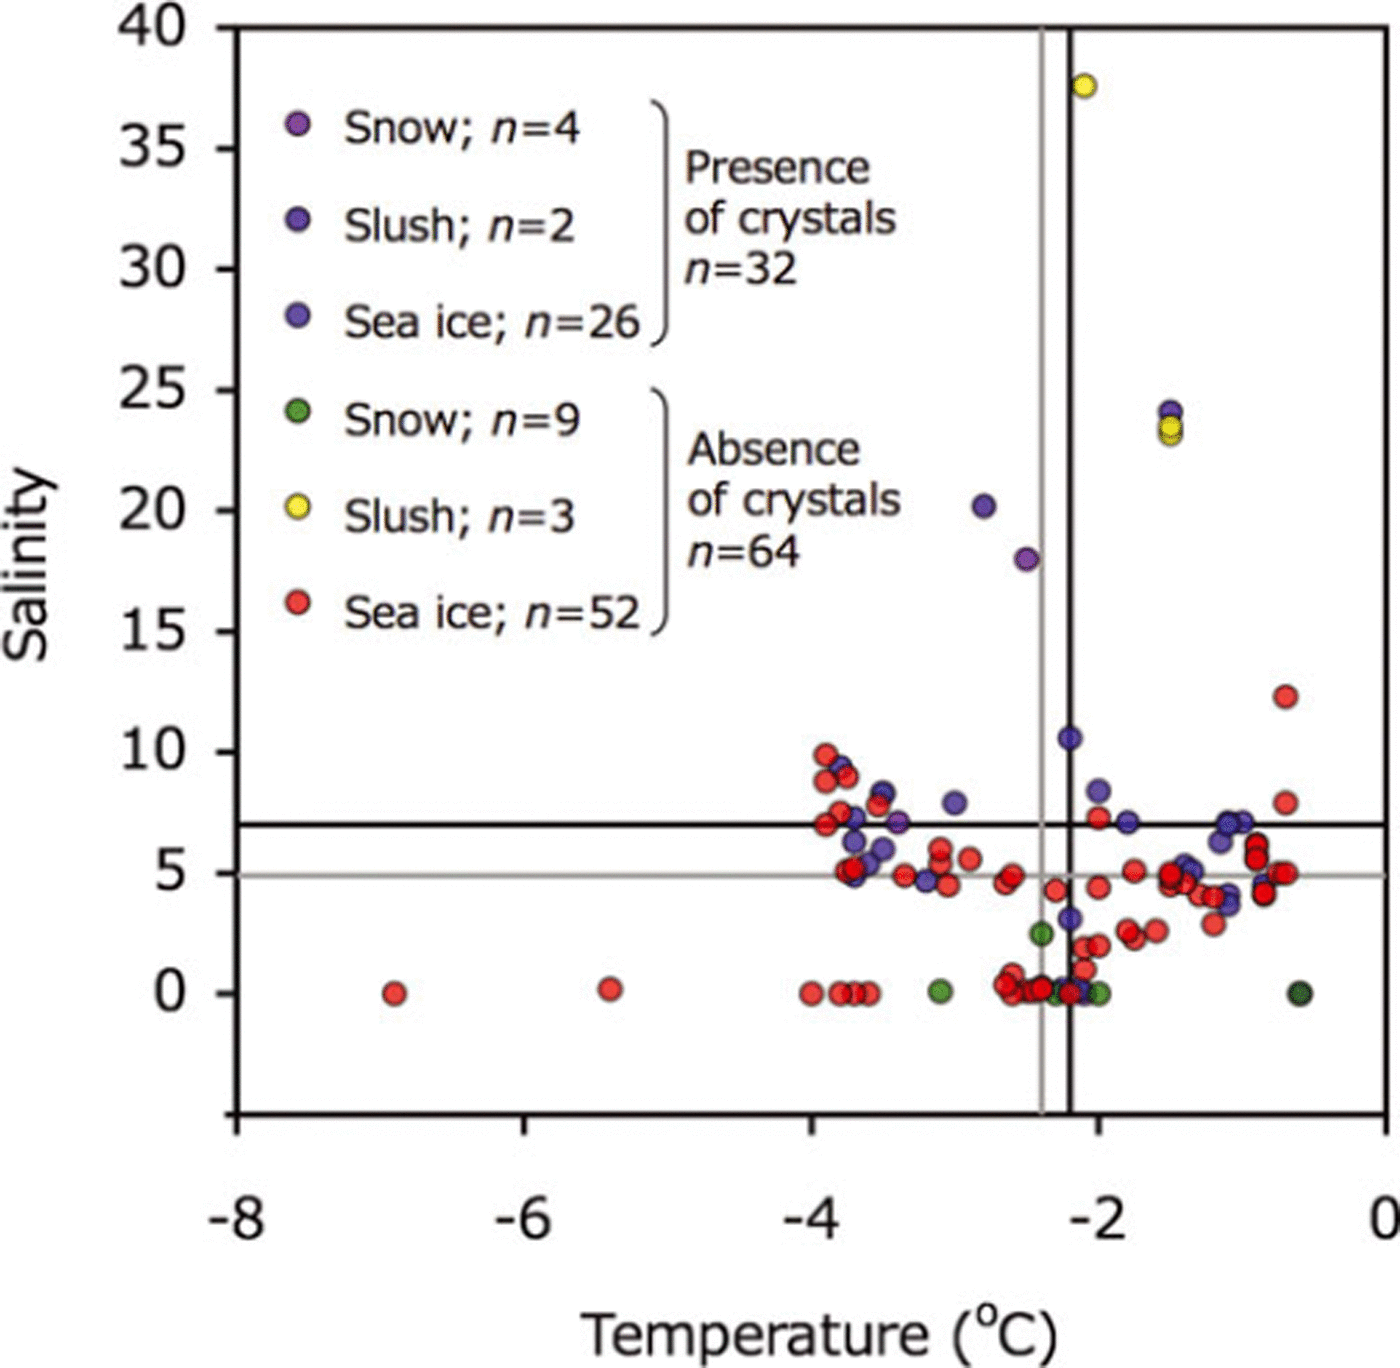
Temperature and salinity deviated widely and there was no clear relationship between the two for presence/absence of ikaite crystals (Fig. 3). The average temperatures of samples containing ikaite crystals and those lacking crystals were very similar: –2.2±1.1°C and –2.4±1.2°C, respectively (Fig. 3). The average salinity was 7.0±5.3 for samples with crystals and 4.9±6.1 for samples without.
Relationships between temperature and salinity for melted snow, slush and sea-ice samples. Symbols are shown for presence and absence of ikaite crystals. Black and gray lines indicate the mean value for presence and absence of ikaite crystals, respectively.
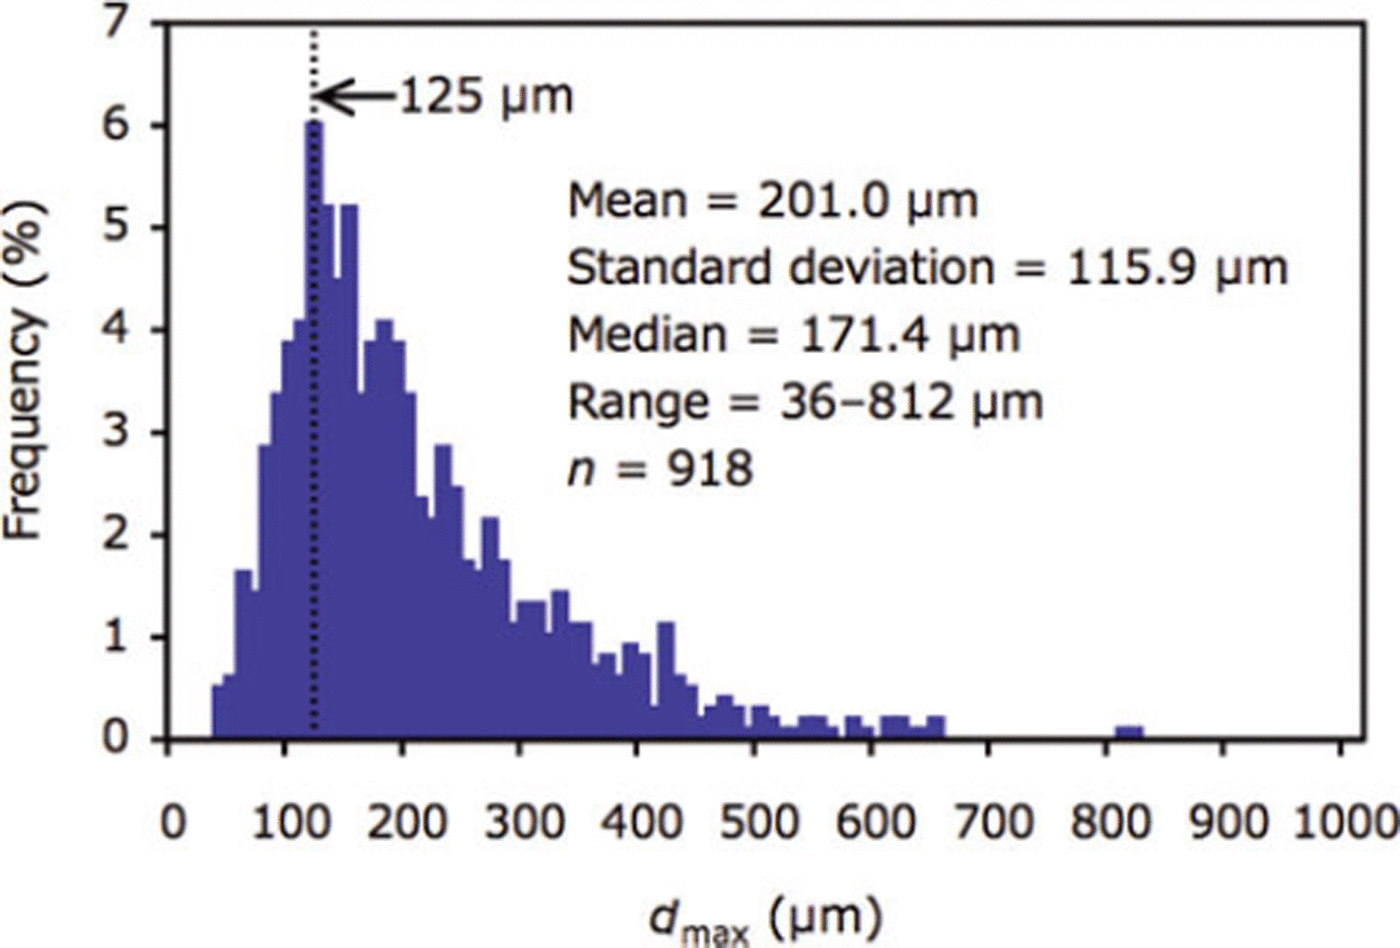
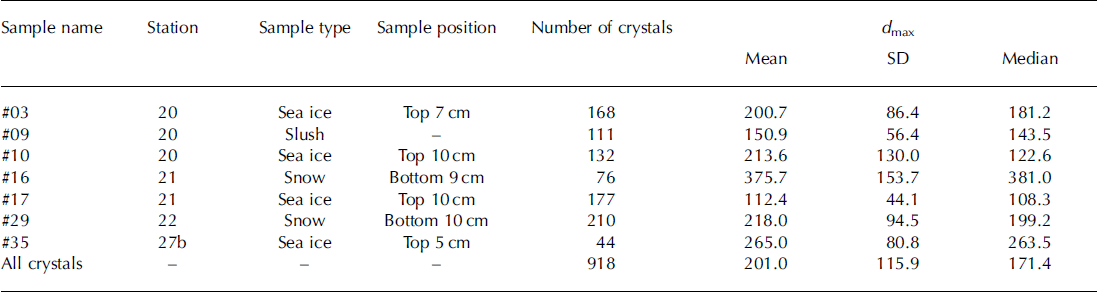
Mean and median of dmax ranged from 112.4 to 375.7 pm and 108.3 to 381.0 μm between stations (Table 3). For all crystals (n = 918), mean and median of dmax were 201.0 and 171.4 pm, respectively (Table 3; Fig. 4). The mode of the size distribution for dmax was 125.0 μm (Fig. 4). No relationships were found between dmax (mean) and parameters (r=0.5, p = 0.3 for ice temperature; r=0.4, p = 0.5 for air temperature; r=0.3, p=0.6 for salinity; r=0, p=0.9 for ice thickness; r=0, p=0.8 for snow thickness).
Size distribution of dmax for all ikaite crystals (n = 918) examined in this study.
Mean, standard deviation (SD) and median for d max (μm) of ikaite crystals
The slope of the relationship between dS and dPand d min and dmax for all crystals (n = 918), of 1.14 and 1.65 respectively (Fig. 5), represents the deformation ratio in the former and the aspect ratio in the latter.
Relationships between (a) dS and dP and (b) dmax and dmin. dS and dP indicate the diameters based on the area and perimeter, respectively. dmax and dmin indicate maximum and minimum caliper diameters, respectively.
Bulk ice/snow TA tended to decrease with depth, from 1238.9 μmol L−1 at the bottom of the snow to 305.7 μmol L−1 at the bottom of the sea ice (Fig. 6). For the upper parts of the snow, bulk TA was almost zero (12.8μmol L−1). Bulk ice/snow salinity also tended to decrease with depth, from 18.0 at the bottom of the snow to 4.0 at the bottom of the sea ice. For the upper parts of the snow, salinity was zero. Bulk ice/snow TA and salinity profiles showed very similar trends except for the bottom of snow and the top 25 cm of sea ice (Fig. 6).
Depth profiles for the bulk ice/snow TA (blue) and salinity (red) in snow and sea ice at station 2 1.

Bulk ice/snow TA was normalized to a salinity of 5.4, the mean value of bulk ice/snow salinity. The normalized TA (n-TA) was constant (410.3 ± 10.0 μmol L−1) for the middle and the bottom parts of the sea ice, while it deviated more than 39 μmol L−1 from the mean values (410.3μmol L−1) for the bottom of snow and the top 25 cm of sea ice.
Chlorophyll-a concentrations at station 21 were <0.3 μg L−1 throughout the core, except for the bottom 3 cm (5.8 μg L−1). Phosphate concentrations were <0.12 mol L−1 throughout the core.
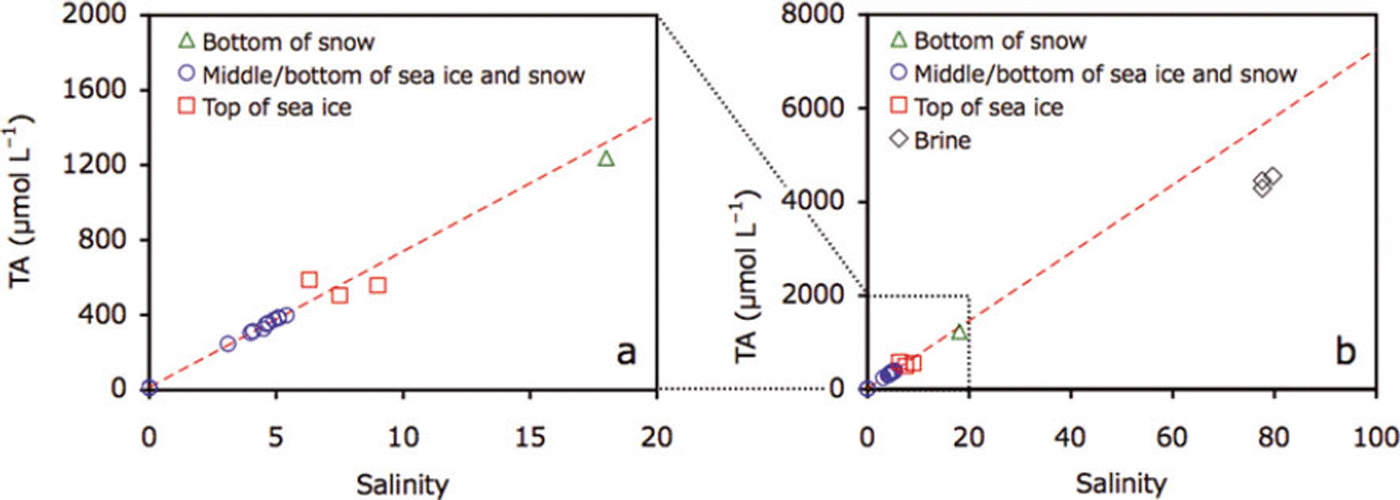
For the middle and the bottom parts of the sea ice and upper parts of the snow, bulk ice/snow TA and salinity were highly correlated (r=0.99, p<0.0001; Fig. 7a). Data points for the bottom of the snow and the top of the sea ice deviated from this regression line (Fig. 7a). Brine TA was considerably higher (4440.3 ± 132.5 μL−1) and located below the regression line (Fig. 7b).
Plots of (a) TA and salinity for snow and sea ice at station 21 and (b) addition of brine data to (a). Dotted red line represents the regression of data points from the middle and the bottom of the sea ice and the top of the snow (blue circles).
Discussion and Conclusion
Comparison of the images taken of the ikaite crystals in this study with those from previous studies in Antarctic sea ice (Reference DieckmannDieckmann and others, 2008; Reference FischerFischer and others, 2012) and Arctic sea ice (Reference DieckmannDieckmann and others, 2010) indicates that they share a similar morphology.
Generally, cold and saline conditions favor the precipitation of ikaite crystals in the natural environment (e.g. Reference Omelon, Pollard and MarionOmelon and others, 2001). The lowest temperatures are generally measured at the top of the sea-ice cover, closest to the cold atmosphere, leading to the formation of the highest brine salinity through the sea ice. Therefore, ikaite crystals were most frequently found at the top of sea ice (Reference DieckmannDieckmann and others, 2008, Reference Dieckmann2010; Reference FischerFischer and others, 2012). Additionally, the slush layer formation observed during the study period supplied sea water to the top of the sea ice and likely enabled ikaite precipitation in the slush, snow and sea ice when the temperature decreased. On the other hand, for the warm sea ice, sea-water supply to the top of sea ice leads to the undersaturation for ikaite due to a dilution effect. Therefore, ikaite crystals tend to dissolve.
Temperature and salinity relationships showed no significant difference between samples with and without ikaite crystals. During the sampling period, snow and sea-ice temperatures were relatively high and it is reasonable to assume that ikaite crystals tend to dissolve during the spring melt onset. Therefore, relationships between temperature and salinity measured during the study period did not reflect the physico-chemical conditions that prevailed when the precipitation of ikaite occurred. This is one reason why we did not detect significant differences in temperature and salinity conditions for samples with and without ikaite crystals (Fig. 3). Our results suggest that knowledge of the sea-ice growth history, particularly low temperatures during the freezing season, will be important in elucidating the conditions for ikaite formation because brine salinity is strongly driven by brine temperature (e.g., Reference Eicken, Thomas and DieckmannEicken, 2003), which in turn will determine precipitation.
Most ikaite crystals were roughly elliptical to elongate in shape (Figs 2 and 5). Reference DieckmannDieckmann and others (2008) reported that the shape of ikaite crystals varied from almost idiomorphic to xenomorphic and some were apparently constrained by the dimensions of the brine channel network. The size range for the ikaite crystals obtained in this study (36–812 μm) is consistent with that for Antarctic sea ice (<5–600 μm; Reference DieckmannDieckmann and others, 2008). Although crystal size was not quoted, light micrographs of ikaite crystals in Arctic sea ice (fig. 2 in Reference DieckmannDieckmann and others, 2010) showed a similar size range to that obtained in this study. At the saline spring discharge, much larger sizes of ikaite crystals (up to 5000 μm) were observed (Reference Omelon, Pollard and MarionOmelon and others, 2001) although the water quality and environmental conditions were much different from those of sea ice. Therefore, like the shape of the ikaite crystals (e.g. Reference DieckmannDieckmann and others, 2008), the size of the crystals in sea-ice systems might also be restricted by the size of the brine channel and pockets.
Comparison of TA and salinity profiles suggests that precipitation/dissolution of ikaite crystals occurred at the bottom of snow and in the top parts of the sea ice and brine, where ikaite crystals were found. Additionally, deviations of n-TA, for the bottom of snow and the top parts of the sea ice, from the mean values for the middle and bottom parts of the sea ice also suggest precipitation/dissolution of the ikaite crystals at the bottom of snow and in the top parts of the sea ice. During calcium carbonate precipitation, TA decreases (Reference Zeebe and Wolf-GladrowZeebe and Wolf-Gladrow, 2001). Therefore, TA and salinity relationships can be useful indicators for the precipitation/dissolution of ikaite crystals: the precipitation of ikaite crystals leads to a decrease in the TA:salinity ratio (n-TA) (data points would be below the regression line given in Fig. 7). Although the dissolution of ikaite crystals leads to an increase in n-TA, the dissolution of all ikaite crystals previously formed in a given depth of sea ice would compensate changes in alkalinity (data points would stay on the regression line given in Fig. 7). However, one data point above the regression line (Fig. 7a) suggests excess dissolution of ikaite crystals transferred from adjacent parts of the sea ice. The well-developed brine channel network during the spring melt onset could facilitate ikaite transport.
In addition to the precipitation/dissolution of calcium carbonate, biological activity also alters TA (Reference Zeebe and Wolf-GladrowZeebe and Wolf-Gladrow, 2001). The largest deviations in TA and salinity were observed at low chlorophyll-a concentrations at the surface of sea ice, while TA and salinity were not deviated at high chlorophyll-a concentrations measured in the bottom 3 cm of the core. These results suggest that the effect of biological activity on TA was minor for the sea-ice system in this study.
Relationships between TA and salinity were used to quantify ikaite concentrations in sea ice and snow. Deviation of TA from the regression line was used as a measure for the amount of ikaite crystals in sea ice and snow. We have calculated ikaite concentrations at the bottom of snow and the top of sea ice, except for the one data point from the top of sea ice where the plot was above the regression line. Ikaite concentrations (expressed as mg ikaite L−1 of melted samples) ranged between 5.6 and 11.3 mgL−1. Our values fall within the range reported by previous studies on Antarctic sea ice (0–19.4 mg L−1: Reference DieckmannDieckmann and others, 2008; 0.01–126mgL−1: Reference FischerFischer and others, 2012). Previous maximum values were higher than those reported in this study.
The variation in ikaite concentrations reported so far for polar sea ice can be explained by different scenarios. Since the ice-melting season had already started when this study was conducted, ikaite crystals may already have begun to dissolve, which might explain the lack of a relationship between ikaite crystal size and sea-ice parameters (temperature, salinity, and thickness of snow and ice). It is also possible that differences in ikaite concentration are related to differences in the sea-water (brine) composition. It has been reported that high concentrations of phosphate favor the precipitation of ikaite (Reference Bischoff, Fitzpatrick and RosenbauerBischoff and others, 1993). In this study, phosphate concentrations were almost zero (<0.1 μmol L−1) in the top parts of the sea ice. However, sea-ice growth history, especially ice temperature, can be expected to be the most important driving force behind ikaite precipitation (dissolution) in sea ice. Without knowing this parameter exactly over time, it is difficult to determine why ikaite concentrations reported so far (this study; Reference DieckmannDieckmann and others, 2008; Reference FischerFischer and others, 2012) differ. A solid quantification of ikaite formation in polar sea ice requires investigations in which the temperature and other physico-chemical parameters are determined from the beginning of ice formation until the time of sampling.
Acknowledgements
We thank the crew of R/V Lance, N. Koc, H. Hop, A. Sundfjord, M. Lenau and all the members of the ICE11-3 cruise for support in conducting the fieldwork. We thank J. Holscher for support in the TA analyses. This work was supported by the Centre for Ice, Climate and Ecosystems (ICE) at the Norwegian Polar Institute and the Fram Centre. G.N. and G.D. were supported by the Deutsche Forschungsgemeinschaft by grant NE 1564/1-1 (SPP 1158).



