I. INTRODUCTION
Many approaches have been presented in the scientific literature dealing with compact models of field effect transistors (FETs) based on pulsed drain current versus voltage (pulsed IV) characteristics (e.g. [Reference Parker and Rathmell1–5]). This kind of curve is obtained through low-duty-cycle narrow-width pulsed periodic gate and drain excitations, so that every measured IV curve sample ideally corresponds to a fixed channel temperature operation and to a frozen-like state of trapped charges (e.g. [6–Reference Collantes, Ouarch, Chi, Sayed and Quere14]).
Although this kind of characterization seems to work well in association with GaAs technologies, some doubts have been raised recently when considering GaN-based transistors, due to specific properties of the charge trapping dynamics in GaN on SiC devices [Reference Santarelli, Cignani, Di Giacomo, D'Angelo, Niessen and Filicori15, Reference Jardel16]. Because of this reason, some nonlinear models have been proposed, which avoid the use of pulsed I/V curves, but nevertheless take into account dispersive phenomena (e.g. [Reference Santarelli and Di Giacomo17]). Low-frequency source/load-pull methods represent another viable alternative [Reference Raffo, Di Falco, Vadala and Vannini18]. However, pulsed characterization is also undoubtedly suited for I/V curve tracing due to its dynamic isothermal nature. For this reason, in our opinion the matter is worthy of further investigation as to how and whether the associated limitations can be overcome.
In this paper, field effect devices both in GaAs and GaN technologies are explored through a pulsed measurement system, first introduced in [Reference Santarelli, Cignani, Niessen, D'Angelo, Traverso and Filicori19]. This is specifically dedicated to the characterization of dispersive phenomena related to thermal and charge trappings in III–V compound semiconductor FETs, but it can also be more generally used in different contexts (e.g. other semiconductors testing). Specific requirements for the pulsed periodic excitation are reviewed and the impact on pulsed IVs is also discussed in relation to the specific hardware solutions adopted. In addition, some interesting differences between the two technologies are highlighted with experimental data. The critical issues in performing pulsed characterization of GaN-based devices are discussed.
The paper is organized as follows. The new pulsed measurement system is described in Section II, where the main advantages of the hardware configuration are also described. The setup is then used for the on-wafer characterization of a GaAs Pseudomorphic High Electron Mobility Transistor (PHEMT). The experimental results are presented in Section III, where the pulsed IV slopes are compared with the measurements taken from standard Vector Network Analyzers (VNAs). Pulsed IV characteristics are also used for the implementation of a simple nonlinear model of the GaAs device. Large-signal high-frequency experimental validation at 2.5 GHz is also presented in this section. A GaN on SiC FET is eventually characterized on-wafer and the experimental results are introduced in Section IV. Critical differences are highlighted with respect to GaAs devices in relation to charge trapping effects.
II. THE PULSED MEASUREMENT SYSTEM
A) Setup description
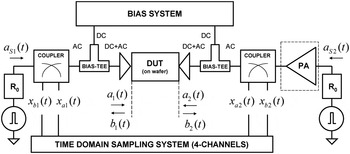
The measurement system is schematically presented in Fig. 1. Its components consist in standard instrumentation, usually available in most laboratories oriented to the characterization of circuit/devices for low-frequency applications. In particular, periodic pulsed waveforms having 20 V peak to peak maximum amplitudes on 50-Ω loads and programmable rise/fall times from 2.5 ns upwards are obtained through a two-channel arbitrary function generator (AFG). Additional power amplification can be added in the case of need for higher pulse amplitudes and currents on the drain side. For instance, this could be the case when dealing with large periphery GaN devices. A 10-kHz–250-MHz, 25-W power amplifier was used for the measurements on GaN devices in this work. The internal impedance of the two AFG channels is set to 50 Ω. The generator outputs are connected through 50-Ω cables to wide-band matched dual directional couplers (10 kHz–1000 MHz), while two bias-tee (max. current: 400 mA; bandwidth: 200 kHz–12 GHz) provide direct and alternate current path separation. The four outputs of the couplers feed the input of a suitably fast time-domain sampling system. A standard 8-bit oscilloscope can be effectively used (with some limitation in the sensitivity) or a more sophisticated data acquisition system based on higher-resolution A/D boards can be adopted. All the results presented within this paper were obtained through a standard four-channel 8-bit, 1.5-GHz bandwidth sampling oscilloscope, externally triggered by the Trigger OUT (TRIG OUT) signal of the waveform generator. On wafer measurements have been carried out by means of a thermally controlled probe station with ground–signal–ground access to the Device Under Test (DUT) electrodes.
Schematic of the proposed pulsed measurement system.

The measurement system is fully automated through a remote controlling software, specifically developed in the MATLAB programming environment. The controlling interface allows the shaping of the periodic pulsed waveforms, the setting of the bias voltages, of the sweep parameters of the pulse amplitudes, the base-plate temperature, and the acquisition averaging. In the case of the pulsed measurements shown in this work, we used an averaging based on 128 acquisitions (wave cycles).
A Short-Open-Load-Thru (SOLT)-like on-wafer calibration technique has been specifically developed. This is based on the wide-band characterization under sinusoidal excitation of the measurement setup after replacement of the actual DUT with a set of calibration standards, i.e. Short, Open, 50-Ω Load, and a Thru. Absolute calibration of the pulse amplitudes is also taken into account. Let x a1 (t), x b1 (t), x a2 (t), x b2 (t) be the time-domain waveforms sampled at the four channels of the oscilloscope. After the calibration corrections are applied, the four incident and reflected waveforms at the DUT ports (or equivalently the waveforms of the voltages and currents) are completely known.
It is worth noting that the pulsed setup presented in this work is very similar to a large family of other measurement systems for the characterization of electron devices in a 50-Ω environment (i.e. VNAs, high-frequency [Reference Teppati, Ferrero and Pisani20], and low-frequency load-pull [Reference Raffo, Di Falco, Vadala and Vannini18], LSNAs [Reference Vandenplas, Verspecht, Verbeyst, Vandamme and Bossche21]). However, this is to our knowledge the first system for pulsed I/V device characterization fully based on measurements in the wave-variable domain.
B) Advantages of the new setup
The main feature of the proposed measurement system consists in generating pulses in a 50-Ω environment. Equivalently, the DUT can be thought as excited by the incident pulsed waves (a 1 (t), a 2 (t)) instead of pulsed voltages. Generation of pulses in a 50-Ω environment offers great and fundamental advantages.
First, resistive terminations seen by the DUT usually guarantee its stability. Most of the conventional setups, which use voltage instead of wave pulses, may in some cases force the user to introduce extra resistive components for maintaining stability [Reference Teyssier, Bouysse, Ouarch, Barataud, Peyretaillad and Quere13]. This is not necessary in the actual setup since the bias networks use and the two-channel pulse generators provide wide-band 50-Ω terminations from the very low frequency of 200 kHz up to some hundreds of megahertz (in the bandwidth of the AFG). At higher frequencies, although not perfectly 50 Ω, the terminations provided by the setup are dissipative (in the order of 200 Ω max.) up to several gigahertz minimizing the likelihood of instabilities.
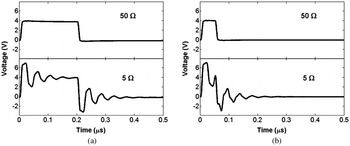
Secondly, the reflections due to mismatches of cables and setup components are reduced to a minimum. This leads to: (1) the ability to operate with pulse widths down to 50 ns (compared to typical 200 ns of other pulsed systems [6–8]); (2) simplified on-wafer calibration procedures, since the incident wave pulses are almost undistorted and calibration mostly involves attenuation corrections and phase shifts due to the setup components; and (3) more freedom in the choice of cable lengths, since they are 50-Ω matched. A simple experiment demonstrating this advantage was executed. The input port of the DUT (almost equivalent to an open circuit up to frequencies of some hundreds of megahertz) was replaced with the high-impedance input port of an oscilloscope. The voltage waveform measured at the instrument input (this reading being proportional to the incident wave at the input of the DUT) is shown in Fig. 2 for two different internal impedances of the pulse generator: 5 Ω (similar to a voltage pulse excitation) and 50 Ω (actual wave-pulse excitation). As can be seen, the 50-Ω case corresponds to the expected almost ideal case, while undesired strong oscillations originate in the 5-Ω case due to the presence of mismatches along the pulse traveling path. It is worth noting that the standard voltage pulse measurement systems apply pulses through the DC path of the bias network, thus adopting quite a different electrical scheme. However, analogous to what happens in our experiment, the voltage pulse travels through a 50-Ω matched cable and a 50-Ω probe tip before reaching the DUT and for this reason the mismatches across the pulse traveling path are necessarily involved.
Instrument voltage reading proportional to the input incident wave when the DUT input is replaced by an open circuit (similar to the gate input of an FET). Pulse generator internal impedance set to 50 and 5 Ω. Pulse width: 200 ns (a) and 50 ns (b).

A third important characteristic of the proposed measurement setup consists in direct and alternate current path separation through bias networks. The pulsed excitation (50-Ω internal impedance) feeds the AC port, while the bias system feeds the DC port exactly as in standard power amplifier circuit schematics. Special attention must be paid to the bias network frequency response in relation to the choice of pulse width and duty cycle adopted, so as to avoid excitation distortion. Wide-band bias tees (200 kHz–12 GHz) have been chosen in the proposed setup.
To the best knowledge of the authors, this is the first pulsed system based on measurements in the wave-variable domain. A more common solution consists in using bias networks with relatively high cut-off frequency of the DC path (in the order of hundreds of megahertz) and in injecting both bias and pulse waveforms into the DC port (provided that the whole spectrum of the pulses lies below the cut-off frequency of the low-pass DC feed inductor). Moreover, the AC port of the bias-tees is usually closed on 50-Ω terminations for limiting risks of device instability at high frequency, e.g.: [6–8] (risks still exist however at lower frequencies through the DC path and the voltage pulse generation circuitry).
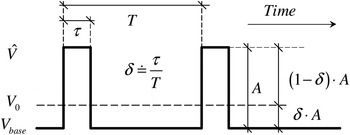
In order to highlight other advantages of the proposed setup it is worthwhile to analyze the repetitive pulse waveform. Let V(t) = V 0 + v(t) be the voltage at the generic device port, where V 0 is the average value and v(t) is the purely AC voltage component. By assuming δ = τ/T (τ is the pulse width and T the time period) as the duty cycle, an ideal repetitive pulse voltage waveform v(t) (with positive amplitudeA) at the device terminals looks like in Fig. 3, with V base = −δA and 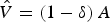 . In addition, by expanding the pulsed waveform v(t) in Fourier series, we obtain:
(1)
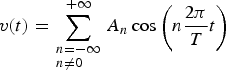
with

or equivalently

Due to the DC and AC current path separation provided by the bias networks, the bias system fixes the average value of the pulse. Positive pulse case is shown in the figure.

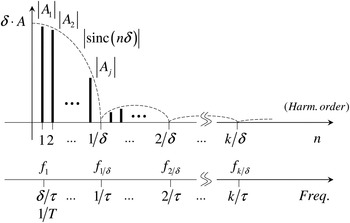
The corresponding amplitude spectrum is shown in Fig. 4.
Discrete amplitude spectrum of the pulsed waveform (plotted here for n ≥ 1 only).

Direct and alternate current path separation through bias networks, as in the present setup, leads to a couple of other important advantages. First, the bias system sets and maintains the average voltage value V 0 at the gate and the drain terminals (strictly corresponding to the selected bias) independently of the duty cycle adopted during the repetitive wave pulse excitation and regardless of the pulse amplitudes. This issue is interesting when dealing with the purpose of characterizing the dispersion due to charge trappings in FETs. In fact, provided that all the spectral components A n of the repetitive pulse excitation waveform lay at frequencies above the upper cut-off of the dispersive phenomena (i.e. f 1 > f cutoff), the current deviation due to charge trapping between the static and the pulsed I/V curves can be considered (for a wide range of devices such as GaAs HEMTs) as a function of the average gate and drain voltages only, as a first order of approximation [Reference Santarelli22]. The charge trapping state is thus well defined through the proposed pulsed setup. Instead, when considering pulsed systems where the DC and the AC components of the voltages and the currents share the same electrical path, the quiescent (baseline) voltage value V base is not coincident with the average voltage V 0, since:V 0 = V base + δA. In this case, it is clear that the duty cycle has to be chosen small enough to guarantee that the baseline voltage practically coincides with the average value. This has to be carefully considered especially when dealing with the characterization of wide-bandgap devices (such as GaN-based transistor), which operate at very large drain–source signal amplitudes.
In this respect, the choice of duty cycle could be slightly relaxed in the actual case and the pulse spectrum first harmonic component A 1 at f 1 = 1/T = δ/τ could be more easily shifted toward and above the dispersion frequency cut-off (the pulse width τ is usually chosen as the minimum value allowed by the instrumentation setup). However, it is worth noting that an excessively high duty cycle should be avoided in any case. In fact, this might result in: (1) variations of the thermal state during the pulsed characterization, which is related to the rms value of the voltage waveforms (Vrms2 = δ(1 − δ)A 2); (2) spurious variations of the dynamic drain current due to a second-order dependency of the trap state on the rms values of the applied voltages (mainly observed in GaN transistors [Reference Santarelli, Cignani, Di Giacomo, D'Angelo, Niessen and Filicori15]). Duty cycles in the order of a few percents are usually adopted.
A second advantage of having the AC and the DC current paths separation consists in the ability of monitoring the average drain current during the pulsed characterization. This leads to a better understanding of the dispersion mechanism. In fact, the average drain current observed under above-cut-off repetitive pulse voltage excitation can be expressed as [Reference Santarelli, Cignani, Di Giacomo, D'Angelo, Niessen and Filicori15]

where V G0 and V D0 are the average gate and drain voltages,  is a vector of variables denoting a particular (frozen) state of charged traps, and
 is the channel temperature corresponding to the power dissipated at the average voltage conditions and at a default base-plate temperature (36°C in our experiments). The frozen state of traps
 has often been considered a function of the average gate and drain voltages only and this assumption is verified later in this work in the experimental validation section dedicated to GaAs transistor characterization. In fact, it will be shown that the average current under pulsed operation remains constant at the quiescent value for different gate and drain pulse amplitudes, as expected. Things change instead when considering GaN transistors. Some authors, e.g. Santarelli et al. [Reference Santarelli, Cignani, Di Giacomo, D'Angelo, Niessen and Filicori15] Jardel et al. [Reference Jardel16] suggest that the
 variables might also be dependent on other quantities (such as the rms values of voltages under an almost sinusoidal regime [Reference Santarelli, Cignani, Di Giacomo, D'Angelo, Niessen and Filicori15] or dependent on the peak values of voltages [Reference Jardel16]). This is confirmed in the following section dedicated to GaN transistors.
C) Post-processing of measured data
It is worth mentioning that ohmic voltage drops across the 50-Ω resistors make the organization of acquired data slightly more complicated to deal with in comparison to the case where more conventional voltage pulses are applied. A rectangular bi-dimensional grid of waves applied at the generator ports turn out into a nonrectangular grid of voltages at the device ports due to the current-dependent voltage drops across the 50-Ω resistors, as will be shown in Section III. Suitable and accurate bi-dimensional post-processing of data is executed in order to achieve a full reconstruction of the dynamic drain current characteristics over a rectangular domain of voltages at the device ports. In particular, the measured data can be seen as samples of the two functions:  and
 . So three basic post-processing steps are carried out: (a) calibration correction, which leads to calibrated incident and reflected waves at the DUT ports; (b) transformation from incident/reflected waves to voltage/currents; and (c) interpolation (and optional extrapolation) of voltage/currents on a rectangular voltage domain at the DUT ports. Bi-dimensional interpolation algorithms on nonrectangular grids available in commercial mathematical processing tools [23] can be exploited for this aim. Alternatively, special purpose routines can be developed in order to avoid interpolation on the nonrectangular grids.
The post-processing of data is actually carried out off-line after the user-programmed acquisitions have been completed. However, real-time post-processing represents a feasible alternative.
III. CHARACTERIZATION OF GaAs HEMTs
The new measurement setup and the corresponding calibration technique have been first validated through GaAs HEMTs. The power amplifier shown at the drain side in Fig. 1 was not needed in this case. Small-signal trans-conductance and output conductance of a GaAs PHEMT (L = 0.25 µm, W = 300 µm) has been obtained from S-parameters, measured on-wafer at different biases and at 250 MHz. At this frequency the displacement contribution to the drain current is negligible and the admittance parameters are almost real quantities.
Provided that the upper frequency cut-off of the dispersive phenomena (thermal and charge trapping effects) lies below the lower spectral component f 1 of the pulsed periodic excitation waveform, the so-called “above cutoff” conditions are met. In this case, the slopes of the measured pulsed IV curves in their quiescent points should be coherent with the differential parameters obtained from standard VNAs.
Sets of pulsed drain current measurements have been carried out by choosing different couples of gate and drain voltage bias conditions. Constant gate voltage has been kept during these measurements and the pulses have been initially applied to the drain terminal only. Then, the slopes versus the drain voltage of the pulsed IV curves in the bias points have been evaluated and compared with output conductance data from VNA measurements.
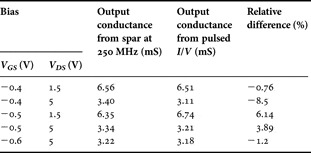
The pulse width and the duty cycle have been initially chosen to be equal to 200 ns (20 ns rise time) and 10%, respectively. Good agreement on output conductance has been verified (also taking into account that rather small absolute quantities are being considered), as shown in Table 1.
GaAs PHEMT L = 0.25 µm, W = 300 µm: small-signal output conductance.

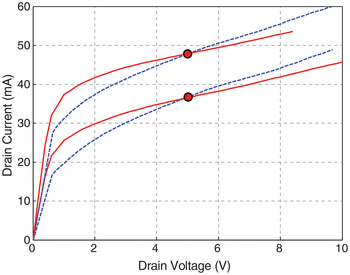
In order to test the amount of dispersion mainly due to charge trapping in the device, the pulsed IV characteristics have been compared to the corresponding static IV curves. Two sets of curves, at V G0 = −0.4 V, V D0 = 5 V and V G0 = −0.5 V, V D0 = 5 V, are for instance shown in Fig. 5. Quite critical differences of slopes are observed between the static and the pulsed curves (static output conductance is about 2 mS in −0.4 V, 5 V, so the dispersion leads to a variation from the static value of about 70%).
GaAs PHEMT – measured static (continuous lines) and pulsed (slashed) drain current sets from V G0 = −0.5 V, V D0 = 5 V and V G0 = −0.4 V, V D0 = 5 V. Biases of the two sets are outlined in red. Drain pulses only [19].

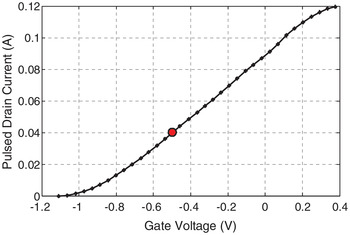
Another test was carried out by biasing the device in V G0 = −0.5 V, V D0 = 5 V, and by applying gate pulses only. The obtained pulsed trans-characteristic data are shown in Fig. 6. No compensation of the 50-Ω load-line was carried out during this test. The slope of the curve in the quiescent condition corresponds to 95.43 mS. This value is in good agreement with 92.14 mS obtained by using S-parameters in the same bias (3.57%) and taking into account the 50-Ω termination.
GaAs PHEMT – measured pulsed drain current from V G0 = −0.5 V, V D0 = 5 V. Bias condition is outlined in red. Gate pulses, 50-Ω load [19].

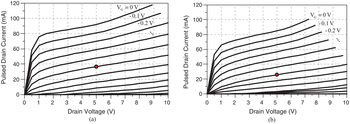
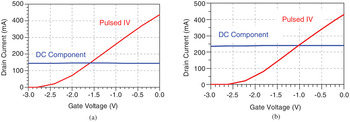
In order to test the pulsed setup in full operative mode, by also taking into account the measurement data post-processing procedures, a full characterization of the GaAs PHEMT was carried out through the application of simultaneous pulses from both gate and drain ports, by adopting waveforms with 50 ns pulse width and 1% duty cycle. The post-processing compensates the effects of the 50-Ω terminations and leads to look-up-tables (LUTs) functions defined on a rectangular grid of voltages at the device ports. An example of measured pulsed-IV characteristics is shown in Fig. 7, where all the data shown have been obtained without extrapolation.
GaAs PHEMT (L = 0.25 µm, W = 300 µm) pulsed IV characteristics measured (pulse width: 50 ns, duty cycle: 1%) with the new setup from V G0 = −0.5 V, V D0 = 5 V (a), V G0 = −0.6 V, V D0 = 5 V (b).

A new test of coherence between pulsed IV slopes versus gate (G m) and drain (G d) voltages and admittance parameters obtained from S-parameters (Re(Y 21), Re(Y 22)) has been carried out on these data. The corresponding results are presented in Table 2.
GaAs PHEMT (L = 0.25 µm, W = 300 µm): pulsed IV slopes coherence test.

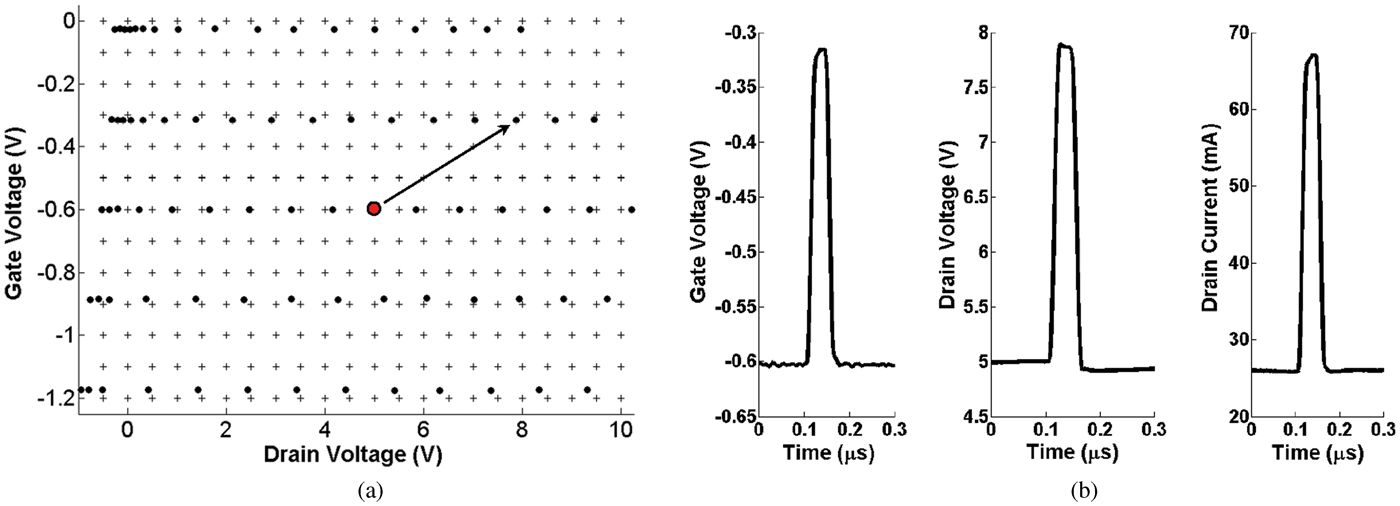
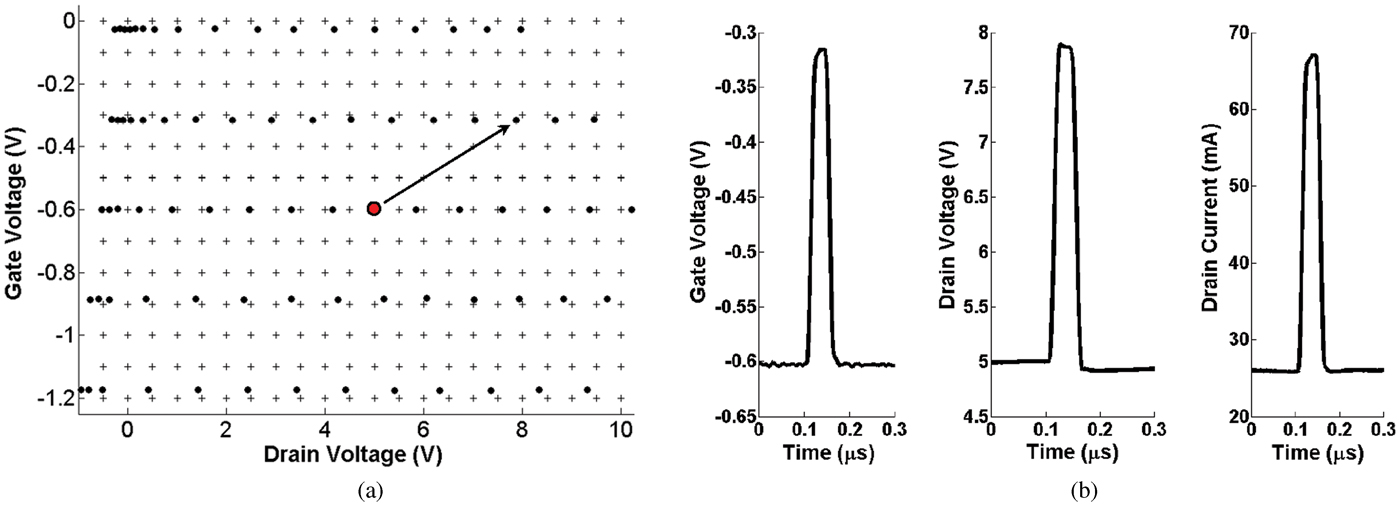
In order to show the effects of the 50-Ω pulse wave sources on the resulting voltages at the DUT ports, a set of gate and drain voltage pairs corresponding to a uniform grid of incident excitation waves is presented in Fig. 8(a) (circles). As can be seen, all the voltage pairs corresponding to a given gate pulse-wave excitation lay on a straight line, due to the almost open-circuit condition at the DUT input. The Post-processing of the measured data leads to reconstruction of the pulsed drain I/V characteristics on a uniform grid of voltages (see for instance the plus-symbols grid in the same figure). The time-domain waveform examples of the gate and drain voltages and of the drain current obtained after post-processing of data are reported in Fig. 8(b) (pulse highlighted in Fig. 8(a)).
(a) Gate and drain voltage pairs at the DUT ports corresponding to incident- and reflected-wave acquisitions (•) and to reconstructed points on a uniform grid (+); (b) example of pulse waveforms of gate/drain voltages and drain current obtained from measured incident and reflected waves.
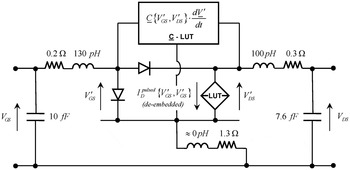
The pulsed drain current characteristics have been eventually used for the extraction of a compact quasi-static high-frequency model of the GaAs PHEMT as shown in Fig. 9. This was implemented into a commercial CAD tool [5]. The lumped extrinsic parasitic components, according to the circuit topology shown in the figure, have been identified by fitting RF small-signal differential parameters under Cold FET [Reference Dambrine, Cappy, Heliodore and Playez24] and off-state channel gate bias. The obtained values are reported in Fig. 9. The parasitic effects have been de-embedded from the pulsed drain characteristics and the intrinsic current versus voltage description has been stored in a LUT.
Equivalent circuit model used for large-signal sinusoidal-excitation HB simulations of an S-band single-stage power amplifier.

A purely capacitive-like quasi-static description of the displacement gate and drain current contributions has been extracted from multi-bias Y-parameters at low frequencies (in the range between some hundreds of megahertz and a few gigahertz where the device almost exhibits a purely quasi-static behavior). The nonlinear capacitance matrix (as a function of the gate and the drain voltages) has also been de-embedded from the parasitics and the four capacitances stored in the LUTs. For instance, the displacement currents are easily implemented into the CAD environment through symbolically defined devices. Finally, the gate–source and the gate–drain diodes were identified from the Gummel plots under forward bias of the gate junction, de-embedded from the parasitics and implemented into the schematic.
The model has been used for the large-signal simulation of a single-stage PA working at 2.5 GHz. The gate and drain terminations were set at 50 Ω. The experimental validation results (on-wafer) are shown in Fig. 10 in terms of first-, second-, and third-harmonic output power, transducer gain, and drain efficiency. It must be emphasized that a little thermal self-heating takes place in these devices when measured on-wafer. Otherwise, the thermal corrections should have been taken into account, especially at a very high level of input power.
GaAs PHEMT (L = 0.25 µm, W = 300 µm) large signal test. Single stage power amplifier (50-Ω terminations) at f 0 = 2.5 GHz. Output power (first, second, third harm) (left). Transducer gain and drain efficiency (right). Bias: V G0 = −0.5 V, V D0 = 5 V (I D0 = 37 mA).

IV. CHARACTERIZATION OF GaN FETs
An AlGaN/GaN FET on SiC (L = 0.25 µm, W = 600 µm, I DSS ≅ 450 mA) has been characterized on-wafer under gate and drain pulsed excitations (τ = 50 ns, δ = 1%). As in the previous case, pulsed IV slopes around the quiescent conditions, both versus drain and gate voltage variations, have been compared to the real parts of small-signal admittance parameters obtained from low-frequency VNA data. The results are presented in Table 3 for different bias conditions. The relative differences observed are comparable with those obtained with the GaAs-based device.
GaN FET (L = 0.25 µm, W = 600 µm): small-signal output conductance and trans-conductance.

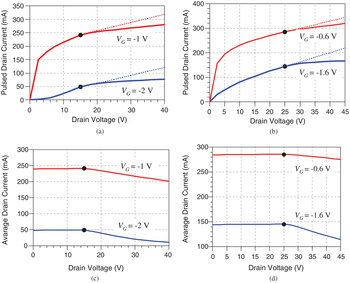
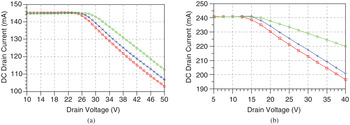
Instead, a different behavior is observed when considering the large-signal pulsed behavior. The drain-pulsed-only IV characteristics at constant gate voltage were first measured. The experiment has been repeated twice, by choosing V D0 = 25 V and V D0 = 15 V. The obtained IV plots are shown in Figs 11(a) and 11(b), respectively (continuous lines), while the corresponding average drain currents appear in Figs 11(c) and 11(d).
GaN FET (L = 0.25 µm, W = 600 µm) – drain-pulsed I/V curves at constant gate voltages. Drain pulses from V D0 = 15 V (a) and V D0 = 25 V (b). (c, d) Corresponding average drain currents. Slashed lines in (a) and (b) correspond to what it would be observed, if the average drain current kept constant at the bias value.

A slope change in the pulsed drain IV curves at each of the two gate voltages considered is well observed. This change always occurs at the drain voltage corresponding to the selected bias condition. Changing the bias condition leads to a corresponding shift in the position of the slope change. A dramatic drop in the average current is observed in the presence of the positive drain pulses ( ), while almost constant average values are monitored in the presence of the negative drain pulses (
 ). Since the thermal phenomena are generally characterized by slow time constants, we assume that they do not play a role in the pulsed experiment considered (i.e. constant internal temperature
 at all the pulsed IV points). Thus, according to (4), the observed behavior of the average drain current suggests that the set of variables
 representing the state of traps could depend on peak values of drain voltages in the case of positive pulses, i.e.
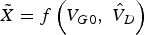 , while a simple dependence on the average drain voltage can be accepted in the case of negative pulses, i.e.
 .
This behavior is in agreement with Jardel et al. [Reference Jardel16]. The charge capture time constants are smaller than the actual pulse width (50 ns), so that the traps change their state during the positive pulses. Observe that this leads a reduced slope for V D > V D0 in Figs 11(a) and 11(b) due to trap state changes. The same does not apply when the negative drain pulses ( ) are considered because the charge emission time constants are sensibly longer than the pulse width. Observe that this leads to a “traps-frozen” IV characteristic for each V D < V Do.
For the sake of comparison, the same kind of experiment has been carried out with the GaAs PHEMT already introduced in the previous section. Pulsed and average drain currents at two constant gate voltages are plotted in Figs 12(a) and 12(b). Neither critical slope changes in the pulsed IV curve nor variations in the average drain current are observed when considering both the negative and the positive pulses. This could possibly suggest that the capture and emission time constants in these GaAs devices are both long enough to satisfy the above cut-off pulsed operation.
GaAs PHEMT pulsed (continuous) and average (slashed) drain current at V G0 = −0.5 V and V G0 = −0.4 V. Drain pulses only at V D0 = 5 V (a) and V D0 = 1.5 V (b).

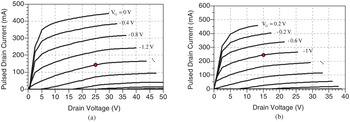
The testing of the pulsed IV behavior with respect to the gate-only pulses was not very straightforward. In fact, due to the 50-Ω load line, a gate pulse always also leads to an associated drain pulse. Thus, the IV characteristics were measured by simultaneously pulsing from the gate and the drain ports and the IV data were interpolated on a rectangular grid of voltages at the device ports. For instance, the pulsed IV characteristics obtained from V G0 = −1.6 V, V D0 = 25 V and from V G0 = −1 V, V D0 = 15 V are shown in Figs 13(a) and 13(b), respectively. Moreover, the pulsed trans-characteristics corresponding to V D0 = 25 V and V D0 = 15 V are shown in Figs 14(a) and 14(b). In the same figures the average current values are superimposed. Almost constant average current values are observed versus gate voltage variations.
GaN FET (L = 0.25 µm, W = 600 µm) pulsed drain current characteristics from V G0 = −1.6 V, V D0 = 25 V (a) and V G0 = −1 V, V D0 = 15 V (b).

GaN FET (L = 0.25 µm, W = 600 µm) – pulsed trans-characteristics from V G0 = −1.6 V, V D0 = 25 V (a) and V G0 = −1 V, V D0 = 15 V (b). Curves are plotted for the drain voltage corresponding to the quiescent condition. Direct current components are also plotted in the figures.

Finally, the average currents observed in the presence of both the gate and the drain pulses are presented in Fig. 15. As can be seen, in the presence of positive drain pulses, the peak of the gate pulse also plays a role in the definition of the trap states.
GaN FET average drain current measured during a gate and drain pulsed IV acquisition: V G = −1.6 V (crosses), V G = −2.4 V (squares), V G = −0.8 V (circles). Pulses from V G0 = −1.6 V, V D0 = 25 V (a); V G = −1 V (crosses), V G = −2.2 V (squares), V G = −0.2 V (circles). Pulses from V G0 = −1 V, V D0 = 15 V (b).

V. CONCLUSION
GaAs and GaN on SiC FETs have been characterized through a new pulsed IV measurement system. The critical differences in the behavior of the charge trapping phenomena taking place in these devices have been highlighted through the interpretation of the average drain currents measured during the pulsed characterization. The proposed setup represents in our opinion a valuable characterization instrument, which will allow further investigation of the complex charge trapping phenomena in GaN FETs and the development of pulsed measurement procedures to be used for nonlinear model extractions and circuit design.
 Alberto Santarelli received his Laurea degree in electronic engineering in 1991 and his Ph.D. in electronics and computer science from the University of Bologna, Italy in 1996. He was a Research Assistant from 1996 to 2001 with the Research Center for Computer Science and Communication Systems of the Italian National Research Council (IEIITCNR) in Bologna. In 2001, he joined the Department of Electronics, Computer Science and Systems (DEIS), University of Bologna, where he currently is an Associate Professor. During his academic career he has been a Lecturer of Applied Electronics, Industrial Electronics, and Electronics for Communications. His main research interests are electron device nonlinear modeling and circuit design for nonlinear microwave applications.
 Rafael Cignani was born in Ravenna, Italy, in 1975. He received the Laurea degree in telecommunications engineering from the University of Bologna, Bologna, Italy, in 2000, and the Ph.D. degree in information engineering from the University of Ferrara, Ferrara, Italy, in 2004. During his doctoral studies, he collaborated with the Department of Electronics, Computer Science and Systems (DEIS), University of Bologna. He is currently a Graduated Technician with the DEIS, University of Bologna. His research activity is mainly oriented to MMIC design and nonlinear circuit modeling and design techniques.
 Daniel Niessen Daniel Niessen received the Laurea degree and Master Laurea degree (with honors) in telecommunication engineering from the University of Bologna, Italy, in 2005 and 2009, respectively. Since January 2010 he is enrolled in a Ph.D. program in electronics, computer science and telecommunications at Department of Electronics, Computer Science and Systems, University of Bologna. His research interests are mainly related to design methodologies and modeling of electronic circuits for communications systems. Currently, his activity focuses on the modeling and characterization of GaN devices for microwave power applications.
 Pier Andrea Traverso was born in Modena, Italy, in 1969. He received the M.S. degree in electronic engineering and the Ph.D. degree in electronic and computer science engineering from the University of Bologna, Bologna, Italy, in 1996 and 2000, respectively. He is currently a Research Associate with the Department of Electronics, Computer Science, and Systems, University of Bologna. His main research activity is in the areas of nonlinear dynamic system characterization and modeling, microwave and millimeter-wave device characterization and modeling, and sampling instrumentation and techniques. Pier Andrea Traverso is a member of the Italian Association of Electrical and Electronic Measurement.
 Fabio Filicori received the Dr. Ing. degree in electronic engineering from the University of Bologna, Bologna, Italy, in 1974. In 1974, he joined the University of Bologna, as an Assistant Researcher, and then became an Associate Professor. In 1990, he became a Full Professor of electronics with the University of Perugia. In 1991, he moved to the University of Ferrara, where he was Coordinator of the degree course in “Electronic Engineering.” He is currently a Full Professor with the University of Bologna, where he has been Coordinator of the Ph.D. course in “Electronics, Computer Science and Telecommunications.” He has been Coordinator of research projects in electronics supported by the Italian Ministry of University and Research. He has been a member of the Technology Commission of the Italian Space Agency. He has published approximately 200 papers. His research concerns nonlinear microwave circuit design, electron device modeling, electronic measurements, and industrial electronics. Dr. Filicori has been a WP leader for the European NoE TARGET. He has been TPC chairman for the EUMIC Conference.