Implications
Blood flow across portal-drained viscera (PDV) is essential to calculate net portal absorption of nutrients in pigs. It is estimated by measuring the dilution of the marker (para-aminohippuric acid (PAH)) infused, but its determination is troublesome because of interactions with the complex matrix (plasma or serum). Water is commonly used to prepare the standards but it does not take into account existing matrix effects leading to overestimation of PAH in plasma. The use of PAH free plasma or commercial pig serum as standard matrix instead of water is recommended to avoid blood flow underestimation and hence nutrient fluxes.
Introduction
Progress in quantitative animal metabolism is dependent on accurate analytical methods for the metabolites under investigation. In terms of whole-body metabolism, PDV have a disproportionate influence with respect to their mass and under certain circumstances their high metabolic rate may compromise the nutrient availability of peripheral tissues. In order to conduct gastro-intestinal metabolism studies and quantify nutrient absorption, the net PDV flux of a nutrient can be estimated by multiplying its concentration difference between the portal vein (efferent blood) and a systemic artery (afferent blood) by the simultaneously determined portal blood flow (PBF). Portal blood flow can be estimated in pigs by dilution of the indicator PAH. With the use of a porcine model, PBF was measured by the downstream dilution of continuously infused PAH into the ileal vein and subsequent sampling from the portal vein and an artery. Plasma and serum samples present analytical problems due to the complex nature of their matrices that may introduce an analytical bias (Matuszewski et al., Reference Matuszewski, Constanzer and Chavez-Eng2003). Sample components different from the analyte, grouped together under the designation of sample matrix, may be the cause of disturbances that affect either the measurement system or the analytical signal generated. Consequently, the matrix effect can increase the level of random errors worsening the analytical resolution and/or introducing systematic errors, which can be constant, if the analytical blank is affected, or proportional to the analyte concentration, if the method sensitivity is modified. The matrix effect influences the accuracy of the results because the precision is modified (if random errors are increased) and/or the trueness is affected (if systematic errors are introduced). The detection and correction of analytical constant and proportional systematic errors have been extensively studied (Cardone, Reference Cardone1987).
The aims of this work were the evaluation and correction of matrix effects on pig plasma PAH analysis, and test the consequences on PDV flux of nutrients.
A statistical protocol based on the standard addition methodology and the Youden curve (Bagur et al., Reference Bagur, Gazquez and SanchezVinas1996) was used. The followed approach leads to quantitative information and allows the determination of the presence matrix effects that may cause problems during sample preparation and analysis, based on the comparison of different samples: neat standards, biological samples spiked with the analyte (PAH) and PAH free biological samples. Two different types of biological matrices were assessed: pig plasma and commercial pig serum.
Material and methods
Chemicals and procedure of quantification
Para-aminohippuric acid (A1422), trichloroacetic acid (T-9159), sodium nitrite (237213), N-(1-Naphthyl) ethylenediamine dihydrochloride (222488), and porcine serum (P-9783) were purchased from Sigma (St Louis, MO, USA). Ammonium sulfamate (132750.1208) was obtained from Panreac (Castellar del Vallès, Barcelona, Spain). Sodium hydroxide (30620) was purchased from Riedel–deHaën (Seelze, Germany). High purity water (>18 MΩ/cm) was obtained by a Milli-Q purification system (Millipore, Milford, MA, USA). All chemicals used were analytical reagent grade.
Para-aminohippuric acid was quantified by a modified version of the method described by Smith et al. (Reference Smith, Finkelstein, Aliminosa, Crawford and Graber1945). A micro-method was developed so that small volumes of sample could be used to determine PAH concentration. Polystyrene clear microplates with flat bottom for colorimetric applications were used for the purpose. Plasma and serum samples (250 μl) were deproteinized with 10 volumes of trichloroacetic acid (120 g/l). After mixing, samples were centrifuged (Eppendorf 5810R, Hamburg, Germany) at 1308 g and 25°C for 10 min.
An aliquot (200 μl) of the supernatant was placed in a well (time 0) and 25 μl of sodium nitrite (1 g/l), 25 μl of ammonium sulfamate (5 g/l) and 25 μl of ethylenediamine dihydrochloride (1 g/l) were added 3, 6 and 9 min, respectively, after the sample addition, according to the Bratton and Marshall (Reference Bratton and Marshall1939) method for sulphanilamide analysis. Para-aminohippuric acid was determined by diazotization and coupling in acid solution. This method can be used for determining diazotizable primary aryl amines containing either a free amino group or a blocked amino group which can be freed by hydrolysis. The free amino group of PAH react with sodium nitrite to form a diazo compound. Ammonium sulfamate was added to destroy excess nitrite preventing the formation of nitroso compounds. N-(1-naphthyl) ethylenediamine dihydrochloride was used as a coupling component to yield an azo dye. Thirty minutes after the addition of ethylenediamine dihydrochloride, PAH concentrations were determined spectrophotometrically using a VictorTM X5 Perkin Elmer 2030 Multilabel reader (Turku, Finland) at 540 nm. Quadruplicate instrumental analyses were carried out (four wells of each condition within plate). Three calibration experiments were made to obtain the data set necessary for evaluation of the method: external calibration (EC), standard-added calibration (SAC) and Youden calibration (YC). For quantification, an additional calibration experiment was carried out: matrix-matched calibration (MMC) using a PAH-free matrix, either plasma from pigs not infused with PAH or porcine serum obtained from Sigma. For all calibrations, two experimental (repetition of each experimental condition) and four instrumental replicates (repetition or analysis of each experimental condition in different wells) were used.
Calibrations and validation of the method
External calibration is the typical calibration set where different amounts of a standard are weighed and dissolved in equal volumes of a suitable solvent, and equal aliquots of each solution are subjected to the measurement procedure. For this purpose, a set of calibration standards was prepared from a 20 g/l PAH solution, pH 7.4, similar to the sterile PAH solution infused in vivo to pigs to estimate blood flow. The 20 g/l PAH solution was diluted with 120 g/l tricholoracetic acid to obtain PAH concentrations of 7, 5.25, 3.5 and 1.75 mg/l, which was in the range of expected concentration in vivo. In addition, a blank containing 120 g/l tricholoracetic acid following the same procedure as PAH standard solutions was made (Figure 1).
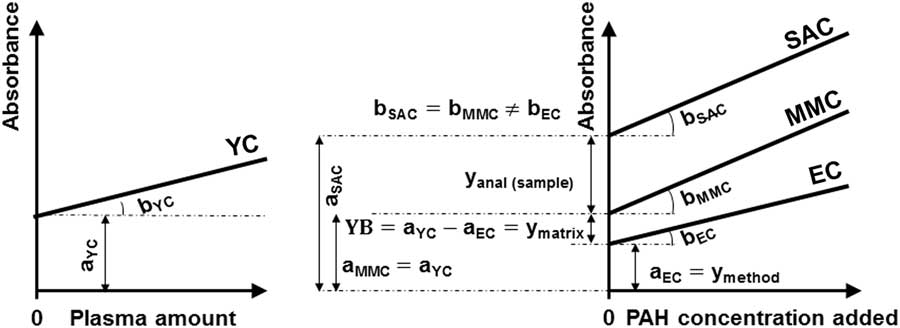
External calibration (EC), standard-added calibration (SAC), matrix-matched calibration (MMC) and Youden calibration (YC) curves of the para-aminohippuric acid (PAH) analytical method. The corresponding intercepts and slopes are denoted by a EC, a SAC, a MMC and a YC and b EC, b SAC, b MMC and b YC, respectively. The absorbance due to the method blank (y method) is the intercept of the external calibration curve (a EC). The absorbance due to the initial fraction of PAH in the actual test sample portion is denoted by y anal (sample) and the absorbance due to the matrix blank (Youden blank) by y matrix.

Standard-added calibration is used to evaluate possible proportional errors when determining the matrix effect for analytes present in the sample. If the slopes of standard added and ECs are similar, there are no proportional errors attributable to the matrix under study (Figure 1). Standard-added calibration was obtained by addition of different amounts of PAH to a constant volume of plasma from a pig infused with PAH and hence this plasma had a basal concentration of PAH. The value of ‘zero’ addition is included. Increasing amounts of PAH (0 to 70 mg/l final concentration, 17.5 mg/l increments) were added to plasma in Eppendorf tubes keeping total volume constant. Samples were deproteinized and quantified as previously described.
Youden calibration (Youden, Reference Youden1947) was established to determine a constant error when matrix effect is considered. The YC curve was set up with different amounts of plasma from PAH infused pigs and aqueous dilutions (0.25, 0.5, 0.75, 1.0 sample volume/total volume) were prepared and an aliquot was subjected to the analytical procedure previously described. Youden calibration plot is the representation of responses against the amount of sample on which the procedure was applied. When the intercepts of EC and YC are different, there is a constant error attributable to the matrix (Figure 1).
Matrix-matched calibration is a calibration procedure (Bagur et al., Reference Bagur, Gazquez and SanchezVinas1996) where an analyte-free matrix is spiked with known amounts of the standard. Two MMCs were carried out: the first one using plasma from pigs not infused with PAH, MMCplasma, and the second one using pig commercial serum, MMCserum, as PAH free matrices. Similarly to SAC, different amounts of PAH standard solution were added to a constant volume of PAH free plasma or pig commercial serum. Increasing amounts of PAH standard solution (0 to 70 mg/l PAH final concentration, 17.5 mg/l increments) were added from a 20 g/l PAH solution to each PAH-free matrix in Eppendorf tubes keeping total volume constant. Samples were deproteinized and quantified as previously described (Figure 1).
The method was validated through estimation of accuracy. Accuracy was evaluated through the study of trueness and precision. To evaluate trueness, a recovery study was performed using five samples of plasma spiked with PAH. Concentration of PAH in plasma was calculated using both MMC equations (plasma and commercial serum) and compared with the PAH amount spiked. Mean recoveries using the present method and MMCs using plasma or serum were reported. To evaluate precision, relative standard deviation of the concentrations were calculated. Five samples were used for intra-day precision to determine trueness, while for the inter-day precision a daily replicate for 5 days was carried out.
Determination of plasma flow and nutrient fluxes
The experiment was approved by the Institutional Animal Care and Use Committee of the Spanish National Research Council (AGL2009-08916). Six Iberian gilts (25.6±0.9 kg BW) were surgically fitted with permanent catheters in the portal vein, ileal vein, and carotid artery as described by Rodríguez-López et al. (Reference Rodríguez-Lopez, Cantalapiedra-Hijar, Durand, Isserty-Thomas and Ortigues-Marty2013). After surgery, pigs were fed a diet with optimal protein:energy ratio and a CP concentration fixed to match the potential for protein deposition of Iberian pigs (130 g/kg CP and 14 MJ metabolizable energy/kg dry matter) at 0.85 ad libitum, calculated as a function of BW. After surgery recovery, a 15 ml pulse dose of PAH (20 g/l), prepared as described by Yen and Killefer (Reference Yen and Killefer1987), was infused into the ileal vein 45 min before blood sampling, followed by a continuous infusion of 16 mg/min using a syringe pump (Harvard Pump 33; Harvard Apparatus, Holliston, MA, USA). Apyrogenic filters (MILLEX GP, Syringe Driven Filter Unit, 0·22 μm; Millipore, Carrigtwohill, Ireland) fitted infusion syringes. Blood samples (4.5 ml) were taken simultaneously from the carotid artery and portal vein into tubes (Monovette VetMed LH; Sarstedt, Nümbrecht, Germany) with heparin-coated glass beads, centrifuged and plasma harvested and stored at −20°C until analysis for PAH (Smith et al., Reference Smith, Finkelstein, Aliminosa, Crawford and Graber1945), glucose and amino acids. Sampling was performed 5 min before and 0.5, 1, 1.5, 2, 2.5, 3, 3.5, 4, 5 and 6 h after feeding 0.25 of the diet. Blood O2, total hemoglobin and packed cell volume were measured immediately with a hemoximeter (OSM 3 Hemoximeter; Radiometer Corporation, Copenhagen, Denmark). Blood O2 concentration was calculated as described by Huntington et al. (Reference Huntington, Eisemann and Whitt1990). Previous to amino acid analysis, plasma samples were deproteinized using 200 g/kg tricholoracetic acid and 2 mM norleucine as internal standard and supernatant used for free amino acid quantitation. Analysis for free amino acids was carried out by high performance liquid chromatography using the Waters Pico-Tag method, which involves pre-column derivatization with phenylisothiocyanate and a reverse phase column (Waters Pico-Tag, 3.9×300 mm). Plasma glucose was determined using Precision PCx Blood Glucose Test Strips (Abbott Laboratories, MediSense Products; Bedford, MA, USA). Para-aminohippuric acid concentration was calculated with a standard curve made in Milli-Q water (EC), plasma or commercial serum matrix (MMCplasma and MMCserum). Consequently, three separate PAH concentration values were obtained for each sample.
PBF and PDV O2 consumption and nutrient fluxes were calculated according to the Fick principle of arteriovenous concentration difference and flow rate (Zierler, Reference Zierler1961) determined by the indicator dilution method using PAH described by Katz and Bergman (Reference Katz and Bergman1969). Portal plasma flow (PPF) and PBF were determined using the following equations:
 $${\rm PPF}\,{\equals}\,{{C_{i} {\rm {\times}IR}} \over {\left( {{\rm PAHp}{\minus}{\rm PAHa}} \right)}}$$
 $${\rm PBF}\,{\equals}\,{{C_{i} {\times}{\rm IR}} \over {\left( {{{{\rm PAHp}{\times}\left( {100{\minus}{\rm PCVp}} \right)} \over {100}}} \right){\minus}\left( {{{{\rm PAHa}{\times}\left( {100{\minus}{\rm PCVa}} \right)} \over {100}}} \right)}}$$
where C i was the concentration of the PAH infusion solution (mg/ml), IR the infusion rate of PAH (ml/min), PAHp and PAHa the PAH concentrations (mg/l) in the portal vein and arterial plasma, respectively, and PCVp and PCVa are packed cell volumes (%) of portal vein and arterial blood, respectively. Net PDV flux of nutrients was calculated from the difference between portal and arterial plasma concentrations and the corresponding PPF (Deutz et al., Reference Deutz, Reijven, Athanasas and Soeters1992):
 $${\rm PDV}_{{{\rm flux}}} \,{\equals}\,\left( {{\rm Np}{\minus}{\rm Na}} \right){\times}{\rm PPF}$$
where Np and Na are the nutrient concentrations in portal and arterial plasma, respectively.
Statistical analysis
Linear least square regressions of analytical signal v. amount of PAH added to each matrix (water, plasma from a non-infused pig and commercial pig serum, EC, SAC, MMCplasma and MMCserum, respectively) and v. increasing amounts of spiked plasma (YC) were carried out. Intercepts were analyzed using the Student t-test for comparison with zero. The lack-of-fit test was applied to check the linearity of the calibration graphs (Thompson et al., Reference Thompson, Brown, Fearn, Gardner, Greenhow, Howarth, qMiller, Newman, Ripley, Swan, Williams, Wood and Wilson1994; Olivieri, Reference Olivieri2015). It determines whether the linear model was adequate to describe the observed data and was performed by comparing the variability of the current model residuals to the variability between observations at replicate values of the independent variable (amount of PAH in the standard solution). Analysis of covariance (ANCOVA) was used to check the similarity of the calibration slopes. If the method sensitivity (slope) is modified, a proportional error exists. The statistical test establishes the null hypothesis that slopes were not significantly different (H0≡b EC=b SAC). Thus, there are two variances that measure the variability which are compared by an F-test. Statgraphics Centurion XVI software package (version 16.2.04; 2013) was used.
The influence of the calibration method on plasma PAH concentration, blood and plasma flows, and net PDV fluxes of nutrients in pigs was analyzed using repeated measures analyses using the mixed procedure of SAS (version 9.4; SAS Institute Inc., Cary, NC,USA). The main effects in the model were the matrix used for calibration (water in EC, plasma from pigs not infused with PAH in MMCplasma and porcine commercial serum in MMCserum), the sampling time, and the interaction.
Results
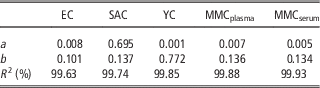
Intercept (a), slope (b) and coefficient of determination from least square linear regressions of EC, SAC, MMC plasma, MMC serum and YC are shown in Table 1.
Influence of the matrix (water – external calibration; plasma – standard-added calibration and matrix-matched calibration; or serum – matrix-matched calibration) on the absorbance at 0 μg para-aminohippuric acid/ml added (y-intercept (a), slope (b) and coefficient of determination (R 2) of the standard curve)

EC=external calibration (nine replicates/level); SAC=standard-added calibration (six replicates/level); YC=Youden calibration (six replicates/level); MMCplasma=matrix matched calibration with plasma (three replicates/level); MMCserum=matrix matched calibration with commercial pig serum (three replicates/level).
Intercept of external calibration (aEC) was statistically not different from zero (P>0.05), so no contribution of reagents to the analytical signal existed. As lack-of-fit tests for EC, SAC, MMC plasma and MMC serum were not significant (P>0.05), the linear model was adequate for the range of concentration studied (0 to 7.0 mg/l).
Slopes of EC and SAC were different (P<0.001) when compared using an ANCOVA F-test.
Intercept from Youden calibration (aYC) was not significantly different from zero (P>0.05).
Slopes of SAC and MMC plasma were not different (P>0.05).
Slopes and intercepts of MMC plasma and MMC serum were similar (P>0.05).
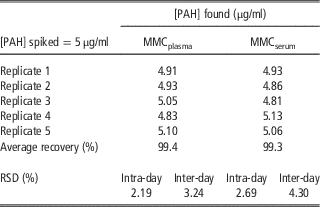
Average intra-day and inter-day relative standard deviations were 2.44% and 3.77%, respectively, using MMC plasma and MMC serum (Table 2).
Evaluation of trueness and precision of the para-aminohippuric (PAH) analysis method using plasma or commercial serum for the standard curve

MMCplasma=matrix matched calibration with plasma; MMCserum=matrix matched calibration with commercial pig serum; RSD=relative standard deviation.
The limit of detection (3×standard deviation of the blank) and limit of quantitation (10×standard deviation of the blank) in plasma were 0.07 and 0.22 mg PAH/l, respectively, with acceptance limit set at 10%.
Average PAH recovery in spiked samples of plasma and commercial serum spiked with 5 mg PAH/l was 99.35% (Table 2).
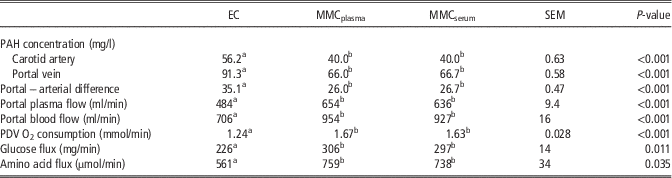
Portal blood flow and PPF and fluxes of nutrients were determined in six pigs using EC, MMC plasma or MMC serum (Table 3). Para-aminohippuric acid concentrations in the portal vein and an artery were increased (P<0.001) when quantification was performed using EC compared with MMC. Portal-arterial difference of PAH concentration was also increased leading to 25% underestimation of PBF and PPF and fluxes of O2, glucose and amino acids using EC compared with MMC.
Differences in para-aminohippuric acid (PAH) concentration, plasma and blood flows and net portal-drained viscera (PDV) flux of nutrients in pigs (n=6) when PAH concentration is calculated using water (external calibration (EC)) plasma or commercial serum (matrix-matched calibration) as matrices for the standard curve

MMCplasma=matrix-matched calibration with plasma; MMCserum=matrix-matched calibration with commercial pig serum.
a,b Means within a row with different superscript differ significantly at P<0.05.
Discussion
Matrices may affect the analyte response by two different mechanisms: some of the matrix components may modify the analyte response and some of the sample treatments may affect the response.
Evaluation of matrix effect through external, standard added and Youden calibrations
The extrapolation of responses to zero in EC, that is the regression intercept (aEC), measured in the presence of finite amounts of analyte is an estimation of the standard blank or reactive blank (Figure 1). As the intercept was statistically not different from zero, the reagents did not contribute to the analytical signal. According to the lack-of-fit test the linear model appears to be adequate for the observed data (0 to 7.0 mg/l), which covers the range of PAH concentrations expected, considering the PAH infusion rate, the BW of the animals and the sample treatment.
Proportional bias was estimated comparing the slopes of the lines of EC (increasing amounts of PAH with water as matrix) and SAC (increasing amounts of PAH with plasma from pigs infused with PAH as matrix) by means of ANCOVA where the fixed effect or controlled factor was the variability arising from the sample matrix. As slopes from EC and SAC were different (Figure 1), a component of proportional bias was involved in the analysis of PAH using the Bratton–Marshall procedure (Bratton and Marshall, Reference Bratton and Marshall1939).
Difference between the intercepts of the EC and YC curves (aEC and aYC, respectively; Figure 1) would indicate a constant bias due to sample matrix effect. As external and YCs independent variables are not the same (PAH final concentration and amount of plasma, respectively), it is not possible to establish a comparison test for the intercepts of both curves. However, it could be considered that a difference between both values exists if the value of the intercept of YC was not included within the confidence interval of the intercept of EC. The true sample blank or Youden blank was the difference between the intercepts of Youden and external (reagent blank) regressions. As the intercept of the YC was not different from zero, it was considered that there was no constant bias due to matrix effect in the analysis of PAH using the present method.
Correction of matrix effect and validation of the method
If there is a constant error and/or proportional error due to the matrix, the correction of this effect should be considered when calculating sample analyte concentration. In sample composition calculations, gross errors can be made when analysis is attempted by combining a single sample signal and EC, ignoring constant and proportional matrix errors.
In this study only the presence of proportional bias was detected, as slopes of external and SACs are different (b EC≠b SAC). Plasma PAH concentration could be calculated using the SAC according to the following equation:
 $$cxSAC\,{\equals}\,{{a{\rm SAC}} \over {b{\rm SAC}}}$$
where a and b are the intercept and slope of SAC, respectively, and cxSAC is the concentration in the analytical portion obtained using SAC. When a proportional matrix effect is found, quantification can be performed by means of SACs when no suitable analyte free sample is available, or a MMC when a PAH free sample is possible to obtain. As a proportional matrix effect using the present method existed, routine quantification of PAH should correct the bias. Para-aminohippuric acid quantification using SAC is cumbersome and laborious as a SAC for each sample is necessary. If no analyte-free matrix is feasible to obtain, a function named matrix-corrected calibration has been proposed (Fernández-Fígares et al., Reference Fernández-Fígares, Cuadros Rodríguez and González-Casado2004) to correct for constant and proportional errors introduced by a complex matrix. A MMC using plasma from a non-PAH infused pig is much more convenient than performing a SACs or using a mathematical function such as matrix-corrected calibration. Furthermore, as slopes of MMC using plasma and SAC were not different, MMC using plasma can be used to quantitate PAH. A constraint of both SAC and MMC using plasma is that it is necessary to withdraw extra samples from the pigs when carrying out the sampling, which may be a problem when serial sampling is carried out. To overcome this limitation this study demonstrates that MMC using commercial serum is equivalent to MMC using plasma (from pigs not infused with PAH) to quantitate PAH, although serum matrix does not contain fibrinogen.
Rodríguez-López et al. (Reference Rodríguez-López, Lachica, González-Valero and Fernández-Fígares2014) reported a 2.5 mg/l limit of quantitation for PAH analyzed in non deacetylated cow plasma samples, increasing to 15.3 mg/l when a deacetylation step was introduced. The PAH infusion rate used to quantify nutrient flux (606 µg PAH/kg BW/min) in our experiments produced PAH concentrations in arterial plasma (43 mg PAH/kg) greater than the limit of quantitation. Furthermore, arterial plasma PAH concentration in 54 kg BW pigs infused 146 μg PAH/kg BW/min was above the limit of detection determined herein (Yen and Killefer, Reference Yen and Killefer1987).
Therefore, the PAH concentration in arterial plasma was always above the limit of quantitation over a wide range of infusion rates indicating that this analytical method is sufficiently sensitive for the purposes intended.
Influence of matrix on fluxes of nutrients
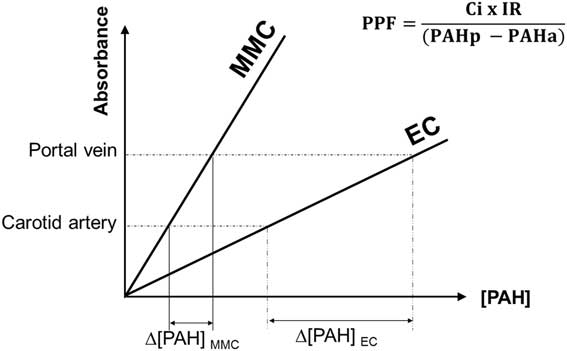
PBF estimate is dependent on PAH concentration in the portal vein and carotid artery as shown in materials and methods (equation (1)).
The differences in PAH concentration in the portal vein and carotid artery (PAHp−PAHa=Δ[PAH]) of pigs, using either EC or MMC are shown in Figure 2. As the slope of MMC was greater than EC, the PAH arteriovenous difference was smaller for MMC compared to EC, implying a systematic underestimation of PPF (see equation (1) and Figure 2). Organ and total body blood flow are very variable and depend on the cardiac output and therefore, care is needed when comparing literature data from different experiments and conditions. The results of PBF in the present experiment using EC are within the range of data obtained with Iberian pigs with reduced feed intake and similar age, although lower than in Landrace pigs (Rodríguez-López et al. Reference Rodríguez-Lopez, Lachica, Gonzalez-Valero and Fernandez-Figares2010; González-Valero et al., Reference González-Valero, Rodríguez-López, Lachica and Fernández-Fígares2016), maybe due to the lower ME requirement for maintenance of Iberian compared with modern pigs (Nieto et al., Reference Nieto, Miranda, García and Aguilera2002). An underestimation of PPF would imply an underestimation of fluxes of nutrients (equation (3)). When PAH concentration was determined using EC, not considering the demonstrated matrix effect, the flux of nutrients was underestimated proportionally to the differences between portal and arterial concentrations of PAH using EC or MMC. Para-aminohippuric acid analysis is used to determine blood flow in ruminant and non-ruminant species (Bergman et al., Reference Bergman, Havel, Wolfe and Bohmer1971; Isserty et al., Reference Isserty, Ortigues and Remond1998). The existence of a matrix effect that may be corrected preparing PAH standards with plasma obtained from cows not infused with PAH was described (Rodríguez-Lopez et al., Reference Rodríguez-López, Lachica, González-Valero and Fernández-Fígares2014). Furthermore, Rodríguez-López et al. (Reference Rodríguez-López, Lachica, González-Valero and Fernández-Fígares2014) reported changes in nutrient fluxes greater than 19% after deacetylation and use of plasma as standard matrix, in the same range than in the present experiment. Nevertheless, there are multiple differences between ruminant and monogastric species that justify the study of the matrix effect on PAH determination in pigs.
Effect of the matrix used to prepare the standard curve, water (external calibration (EC)) and plasma or serum (matrix-matched calibration (MMC)) on portal-arterial difference of para-aminohippuric acid concentration (PAHp−PAHa) and portal plasma flow (PPF). C i is the concentration of the PAH infusion solution and IR is the infusion rate of PAH.

Advances in the knowledge of nutrient fluxes and metabolism in farm animals are very dependent on the accurate and precise determination of plasma and blood flows. Para-aminohippuric acid is the marker most frequently used for PDV plasma flow estimation, using the indicator dilution method. This study demonstrates that no consideration of the matrix effect when analyzing plasma PAH leads to an underestimation of blood flow and hence PDV nutrient fluxes. Certainly, factors such as homogeneity of the mixing of PAH in the blood, location, design and dimension of the catheters or the surgical technique, among others, may affect the accuracy of blood flow measurement and they have not been taken into account in our study (Isserty and Ortigues, Reference Isserty and Ortigues1994; Rodríguez-López et al., Reference Rodríguez-Lopez, Cantalapiedra-Hijar, Durand, Isserty-Thomas and Ortigues-Marty2013). The use of a MMC using commercial serum is recommended for controlling the matrix effect when analyzing PAH in pig plasma samples. A further advantage of this approach is that no extra blood samples throughout sample collection are necessary to prepare the standards. In addition, we have developed a micro-method that allows a significant reduction of the blood volume extracted from animals subjected to serial sampling experiments. Failure to consider the matrix effects grossly overestimates the PAH concentration in plasma and serum. Therefore, portal flow maybe underestimated and wrong conclusions could be derived from nutritional and metabolic studies where PAH is determined without taking into account constant or proportional errors introduced by the matrix. The results presented challenge previous blood flow estimations using PAH as a marker in porcine studies where no correction of the matrix effect was considered.
Acknowledgments
This work was funded by grant AGL2009-08916 from Ministerio de Ciencia e Innovación, Spain. The authors gratefully acknowledge Sánchez Romero Carvajal Jabugo S.A. (Seville) for providing the pigs, A.L. Tate for revising our English text and Dr Luis Lara for statistical advice.