Introduction
Numerous pathogens can be responsible for pig health disorders or can represent a food-borne hazard when they induce a pork product contamination. Depending on the pathogens considered, the transmission routes vary. The spread within a pig host population is influenced by the possible interactions among pigs also called the contact structure (Klinkenberg et al., Reference Klinkenberg, De Bree, Laevens and De Jong2002; Eblé et al., Reference Eblé, De Koeijer, Bouma, Stegeman and Dekker2006). The contact structure corresponds to the existence, the type (e.g. direct or indirect via the environment), the intensity and the frequency of contacts among animals.
In farrow-to-finish herds, populations of pigs and sows are structured and managed by the producers. Herd management is frequently based on batch farrowing. Herds are divided into several groups of sows in the same reproductive stage and of similarly aged pigs (Brown, Reference Brown2006). These groups are called batches. Batch farrowing management of sows allows for mating and farrowing to occur at a fixed interval and leads to an all-in/all-out (AIAO) management of pigs. Typically, this management allows for an age-segregated rearing, and, so, pigs coming from different batches are housed in different rooms and have no direct contact. It leads to a heterogeneous contact structure: animals in different batches have no contact. The batch system is recommended to control herd health status (Berends et al., Reference Berends, Urlings, Snijders and VanKnapen1996; Dahl et al., Reference Dahl, Wingstrand, Nielsen and Baggesen1997; Madec et al., Reference Madec, Bridoux, Bounaix and Jestin1998; Rose et al., Reference Rose, Larour, Le Diguerher, Eveno, Jolly, Blanchard, Oger, Le Dimna, Jestin and Madec2003), to improve daily weight gain (Schinckel et al., Reference Schinckel, Smith, Tokach, Dritz, Einstein, Nelssen and Goodband2002), and to improve producers’ labour and husbandry needs. This recommended batch system also allows for a break between two consecutive batches for the cleaning and disinfection of rooms.
Producers have to deliver groups of pigs at a given range in slaughtering weight. But due to growth variation within a batch, pigs reach slaughtering weight and leave their room at different times. Given that producers are constrained by the number and size of the rooms, it can also lead to still having pigs below slaughtering weight remaining in the room when it needs to be emptied for the following batch. Producers may then either sell these remaining pigs (at a lower price) or implement management modifications to keep them longer. These modifications may consist of mixing the remaining animals with the following batch and/or in reducing the duration of the room decontamination period, which differ from the recommended AIAO management (Hébert et al., Reference Hébert, Lurette, Fourichon, Seegers and Belloc2007). Two types of contact between batches then occur, either via the animals themselves when batch mixing (BM) takes place, or indirectly via the rooms when decontamination is not completely implemented. Herd management has to ensure the best possible internal biosecurity within the herd combined with the most profitable pig delivery. However, practices that tend to improve biosecurity frequently induce a lower cost-effectiveness of pig delivery. Hence, producers have to find a compromise between those two aims and we are interested in assessing the consequences of the management modifications they may choose to implement.
A modelling approach is suitable to represent batch farrowing management system, management modifications and the contact structure. Most of the previously published pig models aimed at production studies such as sow performance or replacement strategies (Allen and Stewart, Reference Allen and Stewart1983; Jalvingh et al., Reference Jalvingh, Dijkhuizen, Van Arendonk and Brascamp1992; Plà et al., Reference Plà, Pomar and Pomar2003; Kristensen and Sollested, Reference Kristensen and Sollested2004), pig population dynamics (Singh, Reference Singh1986) and/or food intake (Pomar et al., Reference Pomar, Harris, Savoie and Minvielle1991). Jorgensen and Kristensen (1995) developed a model for herd management based on a decision support system. None of these models needed to represent the batch system. Moreover, some epidemiological models were developed for pig herds. Some of them did not need the batch system (as for the foot-and-mouth spread). Other models represented only a part of pig growth without considering the batch system (Van der Gaag et al., Reference Van der Gaag, Vos, Saatkamp, Van Boven, Van Beek and Huirne2003; Ivanek et al., Reference Ivanek, Snary, Cook and Gröhn2004). Other authors modelled a 1-week trial using batch farrowing management studying the effect on disease dynamics of piglets removal at different ages and of sows housed together or in different pens (MacKenzie and Bishop, Reference MacKenzie and Bishop2001). They assumed a homogeneous mixing of animals within batches or pens, and during the farrowing period for sows and their piglets but they did not consider any contact between animals from different batches. Another model described the effect of disease control strategies on the number of pigs delivered each week (Toft et al., Reference Toft, Kristensen and Jorgensen2005) but considered only two consecutive batches in the same room.
The aim of this paper was to describe a mathematical model representing population dynamics within a farrow-to-finish pig herd. This model allowed us to study the influence of the producers’ batch management on the contact structure and on pig delivery.
Model description
Batch farrowing system
The model represents a farrow-to-finish herd in which batch farrowing is applied to sows, leading to batch management for pigs. This type of management is most frequently encountered in France and is developing in other countries. In this type of herd, the complete life cycle for sows, from the recruitment of gilts to the culling of sows, with several reproduction cycles, and the complete growth of pigs, from their birth until they are slaughtered, are considered. The duration of the sow reproduction cycle depends on the age at weaning of piglets and is fixed here at 21 weeks. The growth period for pigs, related to the slaughtering weight, ranges between 24 and 27 weeks.
The modelling unit is the batch (of sows or pigs). This representation is deemed an appropriate level for further epidemiological use, as it adequately describes the within-herd contact structure. Thereby, it allows to study the infectious process that are horizontally transmitted by close contact between pigs or/and via the direct batch environment such as the floor, the food, etc. and resulting in a comparable exposure for all pigs in the same batch (e.g. Salmonella). In the model, batches of sows are defined as groups of equal size, composed of sows mated simultaneously. The sow herd is divided into seven batches with a 3-week period between two successive batch mating. The reproduction cycle for these sows is divided into three reproduction stages (service period, gestation period and suckling period) corresponding to the occupation duration of three types of rooms. Each batch is composed of sows and gilts. Each batch of pigs consists of the litters of a given batch of sows. The growth of pigs is divided into three stages (suckling, post-weaning, finishing), corresponding to the occupation duration of three types of rooms. In these rooms, a break of 1 week is allowed to clean, disinfect and dry the room before the entry of the next batch of pigs. All animals in a batch leave the room they occupied simultaneously unless (i) in mating and gestating rooms when failure conception occurs (sows) or (ii) in finishing room when pig growth is too slow.
The model implemented is a discrete-time dynamic model. It represents the time evolution of the number of animals within each batch. The time step is a week. The model is mainly deterministic but stochasticity is used to represent biological variability linked to: (i) insemination failure; (ii) litter size; and (iii) finishing pig growth that leads to a variable age at slaughtering weight for pigs within a batch. The duration of each reproduction and growing stage and therefore, the stay in each room, are fixed except for the finishing room. Moreover, the capacity of a room corresponds to the expected size of a batch.
Reproduction cycle of sows
The three stages of the sow reproduction cycle take place in three rooms:
• the mating room, corresponding to the service period, which covers the interval between weaning and service (1 week) plus the period until pregnancy testing (3 weeks);
• the gestating room (12 weeks);
• the farrowing room, in which sows are moved 1 week before farrowing for acclimatisation and stay until the weaning of piglets (4 weeks after farrowing).
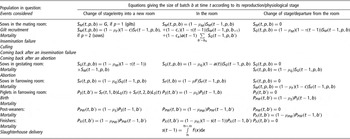
The model determines in which reproduction stage each batch of sows, b, is at each time, t. Each stage corresponds to a specific type of room X (mating, gestating or farrowing). The model allows to compute the number SX(t,p,b) of gilts (p = 1) and sows (p = 2) from the number of sows in the same batch b at time t − 1. During this time step, the number of sows is affected by the following demographic and reproductive processes: mortality, artificial insemination failure, abortion, culling and gilt recruitment.
Because of age-dependent variations in abortion rate and in litter size, two groups of parity p are considered: p = 1 corresponds to the gilts before their first farrowing and p = 2 to the sows after the first farrowing. Parameters of the sow group (p = 2) have been computed as a weighted mean of the reproduction performance values of multiparous sows (Institut Technique du Porc, 2006).
A mortality rate μ is applied at each time step; this rate is fixed for each stage but differs between stages. Every 3 weeks, the sows of one batch are inseminated in the mating room. Four weeks later, when they leave this room, an artificial insemination success rate τ is applied to the batch. To represent the between-batch variability, τ is separately drawn for each batch from a lognormal distribution of mean τ_m and standard deviation (s.d.) τ_d (equation). τ_m and τ_d are the same for all batches. Sows of the batch b who have failed to conceive are then either culled or transferred into the mating room where they join the following batch (b + 1) and are re-inseminated.
Abortion can take place during the entire gestating period. The cumulated proportion of the batch that undergoes abortion ηa is fixed. This proportion is lognormally distributed (mean a_m and s.d. a_d) over the 12 gestating weeks. For each gestating week, the abortion rate a is equal to the product of ηa and the area under the curve (probability density function) corresponding to that week. During the last gestating week, this rate is computed so as to reach the cumulated proportion ηa. The distribution and the cumulated proportion are the same for all batches. After an abortion, sows from batch b are either culled or transferred into the mating room where they are re-inseminated with those of the batch present in this room (between b + 2 and b + 5).
Sows are voluntarily culled at weaning and after a conception failure. The culling rate is constant over time but differs between sows culled at weaning, after insemination failure and after an abortion. To compensate for sow mortality and culling, a constant number of gilts G are recruited in each batch entering the mating room. This number is chosen as 25% of the total size of a farrowing room that corresponds to four gilts.
After the weaning of piglets, sows are moved back to the mating room. The farrowing room is then emptied for 1 week during which the cleaning–disinfecting and the drying period take place. The room is then ready to receive the following batch of sows.
Each batch of sows gives birth to a batch of pigs. The average litter size Ls is drawn for each batch from a normal distribution that differs between gilts (mean LG_m and s.d. LG_d) and sows (mean LS_m , and s.d. LS_d). The average litter sizes are then multiplied by the number of animals in each groups of parity, and the sum of piglets born corresponds to a batch of pigs.
The equations are given in Table 1.
Equations used in the model to calculate the number of animals in each room and animal flows between roomsFootnote †

† SM(t,p,b), SG(t,p,b), SF(t,p,b) = the batch size for sows in the mating room, the gestating room and the farrowing room, respectively; t = time; p = parity; b = number of the batch of sows considered; bG = number of the batches in the gestating room; G = fixed number of recruited gilts; μM, μG, μF = the fixed mortality rates for sows for service, gestating and lactating periods respectively; τ(t) = conception failure rate; c = fixed voluntary culling rate; a(t) = proportion of the batch which underwent an abortion; PS(t,b′), PPW(t,b′), PFi(t,b′) = the batch size for pigs in the farrowing, the post-weaning and the finishing rooms, respectively; b′ = number of the batch of pigs considered; μS, μPW, μFi = the fixed mortality rates of pigs in the farrowing, the post-weaning and the finishing rooms, respectively; s(t) = proportion of the batch sent to the slaughterhouse; ts = slaughterhouse departure time; Δ s = week-interval between two slaughterhouse deliveries; f(x) = the probability density function of the lognormal distribution of the mean age at the slaughterhouse delivery (LN (S_m, S_d)).
Pig rearing and delivery
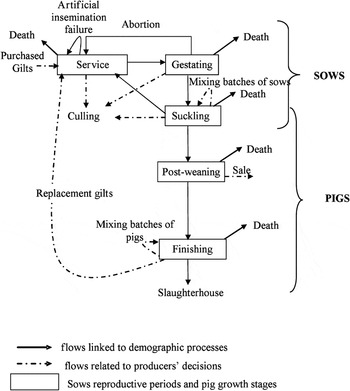
Pig growth is divided into three stages corresponding to the occupation of three types of rooms (duration of stay): farrowing rooms (suckling period of 4 weeks), post-weaning rooms (8 weeks) and finishing rooms (from 12 to 15 weeks; see Figure 1).
Simplified flow diagram of the farrow-to-finish production system.

The model determines in which physiological stage each batch b′ is at each time t. Each stage corresponds to a specific type of room X (farrowing, post-weaning or finishing). The model computes the number PX(t,b′) of pigs from the number at time t − 1. During this time step, the number of pigs is affected by the following processes: mortality and slaughterhouse delivery.
A mortality rate μ is applied at each time step; it is fixed for a given stage but differs between stages.
At each delivery time (every 2 weeks), producers need to send groups of finishers with a given slaughtering weight. Because of intra-batch pig growth variability, pigs from one batch leave the herd at different times. Consequently, groups of finishers sent to the slaughterhouse may often come from several batches. To represent pig growth, the age at which finishing pigs reach their slaughtering weight is calculated using a lognormal distribution (mean s_m and s.d. s_d). All batches are assumed to have the same mean age at slaughtering weight, but some between-batch variability exists in the dispersion of pig growth within each batch. The mean age is fixed for all batches. The s.d. for each batch is drawn in a normal distribution to represent the between-batch variability. The proportion s of the batch that has reached the slaughtering weight is derived from the probability density function of the lognormal distribution: at each delivery time t this proportion is equal to the area under the lognormal curve between the previous and the current delivery times.
The equations are given in Table 1.
Management of remaining finishing pigs
At the end of the finishing period, the finishing room needs to be emptied for the next batch arriving from the post-weaning stage. In that room, there may still be finishers below slaughtering weight and therefore considered out of range. The producers can nevertheless choose to deliver out-of-range finishing pigs to the slaughterhouse or to keep them in the herd until they reach slaughtering weight. For that, several decisions can be made, depending on producers’ priorities and, therefore the management system they apply.
Two types of herd management are represented and depend on whether the producers allow the remaining finishing pigs below slaughtering weight to be mixed (BM) or not (AIAO). No BM defines the AIAO management system, which corresponds to better biosecurity practices. In the BM management system, the number of pigs mixed at the end of the finishing period with the next finishing batch (closest in age, i.e. 3 weeks younger) depends on the finishing room overload accepted by producers.
These two types of herd management can be altered by the availability of an extra room (ER) at the end of the finishing period. In this case, finishers below slaughtering weight are transferred to the ER instead of being delivered to the slaughterhouse. The number of pigs transferred is limited by the room’s capacity. The accepted overload of finishing rooms corresponds to the maximum number of finishing pigs reared in the room divided by the total capacity of this room. This accepted overload is fixed at 112.5% for each finishing room.
The two types of herd management can also be combined with two producers’ decisions. The first decision is the suppression of the drying period between two consecutive batches, in order to extend the stay of the pigs in their own finishing room. This is called the ‘no drying period’ (NDP) decision. If so, the decontamination process in the finishing room is not fully implemented before the entry of the next batch in that room. The second decision is the sale of the next batch supposed to enter the finishing room, at the end of its post-weaning period (SPW). The remaining finishers below slaughtering weight can then complete their growth in their own finishing room.
The various combinations of the two types of herd management system (AIAO and BM), the availability of an ER and the two producers’ decisions (NDP and SPW) define 16 different management systems. The strict AIAO management system, i.e. no BM with no ER, a complete drying period, and no sale at post-weaning, corresponds to the simplest and best system in terms of biosecurity practices.
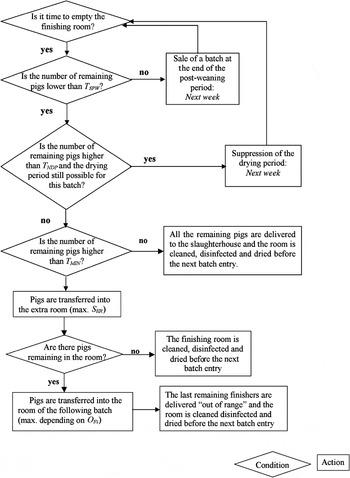
Depending on the farm structure, all management options are not always available in the herd. If all the options are available, a fixed order of decisions is determined as shown in Figure 2. On the contrary, if all the options may not be available, the priorities are adapted according to the batch management system applied. When confronted to finishers below slaughtering weight in a batch, producers’ choose for that batch, by order of preference, the ER, NDP or SPW decision. However, their choice is constrained by the number of remaining finishers: ER can only be chosen up to the ER capacity (plus the accepted overload of the finishing room for the BM management system); NDP is implemented if the number is higher than a given TNDP threshold but lower than a fixed TSPW threshold, above which SPW is chosen (TNDP < TSPW).
Diagram of decisions for pig slaughterhouse delivery for a particular batch management systems allowing batch mixing (BM), the suppression of the drying period (NDP), the selling of a batch at the end of the post-weaning period (SPW) and the presence of an extra room (ER) in the farm. TSPW = threshold above which a batch at the end of the post-weaning period is sold; TNDP = threshold above which the drying period is suppressed; TMIN = threshold below which the remaining pigs that have not reached slaughtering weight are delivered; SER = extra room size; OFI = overload in the finishing room.

Description of a particular management system
The delivery process that applies to each batch at the end of the finishing stage can be broken down into a succession of decision steps. These steps are illustrated in the decision diagram in Figure 2 for the management system involving all possible producers’ decisions, i.e. the BM management system with an ER and with the possibility of suppressing the drying period and of sale a batch at post-weaning.
Contact structure resulting from management of finishing pigs
Contacts among animals within a batch are assumed to be homogeneous. At the herd level however, batch management generates a heterogeneous contact structure. We focused on two types of contact between batches at the end of the finishing period:
• the contact via the room, between two successive batches; when the drying period has been suppressed (NDP);
• the contact via the animals, when BM occurs.
Contact is affected by the herd management implemented.
Simulation study
The aim of the simulation study was to describe how far the adaptations from the recommended herd management influence the contact structure and pig delivery, by running the model described above.
The model was implemented in Scilab 4.0 (www.scilab.org).
Parameters and initialisation
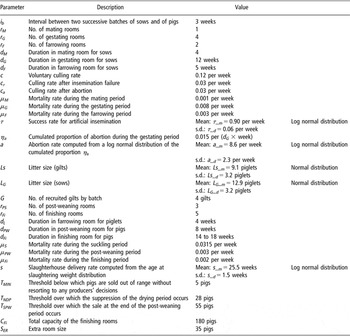
Parameter values used in this study come from literature and from expert opinions (Table 2). The mean age at slaughtering weight was calculated from a standardised age at a live weight of 115 kg. Moreover, thresholds used in the model to trigger producers’ decisions were estimated from a farm survey (Hébert et al., Reference Hébert, Lurette, Fourichon, Seegers and Belloc2007). The model was initialised by assigning a number of sows and pigs to each batch present on the farm. The batches of sows were evenly distributed over a reproduction cycle and the total number of sows in the farm was around 120 distributed into seven batches. The batches of pigs were distributed over the growth process, the number of piglets at farrowing being around 180.
Definition and values of the parameters used in the modelFootnote †
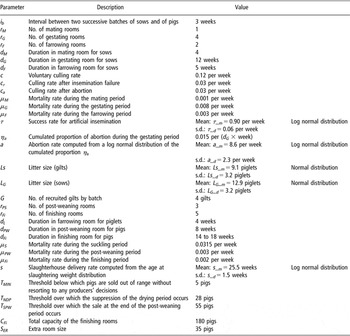
† Values came from Institut Technique du Porc (2000) and from expert opinions.
Herd management systems tested
We choose to test the 16 herd management systems described above. These management systems represent what is usually observed.
Simulation output
To understand the influence of the management systems on the contact structure, the proportion of batches that made contact with another batch, via BM or via the room, was assessed. The proportion of batches that made contact via BM was computed over the number of pig batches in the simulation. By definition, contact via BM never occurred for the AIAO management systems. A contact via the room counted when the drying period was suppressed at the end of the finishing period.
To show the compromise between pig herd productivity and the implementation of internal biosecurity practices, the percentage of pigs delivered out of range was calculated for each herd management.
All results were obtained from 150 simulations over a 5-year period (260 weeks). This number of simulations was sufficient to stabilise the mean and s.d. of the results during the simulations, i.e. these two values did not vary when more simulations were included. Statistical analyses were performed using anova (α = 0.05) and means were compared using the Tukey test.
Sensitivity analysis
A sensitivity analysis was performed to investigate the effects of key model parameters on simulation output. The first parameters considered in our analysis were the mean age at slaughtering weight and its s.d., which represent pig growth variation within a batch. The mean age parameter value was reported in the literature. However, the variation of this value was not specified. The other parameters tested were the threshold for suppressing the drying period TNDP, the threshold for selling a batch at the end of the post-weaning period TSPW, the accepted overload in the finishing rooms OFi and the size of the ER SER. These last parameters are related to producers’ decisions and farm facilities, so they vary from one herd to another. The parameters tested varied individually, their initial values given in Table 2 increased and decreased by 20%.
Results
Herd productivity
The mean annual culling rate (the number of culled sows divided by the total number of sows in the herd) was 34.7%. Sow productivity represented by the number of weaned piglets per productive sow per year was 26.7 piglets (s.d. = 0.6). The simulated mean number of pigs delivered to slaughterhouse each year was 2670 pigs (s.d. = 65).
Influence of herd management systems
The impact of the 16 management systems on the proportion of batches that made contact via BM or via the room and on the percentage of pigs delivered out of range, with the parameters given in Table 2, are described below.
Producers’ decisions implemented
Whatever the management system tested, SPW affected less than 1% of the pig batches and had no significant influence on the results described below, so it will not be described any further. NDP induced a very low proportion of batches that made contact via the room (between 0% and 3% of the pig batches). When present in the herd, the use of the ER was frequent (between 65% and 87%).
Influence of herd management systems on the contact structure
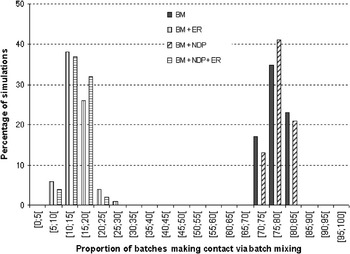
The proportion of batches that made contact via BM varied significantly (P < 0.001) between the different management systems allowing BM (Figure 3). The BM management system implemented alone showed a rather high proportion of batches that made contact (mean 0.78, s.d. 0.05). The impact of the suppression of the drying period was negligible. However, the use of an ER (combined with BM) led to a significantly lower proportion of batches that made contact (mean 0.14, s.d. 0.04).
Distribution in the proportion of batches that made contact with another batch via batch mixing (BM) at the end of the finishing period according to four herd management systems (proportion averaged over 150 simulations). BM = implementation of BM at the end of the finishing period; ER = presence of an extra room at the end of the finishing period; NDP = implementation of the drying period suppression at the end of the finishing period.

Influence of herd management system on pig delivery
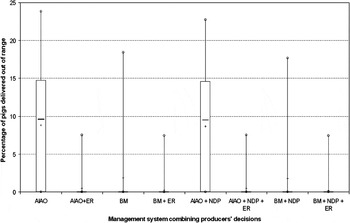
The percentage of pigs delivered out of range to the slaughterhouse over the simulation period varied significantly (P < 0.001) between the management systems tested, ranging between 0.1% (s.d. 0.1) for BM + NDP + ER and 9.3% (s.d. 0.1) for AIAO (Figure 4). It decreased with each adaptation from the recommended management system. The use of an ER reduced this percentage by five times. BM had a limited effect on the decrease of pigs delivered out of range when there was an ER. The suppression of the drying period had no significant effect. Moreover, this percentage showed a high within-management variability for all the management systems tested.
Percentage of pigs delivered out of range according to eight management systems implemented at the end of the finishing period (proportion over 150 simulations). Mean +, median −, 25th and 75th percentiles □, minimum and maximum values ↕ (over 150 simulations). AIAO = all-in/all-out herd management system; BM = implementation of batch mixing at the end of the finishing period; ER = presence of an extra room at the end of the finishing period; NDP = implementation of the drying period suppression at the end of the finishing period.

Sensitivity analysis
The influence of pig growth variation
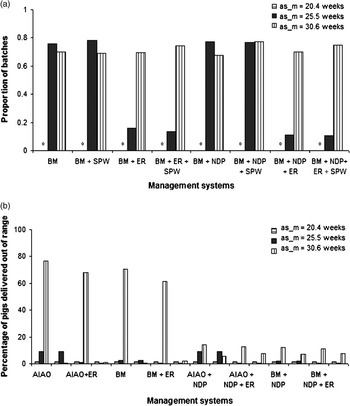
Variation in the mean age at slaughterhouse delivery had a significant effect on contact structure and on the pig delivery (Figure 5). A reduction by 20% avoided all types of contact between batches (Figure 5a), and the percentage of pigs delivered out of range became very low (Figure 5b), whatever the management systems tested. When its value was increased by 20%, SPW was triggered frequently (30% to 45% of the batches). The proportion of batches that made contact via BM increased by at least four times in all the BM management systems with ER (Figure 5a). The proportion of batches that made contact via the room became very high (between 0.8 and 0.9) for the NDP management systems and high (between 0.4 and 0.5) for the NDP management systems with SPW. The percentage of pigs delivered out of range increased to very high values (between 60% and 80%) for the management systems without NDP or SPW (Figure 5b).
Sensitivity analysis on the mean age at slaughterhouse delivery (αS_m) (proportion averaged over 150 simulations). (a) Proportion of batches that made contact via batch mixing (BM) for BM management systems. (b) Percentage of pigs delivered out of range according to the value of the mean age at slaughterhouse delivery for all management systems. AIAO = all-in/all-out herd management system; BM = implementation of BM at the end of the finishing period; ER = presence of an extra room at the end of the finishing period; SPW = implementation of the selling of a batch at the end of the post-weaning period; NDP = implementation of the drying period suppression at the end of the finishing period.

The variation in the s.d. value of the age at slaughtering weight had no significant effect (P > 0.05) on all the results within the range of values tested.
The influence of the threshold variations
Only variation of the threshold above which producers decide to suppress the drying period TNDP had an effect. A decrease of TNDP increased the proportion of batches that made contact via the room from 0.03 to 0.11.
The influence of the finishing room overload and the ER size
An increase (respectively, a decrease) in the finishing room overload led to an increase (respectively, a decrease) in the proportion of batches in contact via BM for all BM systems without ER (Table 3). The overload in the finishing rooms and the ER size had no effect on contact via the room. The percentage of pigs delivered out of range for the BM systems remained rather low (<5%), and it was negligible for management systems with ER (<0.4%).
Sensitivity analysis results in the variation of the finishing room overload on the proportion of batches that made contact via batch mixing

†BM = batch mixing; SPW = post-weaning period; ER = extra room; NDP = no drying period.
The proportion of batches in contact via BM decreased significantly (P < 0.01) (proportion values: 0.22 to 0.26, 0.10 to 0.12, 0.01 to 0.02) when the size of the ER increased (room sizes: 28, 35, 42, respectively) whatever the system.
Discussion
The farrow-to-finish herd model developed for this study simulates animal flows through their reproductive or physiological stages and through the farm rooms in a batch management context. It takes into account biological variability in reproduction and growth processes. It also represents the producer’s management decisions that modify these flows, with a special focus on the finishing stage. It allowed us to assess the impact of batch management adaptations on the contact structure within the herd and on pig delivery.
This model integrates knowledge from a number of sources. It was calibrated using published data and expert opinions. We only considered two groups of parity for sows, but even with this obvious simplification, we obtained consistent productivity results. Even if the study of productivity was not the primary goal of the model, the results obtained on piglet production were representative of farrow-to-finish pig herds, which reported a mean number of weaned piglets per sow per year equal to 26.8 (Institut Technique du Porc, 2006). Moreover, our simulated culling rate was in the range of values reported in the literature (between 26% and 70%, Stalder et al., Reference Stalder, Knauer, Baas, Rotschild and Mabry2004). The indirect representation of pig growth by age at slaughter allowed us to obtain proportions of out-of-range finishing pigs consistent with production performance. A published model, representing the influence of pig growth variation on marketing management within an AIAO system (Schinckel et al., 2005), obtained a percentage of pigs delivered out of range close to 7% to 8% when pigs were delivered at their usual age. This result is close to the percentage obtained with our model. Finally, a sensitivity analysis was performed on the parameters likely to vary among farms: pig growth and producers’ decision thresholds. It showed that, when pig growth was normal, pig delivery and contact between batches depended more on the ER availability than on producers’ decision thresholds.
Depending on their variability in a farm and their influence on the dynamics of production of slaughter pigs, parameters were either fixed or triggered stochastically.
We assumed that the farm structure and the producers’ decisions rules do not change over time. As a consequence, the related parameters are fixed (e.g. room size, thresholds for actions).
For biological events, several levels of variability were represented. We used fixed parameters to represent biological events that hardly influence batch size and pig growth in routine condition (e.g. mortality rates after weaning).
On the contrary, parameters that show large variation between animals or between batches in current situations were variable. Average litter size and conception rate therefore varied between batches in the model.
We used a variable s.d. of the mean age at slaughtering weight because of a high inter-animal variability exists and very slow growing pigs can occur in some batches but not frequently. However, under the same conditions (same food, same health status, etc.) the mean age at slaughtering weight is quite constant over time within one herd. It was therefore fixed.
Decision to treat parameters as fixed or variable was a compromise between parsimony of the model and variations likely to impair batch management.
Adaptations from the recommended AIAO management system are mostly due to problems in pig growth, so producers have to find a compromise between production and biosecurity. Among various adaptations considered, this study showed that the use of an ER had the highest effect on pig delivery when pig growth was normal. When the room was present, it was used quasi-systematically, as observed in a farm survey (Hébert et al., Reference Hébert, Lurette, Fourichon, Seegers and Belloc2007). In our study, this adaptation seemed to be the best decision both to avoid delivering too many out-of-range pigs to the slaughterhouse and to reduce the contact between batches.
When pig growth was slow, the sale of a batch at the end of the post-weaning period was more efficient to reduce the number of out-of-range pigs than the suppression of the drying period, the latter being more efficient than BM. The high percentage of pigs delivered out of range in a case of slow pig growth was due to the duration of pig growth, which was greater than the available rooms on the farm. This situation became unbearable and producers had to make decisions. These results illustrate that slower pig growth induces a more difficult choice between maintaining the delivery of pigs in the range and implementing the recommended management system. Whatever decisions the producers made, they either had to face a reduction in their revenue due to the delivery of out-of-range finishing pigs or the sale of post-weaning batches, or they had to lower the level of their biosecurity practices.
Herd management adaptations will not have the same impact on the spread of a pathogen depending on its transmission characteristics. This herd model is adapted for further epidemiological studies dealing with pathogens transmitted via close contact and/or environment (directly via animals or indirectly, e.g. via rooms). However, choosing the batch as the modelling unit could make the model unsuitable to study certain infectious process for which exposure is not the same for all animals of the batch and depends on their characteristics. These types of infectious process should need to be studied, for instance, at the litter level or at the individual level. It is the case, for example, when piglet sensitivity to a pathogen varies within and between litters in a batch.