INTRODUCTION
The weed flora in fields varies considerably in time and between fields, both in terms of density and species composition. Besides pedo-climatic conditions, cropping systems are responsible for differences and shifts in weed flora (McCloskey et al. Reference McCloskey, Firbank, Watkinson and Webb1996; Bàrberi & Lo Cascio Reference Bàrberi and Lo Cascio2001; Menalled et al. Reference Menalled, Gross and Hammond2001; Cardina et al. Reference Cardina, Herms and Doohan2002; Fried et al. Reference Fried, Norton and Reboud2008). Among the various cropping system components, herbicides have in the past been the major determinant of weed flora, at least in intensive cropping systems (e.g. Andersson & Milberg Reference Andersson and Milberg1998). However, herbicide applications tend to become less frequent, because of environmental problems (e.g. ground and surface water; IFEN 2007) and regulatory measures (e.g. the EU directive REACH, EU 2006) and less efficient because of herbicide resistance in weeds (Délye Reference Délye2005; Powles & Yu Reference Powles, Yu, Merchant, Briggs and Ort2010). As a consequence, cropping system components other than herbicides will play a major role in determining weed flora. Moreover, climate change and the resulting changes in cropping systems are expected to lessen the efficiency and predictability of individual weed management measures; future weed management strategies should thus rely on a combination of techniques (Rodenburg et al. Reference Rodenburg, Meinke and Johnson2011). This will remain necessary even if novel weed control measures such as biocontrol, newly domesticated species or engineered weed-resistant crops become available (Gressel Reference Gressel2011). The cropping system components to consider not only consist of the cultural techniques used to manage a given crop but also of past crops and operations (Bàrberi & Lo Cascio Reference Bàrberi and Lo Cascio2001). Indeed, weed seeds can survive several years in soil, and seedlings may emerge several years after the seed having been produced (Burnside et al. Reference Burnside, Wilson, Weisberg and Hubbard1996; Murdoch & Ellis Reference Murdoch, Ellis and Fenner2000; Conn et al. Reference Conn, Beattie and Blanchard2006).
Consequently, both scientists and farmers are confronted by a similar question: which current and past cropping system components will influence the present weed flora and how will they influence this flora? Farmers have a practical concern, wanting to optimize their cropping system for weed control; they thus need to know which current management techniques will present the strongest effect and how high the weed risk resulting from previous management operations is. While scientists aim, in the long term, to contribute to this farming objective, they have a more immediate concern when studying weed flora in fields: which cropping history variables are the most pertinent for understanding the current weed flora and should be collected in farm surveys and monitoring schemes? Can a detailed field history record be replaced by a smaller number of easily answered synthetic questions to reduce the time spent on a single survey and thus be able to increase the number and range of surveyed situations?
Bohan et al. (Reference Bohan, Powers, Champion, Haughton, Hawes, Squire, Cussans and Mertens2011) tried to answer similar questions in a study on weed seed banks when they simplified detailed field history into broader crop management classes describing the seasons of sowing, crop type and weed target for herbicide application. Despite surveying more than 250 fields spread over different regions, their analysed sample was tiny compared to the possible combinations of cropping system components and pedo-climatic conditions, and the available data on field histories was not necessarily sufficiently detailed to identify the variables pertinent for understanding weed infestation.
The present study proposes to identify the major cropping system variables relevant for optimizing cropping systems and field surveys, using a sensitivity analysis to input variables of a cropping system model that predicts weed dynamics in interaction with pedo-climatic conditions. The objective of this sensitivity analysis was (1) to rank past and current cropping system components according to the resulting decrease in weed infestation, and (2) to test a series of synthetic cropping system indicators for their ability to discriminate situations according to the current weed flora. In order to test a large range of possible combinations of crop successions and management techniques, a global sensitivity analysis of the model to cropping system variables was run, based on Monte Carlo simulations where all input variables were made to vary randomly and simultaneously (Saltelli et al. Reference Saltelli, Chan and Scott2000). This procedure has already been used in a previous sensitivity analysis with ‘weed=f (cropping system)’ models and is useful for ranking variables over a large range of situations while taking into account the interactions between the variables (Colbach et al. Reference Colbach, Molinari and Clermont-Dauphin2004; Tricault et al. Reference Tricault, Darmency and Colbach2009).
To date, no multi-specific model exists that quantifies the effects of a large range of cropping system components and their interactions with pedo-climatic conditions (see reviews by Doyle Reference Doyle1997; Colbach & Debaeke Reference Colbach and Debaeke1998; Holst et al. Reference Holst, Rasmussen and Bastiaans2007; Colbach Reference Colbach2010). Pending the development of such as model (e.g. Gardarin et al.in press), a mono-specific cropping system model was chosen, integrating the necessary cropping system×environment interactions to develop the methodology and produce results for a major functional group of weed species. The chosen cropping system model was AlomySys (Colbach et al. Reference Colbach, Busset, Yamada, Dürr and Caneill2006a, b, Reference Colbach, Chauvel, Gauvrit and Munier-Jolain2007, Reference Colbach, Kurstjens, Munier-Jolain, Dulout-Dalbiès and Doré2010b) which is, to date, the only model integrating a large range of cropping system components and their interactions with pedo-climatic conditions (see reviews by Doyle Reference Doyle1997; Colbach & Debaeke Reference Colbach and Debaeke1998; Holst et al. Reference Holst, Rasmussen and Bastiaans2007; Colbach Reference Colbach2010). AlomySys was developed for a grass-weed species, Alopecurus myosuroides Huds. (blackgrass), a serious agricultural pest (Hole et al. Reference Hole, Perkins, Wilson, Alexander, Grice and Evans2005) frequently found in autumn-sown crop rotations of Atlantic European countries (Van Himme & Bulcke Reference Van Himme and Bulcke1975) and increasingly tolerant to various herbicides (Délye et al. Reference Délye, Menchari, Guillemin, Matéjicek, Michel, Camilleri and Chauvel2007; Moss et al. Reference Moss, Perryman and Tatnell2007).
MATERIALS AND METHODS
The simulation model AlomySys
The structure of AlomySys has been described in detail in previous studies (Colbach et al. Reference Colbach, Busset, Yamada, Dürr and Caneill2006a, Reference Colbach, Dürr, Roger-Estrade, Chauvel and Caneillb, Reference Colbach, Chauvel, Gauvrit and Munier-Jolain2007, Reference Colbach, Kurstjens, Munier-Jolain, Dulout-Dalbiès and Doré2010b) and, more briefly, in the companion to the present paper (Colbach & Mézière Reference Andersson and Milberg2012). The input variables of AlomySys consist of (1) the daily weather data over the simulated period and the resulting hydro-thermal soil conditions, (2) the soil texture, depth and gravel content, (3) the initial weed infestation, (4) the cropping system consisting of the crops and their crop management techniques, and (5) the width of the farming equipment. These input variables influence the annual life-cycle of blackgrass (Supplementary Material available online at http://journals.cambridge.org/AGS), in interaction with blackgrass stages, crop stages and environmental conditions. The AlomySys output variable used in the present study was the weed seed production up to crop harvest. AlomySys was evaluated with independent field observations and was shown to correctly predict seed survival, blackgrass emergence and multi-year dynamics in intensive and integrated cropping systems; in no-till systems, seed survival was overestimated though emergence was still predicted correctly (Colbach et al. Reference Colbach, Busset, Yamada, Dürr and Caneill2006a, Reference Colbach, Chauvel, Gauvrit and Munier-Jolain2007).
The simulation plan
The objective of the present study was to rank cropping system variables according to their effects on weed infestation, to determine how many past years must be surveyed in order to understand current weed infestation and to identify easy-to-survey cropping system indicators for predicting weed risk. The simulation plan consisted of (1) simultaneously randomizing all model input variables, (2) running AlomySys over several years and (3) analysing the weed infestation in a last winter wheat (as the crop in which the studied weed species most commonly occurs) as a function of current and past crops and management techniques.
A total of 93 993 random cropping systems were run. In addition, 13 000 systems were simulated where one or several variables were constrained, focusing on systems that were rarely or never obtained in the random simulations:
• 2000 organic systems (without any mineral fertilizer or herbicides, but not necessarily with a long and diversified rotation),
• 1000 ploughed systems, with mouldboard ploughing before every crop,
• 1000 un-ploughed systems,
• 1000 frequently tilled systems, with at least six tillage operations before every crop, with a rotation consisting of only annual crops,
• 1000 frequently sprayed systems, with at least two herbicide applications per year (except in grassland and pastures),
• 5000 no-till systems,
• 1000 winter wheat monocultures, and
• 1000 systems with associated or undersown crops in all annual crops.
Simulations started with 100 weed plants/m2 emerging during the first simulated crop, which was a winter wheat (to maximize initial infestation and reproduction), lasted for 20 years (which, according to preliminary simulations, was sufficient to obtain an infestation independent of the initial infestation at simulation onset), and always finished with a winter wheat.
Weed seed production at the harvest of the last year were kept as an output variable for analysis. This variable was identified in a previous study as the one discriminating model input variables best (Colbach et al. Reference Colbach, Dürr, Roger-Estrade, Chauvel and Caneill2006b; Supplementary Material). Soil texture, weather, crop rotation and management variables during the last winter wheat as well as the five preceding years of the simulation were used as explanatory variables. In the second step, the detailed annual variables were aggregated into synthetic variables to determine a simplified survey questionnaire comprising the major cropping system effects on weeds.
Randomization of input variables
Details on the range and the probability for choosing options for the different crop management variables are given in the supplementary material available online (Supplementary Material). Soil characteristics and the width of farming equipment were chosen randomly at the onset of the simulation. Then, for each simulated year,
• The weather dataset was chosen from a collection of 17 yearly weather sets from Dijon, France (5° 2′E, 47° 20′N, 220 m asl), ranging from 1988 to 2003.
• The crop (except the first and the last ones) was chosen from among 24 possible crops, comprising winter and spring cereals, legumes and other crops, temporary pasture as well as unsown setaside (Table 1).
• The cultivation techniques were chosen from options which varied with crop type. Ranges were made as large as possible but the logical ordering of operations was always satisfied (e.g. no tillage after sowing).
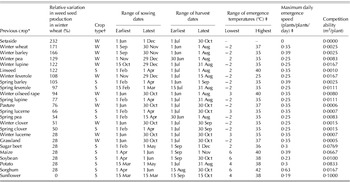
Ranking of previous crops based on Eqn (2) analysing weed seed production as a function of soil, weather, rotation (year 1–5) and crop management of current wheat (year 0). Crop management of previous crops was disregarded to obtain a general crop ranking

* Previous crops were ranked according to the variation in weed seed production in the following winter wheat, starting with the one resulting in the highest seed production; if previous crops presented the same relative weed risk (here for instance winter lucerne and grassland), they were further discriminated with their ranking as pre-previous crop.
† W, winter crop or unsown setaside; S, spring or summer crop.
‡ Crop emergence parameters in AlomySys were based on Donatelli & Marchetti (Reference Donatelli and Marchetti1994).
Statistical analysis
Correlation with past weed infestations
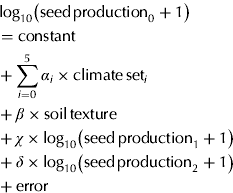
In the first regression, the weed infestation (characterized by weed seed production/m2, seed production0) in the current winter wheat was analysed as a function of the weed infestation of the two preceding crops (seed production1 and seed production2) as well as pedo-climatic conditions of the current and the past 5 years (climate set and soil texture):
 $$\eqalign{& \log _{10} \left( {{\rm seed}\,{\rm production}_0 + 1} \right) \cr & = {\rm constant} \cr & + \sum\limits_{i = 0}^5 {\alpha _i \times {\rm climate}\,{\rm set}_i} \cr & + \beta \times {\rm soil}\,{\rm texture} \cr & + \chi \times \log _{10} \left( {{\rm seed}\,{\rm production}_1 + 1} \right) \cr & + \delta \times \log _{10} \left( {{\rm seed}\,{\rm production}_2 + 1} \right) \cr & + {\rm error}} $$
α i, β, χ and δ were regression parameters, with α i depending on the simulated year i (ranging from 0=analysed winter wheat to 5 years before).
Crop ranking
The next regression aimed at ranking past crops as a function of the weed risk in the analysed winter wheat:
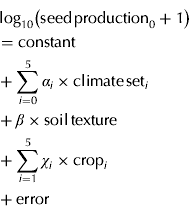 $$\eqalign{& \log _{10} \left( {{\rm seed}\,{\rm production}_0 + 1} \right) \cr & = {\rm constant} \cr & + \sum\limits_{i = 0}^5 {\alpha _i \times {\rm climate}\,{\rm set}_i} \cr & + \beta \times {\rm soil}\,{\rm texture} \cr & + \sum\limits_{i = 1}^5 {\chi _i \times {\rm crop}_i} \cr & + {\rm error}} $$
Regression parameters α i and χ i depended on the simulated year i, parameter β was a constant. Previous crops were ranked according to the variation in weed seed production occurring in the following winter wheat evaluated with χ 1; if two previous crop species presented the same subsequent weed risk (i.e. same χ 1), they were discriminated using the variation in weed risk resulting from their presence as pre-previous crops (i.e. χ 2). The relative variations in weed infestation resulting from the previous crop species was calculated as  $10^{\chi _1} - 10^{\min (\chi _1 )} $, where min(χ 1) was the lowest value of regression parameter χ i for the previous crop. This indicator is the backtransformed ratio of the previous crop species effect in Eqn (2) relative to the species leading to the lowest weed risk. The crop ranking was analysed with a linear regression explaining χ 1 as a function of crop characteristics (Table 2):
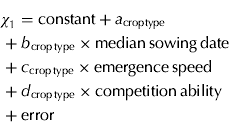 $$\eqalign{ & \chi _{\rm 1} = {\rm constant} + a_{{\rm crop type}} \cr & + b_{{\rm crop}\,{\rm type}} \times {\rm median}\,{\rm sowing}\,{\rm date} \cr &+ c_{{\rm crop}\,{\rm type}} \times {\rm emergence}\,{\rm speed} \cr & + d_{{\rm crop}\,{\rm type}} \times {\rm competition}\,{\rm ability} \cr & + {\rm error}} $$
To illustrate the quantitative effects of crop species characteristics, the relative effect on weed seed production was calculated from regression parameters p as 10pv−1, where v was the variation tested for the species characteristic. This indicator has already been used successfully in previous sensitivity analyses (Tricault et al. Reference Tricault, Darmency and Colbach2009) and is the backtransformed ratio of the effect of the variation in the linear regression relative to zero variation.
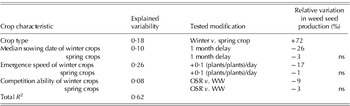
Explanation of the crop risk as a function of crop characteristics. Results of Eqn (3)

ns=regression parameter not significantly different from zero at P⩽0·05. Explained variability is partial R 2.
Effect of crop management techniques
The last regression aimed at analysed crop management techniques:
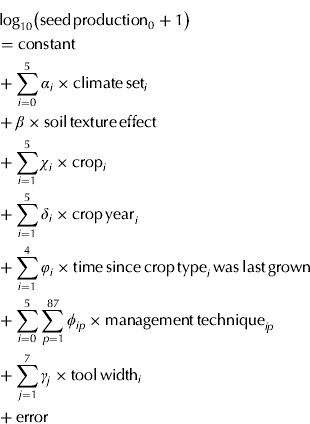 $$\eqalign{ & \log _{10} \left( {{\rm seed}\,{\rm production}_0 + 1} \right) \cr & = {\rm constant} \cr & + \sum\limits_{i = 0}^5 {\alpha _i \times {\rm climate}\,{\rm set}_i} \cr & + \beta \times {\rm soil}\,{\rm texture}\,{\rm effect} \cr & + \sum\limits_{i = 1}^5 {\chi _i \times {\rm crop}_i} \cr & + \sum\limits_{i = 1}^5 {\delta _i \times {\rm crop}\,{\rm year}_i} \cr & + \sum\limits_{i = 1}^4 {\varphi _i \times {\rm time}\,{\rm since}\,{\rm crop}\,{\rm type}_i \,{\rm was}\,{\rm last}\,{\rm grown}} \cr & + \sum\limits_{i = 0}^5 {\sum\limits_{\,p = 1}^{87} {\phi _{ip} \times {\rm management}\,{\rm technique}_{ip}}} \cr & + \sum\limits_{\,j = 1}^7 {\gamma _j \times {\rm tool}\,{\rm width}_i} \cr & + {\rm error}} $$
Regression parameters α i, χ i, δ i and φ i, varied with the simulated year i, parameter ϕ ip also depended on the simulated cultivation technique p; β was independent of the year and γ j depended on the management tool j (e.g. tillage and mechanical weeding tools, sowing or spraying equipment). The effect of crop succession was described by the crop species (cropi), the crop year (1 for annual crops and setaside; 1 for the year multi-annuals were sown, 2 for the following years, etc.) and the number of years since the different crop types (i.e. winter crops, spring crops and multi-annual crops or unsown setaside) were last grown.
Crop management techniques were described by synthetic variables for each simulated year. Each year, tillage was described by 26 variables consisting of the total number of operations if no ploughing, number of operations before and after ploughing if any, number of rolling operations; the occurrence of ploughing, its width and skim-coulter characteristics: depth, width; the dates of ploughing and the first post-ploughing, those of the first and last tillage operations; the tilling depths, tractor speeds and tools at these four major dates; mean time between operations as well as mean speed and depth for all operations (Table 3a). The variables for remaining variables were the amount of applied mineral nitrogen and the harvest date (Table 3b–e). These variables resulted in 87 management variables per crop, increased by the weather set, the seed bank characteristics and the soil texture (Supplementary Material). Various combinations of  $\sum\nolimits_{i = 0}^5 {\sum\nolimits_{\,p = 1}^{87} {\phi _{ip} \times {\rm management}\,{\rm technique}_{ip}}} $ were constants and therefore not introduced into the regression model. For instance, there could be no mowing in annual crops and no tillage in unsown setaside; there were no tillage dates in untilled fields, etc. To illustrate the quantitative effects of crop management variables, the relative effect on weed seed production was calculated from regression parameters ϕip as 10ϕv−1, where v was the tested factor variation (see details in the companion paper, Colbach & Mézière Reference Colbach and Mézière2012).
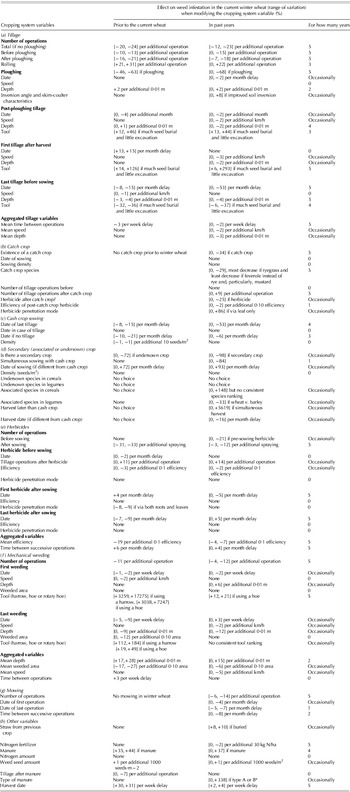
Effect of current and past crop management techniques on weed seed production in winter wheat. Synthesis of the results from Eqn (4), showing minimum and maximum variations in weed seed production observed with the two datasets for the specified years

* Type A is cattle, sheep, goat and horse manure; type B is cattle slurry, pig and straw-rich poultry manure, type C is pig and poultry slurry as well as straw-poor poultry manure.
Statistical procedures
In all regressions, qualitative variables (e.g. crop species and tools) were transformed into quantitative variables using Boolean coding. This made possible the use of the REG procedure of SAS (version 8.01), with the BACKWARD option to successively eliminate the least significant input variables from the regression model until only effects significant at P<0·05 remained. Although weather and soil texture variables were included in the present analysis, their results will only be presented in the Supplementary Material available online (Supplementary Material) to focus on cropping system components.
Robustness of results
When applying Eqn (4) to the complete 103 000-line dataset, it appeared that unexplained variability remained high, even when using the variables of last 10 (instead of 5) years as explanatory variables. To evaluate the robustness of the regression results, the dataset was split into two, and Eqn (4) was applied separately to each subset. The tables of results presented in the main body of the paper are a synthesis of these results; the detailed results can be found in the Supplementary Material available online (Supplementary Material).
Identifying synthetic cropping system variables
Finally, based on the analysis with the annual variables, a series of synthetic variables were determined which were assumed to discriminate the different situations according to the weed seed production in the final winter wheat. These variables could be both categorical (e.g. organic v. non-organic system) and quantitative (e.g. frequency of mouldboard ploughing during the last 5 years). These variables were determined for the 5, 10, 15 and 19 years preceding the analysed wheat, respectively, resulting in a total of 200 tested variables. In a first step, each of these variables was tested in a simple regression with the weed seed production of year 0 as output variable. The N most important ones (based on partial R 2) were then introduced into a final multivariate regression, including soil characteristics but not weather:
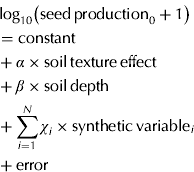 $$\eqalign{& \log _{10} \left( {{\rm seed}\,{\rm production}_0 + 1} \right) \cr & = {\rm constant} \cr & + \alpha \times {\rm soil}\,{\rm texture}\,{\rm effect} \cr & + \beta \times {\rm soil}\,{\rm depth} \cr & + \sum\limits_{i = 1}^N {\chi _i \times {\rm synthetic}\,{\rm variable}_i} \cr & + {\rm error}} $$
Weather was excluded because the present simulations only used past weather sets from the Dijon area which cannot be predictive, either for future years or different regions. The predictive quality (in terms of absolute weed density) of the resulting model will, of course, be lower than that of Eqn (4) using detailed, annual variables. However, the simplified model can still produce good ranking prediction. The latter was evaluated with a Spearman correlation between the weed seed production in winter wheat simulated by AlomySys and the predictions for the same produced by Eqn (5).
RESULTS
Relationship with previous years' infestations
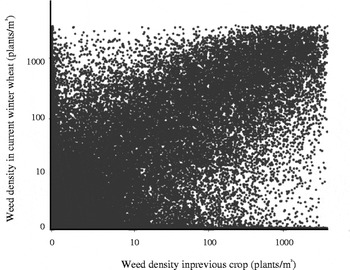
When studying the weed seed production in the current winter wheat as a function of the weed infestation of the two previous years (Eqn 1), it appeared that these past infestations explained approximately one-third of the variability of the current weed infestation (partial R 2 of 0·32, results not shown). The previous year's infestation contributed the largest part of this effect (partial R 2=0·24). Pedo-climatic variables explained 0·14 of the variability and the rest was unexplained (1−R 2=0·55, with total R 2=0·45). Thus, there remained considerable room for manoeuvre for crop management techniques to act, for a given pedo-climatic and weed infestation context. It was even possible for a field free of weeds during the previous year to become highly infested and for a previously highly infested field to become weed-free (Fig. 1).
Weed seed infestation in winter wheat as a function of the weed infestation in the previous crop. Results simulated with AlomySys with randomly chosen cropping systems and pedo-climatic conditions (103 000 data points).

Ranking of crops as a function of weed risk
The weed seed production in the current winter wheat varied considerably with the crop species grown during the previous year, with the highest values after setaside and winter cereals, and the lowest after summer crops, particularly sunflower (Table 1).
When analysing the crop ranking as a function of crop characteristics (Table 2), the most important factor was indeed the timing of the cropping season relative to the weed seed dormancy cycle: winter v. spring or summer crops resulted in a higher weed seed production in the following winter wheat (a mean increase of 72% compared to spring crops, Table 2); later usual sowing dates of the crops decreased weed risk, particularly for winter crops. The second factor was the crop emergence speed relative to the weed emergence flush: fast-emerging crops reduced weed risk, again particularly for winter crops. Competition ability was a minor factor. When analysing crop ranking established by the complete linear regression comprising crop management for years 1–5 (Eqn 4), the ranking changed slightly though the crop ranking was still related to the same explanatory crop characteristics (results not shown). A part of the crop effect was thus due the usual associated crop management techniques. For instance, the high-risk ranking of unsown setaside was partially due to a lack of tillage and mechanical weeding for weed control. The complete linear regression also produced additional information on the effect of perennial crops: the older a perennial crop preceding the analysed wheat crop (crop year effect of Eqn (4)), the lower the weed seed production in this wheat crop. If, for instance, the third v. second year of a perennial crop preceded the analysed wheat, weed infestation decreased by 7%.
Contribution of the various cropping system variables
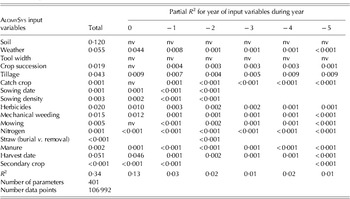
When looking at the different cropping system variables, the harvest date of the cash crop was the most important one (explaining 5·1% of variability in seed production, R 2 of 0·051 in Table 4), especially for the analysed winter wheat and for the four preceding crops. The second most important variable was tillage (during the current and at least the previous 5 years). The next three cropping system components were crop succession, herbicides and mechanical weeding, during the last 4–5 years. The contribution of the other curative technique, i.e. mowing, was much lower, possibly because it is only used in perennials which already present a low weed risk. The effect of sowing date and sowing density was slight and only significant during the analysed crop and the previous 2 years. The effect of other techniques (catch crop, secondary crop, mineral and organic fertilization) was even smaller, but visible in the longer term. Straw management was the least important component.
Variability in simulated weed seed production explained by AlomySys input variables. Partial and total R 2 of Eqn (4)

Empty cells indicate a nil contribution.
nv=input not variable (e.g. rotation during year 0). Sowing date includes the date of the last tillage which can occur up to 7 days prior to sowing.
Pedo-climatic variables, particularly soil texture, explained as much as the cropping system (partial R 2 of 0·120+0·055=0·175 v. 0·161). The width of the different agricultural tools did not present a significant effect. Unexplained variability was high (1–0·34=0·66). Adding cropping system components from years 6 to 9 to Eqn (4) only increased total R 2 from 0·34 to 0·37 (results not shown). Most of the unexplained variability was thus due to interactions between input variables. These interactions were complex because the addition of double interactions between crop type (winter crop, spring crop, setaside and perennial) and management technique (e.g. ploughed v. not ploughed, sowing date, number of herbicides, etc.) to Eqn (4) only increased R 2 by 0·01 (results not shown). Some of these interactions might be better caught by the more integrated and cumulative indicators used later in the present study.
Effect of crop management variables
Techniques interacting with field state variables
Most effects of crop management techniques (Table 3) were identical to those observed in the annual analysis presented in the companion paper (Colbach & Mézière Reference Colbach and Mézière2012). The annual analysis was often more adequate for catching effects of techniques applied to the analysed winter wheat because it took account of the seed bank present at the previous crop harvest and thus reduced the unexplained variability due to interactions between past techniques. Several other management variables presented effects in the multi-annual analysis that were opposite to those observed in the annual analysis, or effects that varied over time (i.e. different effects in past crops). These were mostly factors interacting strongly with field history (e.g. tillage tools, Table 3a), weed stage variables (e.g. weeding tools, Table 3f) and environmental variables (e.g. herbicide dates, Table 3e). Their effects varied because they were applied in different conditions. The interactions between techniques and biophysical field state variables were analysed in the companion paper (Colbach & Mézière Reference Colbach and Mézière2012) and will not be repeated here.
Techniques with long-term effects
A few effects invisible in the annual analysis presented a very large effect in the present study, because of their cumulative effects over time. This is particularly the case of the variables describing manure (Table 3h). Adding manure, during the past 4 years and prior to the current winter wheat, always increased weed seed production considerably, irrespective of its nitrogen or seed content. Increasing the amount of added seeds further increased weed risk, albeit only slightly. Tilling after manure spreading could reduce the risk of weed seed production because it stimulated fatal summer germination in the newly added seeds and buried some of them too deeply for them to emerge in the subsequent crop. Weed risk was the lowest for a type-C manure (e.g. pig and poultry slurry, poultry manure with little straw and liquid manure), which presents the highest short-term nitrogen release and the lowest long-term release. The opposite was true for type-A manure (e.g. cattle, sheep, goat and horse manure) and type-B manure (e.g. cattle slurry, pig manure, straw-rich poultry manure), which present lower short-term and higher long-term release. Short-term release seems to have most influence, increasing fatal summer germination and in-crop pre-emergent mortality of fresh seeds produced during the crop following manure spreading.
The latter process also explains the decrease in weed risk after increased nitrogen application in past crops (Table 3h). Similarly, straw burial increased weed risk because its decomposition temporarily blocks nitrogen and reduces its availability for the crop and the weeds, thus limiting fatal summer germination of fresh seeds after this crop.
Catch crops
Several techniques were not studied in the companion paper focusing on winter wheat (Colbach & Mézière Reference Colbach and Mézière2012) and were analysed extensively in the present study, with its multitude of crops. Catch crops preceding past spring crops decreased weed seed production in the current winter wheat (Table 3b) because they increased nitrogen availability in the subsequent crop (thus limiting the subsequent efficient emergence of fresh seeds produced in that crop) and because they increase competition for weeds emerging during the inter-crop period. The two catch crop species that reduced weed seed production most, ryegrass and rye, are also the two species that emerge fastest and at the lowest temperatures (Supplementary Material). Competition ability was apparently not important as the two species that present the highest competitive ability were also those increasing weed risk most (i.e. mustard and field beans, Supplementary Material). Tillage after catch crop usually increased weed risk (Table 3b) because it stimulated germination just prior to cash crop sowing. Spraying herbicide after the catch crop could decrease subsequent weed seed production because, in contrast to tillage, it destroys the catch crop and the weeds without stimulating weed seed germination. Leaf-penetrating herbicides were less efficient than root-penetrating herbicides because they did not kill un-emerged seedlings.
Secondary crops
Undersown and associated crops, even in past crops, decreased the weed risk in the last winter wheat because of increased competition for the weed in previous years (Table 3d). Delaying the sowing date of the additional crop relative to the main cash crop increased the weed risk because the additional competition arrived too late to smother early weed emergence, which is most harmful. However, no consistent ranking of the different secondary species could be established. The harvest of the secondary crop was best delayed relative to the harvest of the cash crop because then there were two harvesting operations destroying weeds, and the persisting secondary canopy kept weed seeds from reaching the soil seed bank.
Identification of pertinent synthetic variables
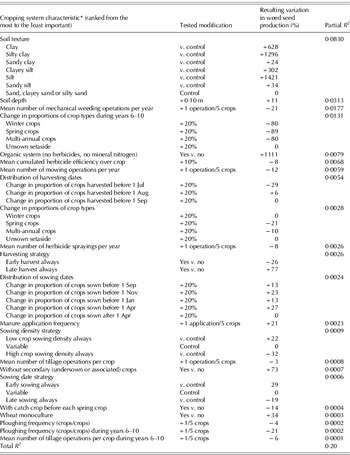
The individual analysis of the different synthetic variables (Supplementary Material) led to several conclusions: (1) variables usually presented the most significant effect when calculated over 5 or 10 years (rather than over 15 or 19 years), (2) the average effect of the variables often increased with the time span over which the variables were calculated (e.g. a decrease of 56, 70, 86 and 92% in weed infestation if systems were ploughed before each crop for 5, 10, 15 and 19 years, respectively) and (3) quantitative variables (e.g. mean number of tillage operations per crop) were more pertinent than categorical variables (e.g. systems with more than two tillage operations per crop).
Based on these preliminary results, the multi-variate regression tested, Eqn (5), consisted of soil characteristics and synthetic variables calculated over 5 years preceding the analysed wheat crop, except for crop proportions and tillage variables that were also calculated for the 6–10 previous years. These had been identified as the two cropping system components with the most important long-term effect in the analysis with the annual variables (see previous sections). When several variables were pertinent for describing a given management technique, quantitative variables were preferred to categorical variables (e.g. the mean number of tillage operations per crop v. does the system present more than two tillage operations per crop). The final model consisting solely of variables significant at P<0·05 comprised 22 variables and explained 0·20 of variability in weed seed production in the current winter wheat (Table 5). Thus, 0·14 of explained variability was lost when aggregating the most important annual cropping system variables into synthetic cropping system indicators. However, the ranking ability of the simplified as evaluated by a Pearson correlation between analysed and predicted infestations was still acceptable, with R 2=0·41, particularly when considering that the number of explanative variables was reduced from 232 to 22.
Most pertinent synthetic cropping system variables for discriminating situations according to weed infestation identified with Eqn (5) (see Supplementary Material for complete predictive model)

* All cropping system variables were calculated for the current winter wheat and the 5 preceding years, unless otherwise stated.
Table 5 ranks variables from most to least important and shows that soil texture and depth are the first two key variables to assess during field surveys. Crop-type proportions were among the most important cropping system components but these proportions were more important for the distant v. recent past. The type of cropping system, i.e. organic v. non-organic was another key piece of information. For crop management techniques, variables were more important for the recent past than for the distant past.
The synthetic analysis further increased understanding of the cropping system effects on weed dynamics, ranking different crop types as a function of the subsequent weed infestation (unsown setaside>winter crops>multi-annual crops>spring crops), identifying the crop sowing (September–October for winter crops, before April for spring and summer crops) and harvesting periods (July) resulting in the highest weed infestations.
DISCUSSION
Implications for designing grass weed management strategies
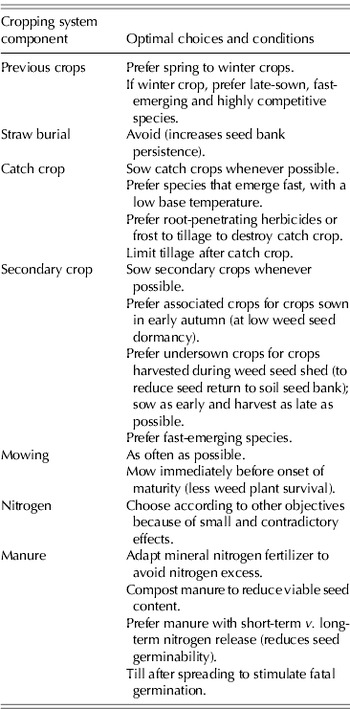
The first major result of the present study was to complement the quantitative, synthetic ranking of the crop management effects established in the companion paper (Colbach & Mézière Reference Colbach and Mézière2012) with additional techniques and long-term effects (Table 6). These are particularly interesting for small effects mostly visible in the long term, which are difficult to identify and quantify in field trials. But even for major effects such as tillage, the present study produces additional knowledge, mainly on the quantification and persistence of effects over the years. In case of ploughing, this would help to decide whether the expected weed reduction is sufficient to justify the additional cost and time of ploughing v. other tillage options and whether this expensive solution is necessary every year. However, the main contribution of the multi-annual study was the ranking of a large number of crop species for their effect on weed risk in a subsequent winter wheat and the identification of the crop traits reducing this risk, thus making possible the extrapolation to untested crop species. However, this ranking is conditional to the underlying model principles and equations, assuming weed seedling survival to depend on crop plant presence rather than its size. The duration of the crop succession and management effects (which were negligible after 5 years and strongest for the past 3 years) was consistent with the duration of 3 years observed in field surveys (Bohan et al. Reference Bohan, Powers, Champion, Haughton, Hawes, Squire, Cussans and Mertens2011). Although comparisons between the surveyed crop categories and the crop traits used here were sometimes difficult because of the very broad categories used in the survey, the major tendencies are consistent. For instance, winter v. spring crops increased weed infestations in both studies; among the surveyed spring crops, oilseed crops resulted in higher seed banks than spring cereals while in the simulation study, slow-emerging (e.g. oilseed crops) v. fast-emerging crops (e.g. cereals) increased weed infestation. Similarly, the present ranking of crop management techniques and pedo-climatic conditions (e.g. soil conditions being more important than weather variables, tillage more important than previous crop and, particularly, sowing date) was consistent with that observed when analysing weed community composition in field surveys (Fried et al. Reference Fried, Norton and Reboud2008). Again, the present study was more powerful than the field survey, having worked with a considerably larger number of situations and cropping system variables.
Summary of advice for controlling autumnal grass weeds in cropping systems

For other cropping system components, see Colbach & Mézière (Reference Colbach and Mézière2012).
The advice synthesized here and in the annual study (Colbach & Mézière Reference Colbach and Mézière2012). will be valuable to design innovative, integrated cropping systems, indicating (1) which cropping system components to modify to produce the largest effect (e.g. modify tillage strategies rather than sowing dates), (2) for how long past practices must be considered when choosing current options (e.g. an early sowing date 3 or more years earlier need not be considered in contrast to insufficient summer tillage 4 or 5 years previously) and (3) the optimal options for the different management techniques (e.g. plough if previous crop more infested than pre-previous crop (Colbach & Mézière Reference Colbach and Mézière2012). New cropping systems could be built from scratch based on this knowledge, which would already be a huge advance over completely randomized systems (Bergez et al. Reference Bergez, Colbach, Crespo, Garcia, Jeuffroy, Justes, Loyce, Munier-Jolain and Sadok2010). However, to improve acceptability by farmers and optimize to regional environmental and socio-economic constraints, these new cropping systems could evolve from existing systems, by modifying the most efficient techniques, privileging the most feasible. The authors have started working on such an approach, testing fixed-date scenarios (Colbach et al. Reference Colbach, Granger and Munier-Jolain2009, Reference Colbach, Schneider, Ballot and Vivier2010c; Mézière et al. Reference Mézière, Granger, Boissinot and Colbach2011) and now working on integrating biophysical indicators and other flexible rules.
Implications for surveys
For a survey gathering input variables for AlomySys simulations, all operations should theoretically be monitored. Thanks to the present study, the amount of data to survey can be considerably reduced, as it has been shown that surveying the current and the previous 5 years (or less for certain techniques) should produce satisfactory simulation results. The ranking of management techniques in Table 4 can be used to choose those techniques to survey in simplified questionnaires, showing that questions should focus on crop rotation and tillage rather than straw management or nitrogen fertilization. This is indeed already what most surveyors do today, but we can now justify it. However, Table 3 allows further discrimination: for instance, it does not consider the date of each tillage operation, but only the dates of the first and last operations, as well as the mean time between operations. Moreover, it identifies negligible characteristics that need not be noted at all (e.g. ploughing speed) or that can be eliminated in simplified surveys (e.g. ploughing inversion angle).
When the objective of a survey is to rank situations according to their weed infestation, questionnaires can be simplified considerably more and thus make surveying a larger number of fields possible. The list of variables shown in Table 5 can be filled out in a very short time by interviewers meeting farmers or even directly by farmers during a mailing survey, with little risk of error. This will save a considerable amount of time because extracting a complete crop management, even averaged and reduced to the main decision rules, is very time-consuming. It will also increase the number and quality of surveys; more farmers will be ready to participate and to answer each questions correctly because they will not need to search far (in notebooks, computer files, paper scraps, etc.) for the correct answers.
As in the case of management advice, the present results are conditional to the model hypotheses and quality. The critical point here would be the soil texture factor. Indeed, though the model was evaluated for different hydrothermal and cropping system conditions, this evaluation was carried out in two locations with similar soil textures (Colbach et al. Reference Colbach, Busset, Yamada, Dürr and Caneill2006a, Reference Colbach, Chauvel, Gauvrit and Munier-Jolain2007). Moreover, in the present sensitivity analysis, variations in soil texture mostly influenced soil structure and seed movements; effect on hydrothermal conditions was almost entirely neglected. It is therefore quite possible that the contribution of soil texture is actually even more important than in the present synthetic cropping system list and that the ranking of the different soil texture classes is in fact different from the one shown in Table 5. However, neglecting the soil texture effect on hydrothermal conditions in the present sensitivity analysis was voluntary. Indeed, its inclusion would have required additional, time-consuming simulations with a different model (e.g. STICS; Brisson et al. Reference Brisson, Mary, Ripoche, Jeuffroy, Ruget, Nicoullaud, Gate, Devienne-Barret, Antonioletti, Dürr, Richard, Beaudoin, Recous, Tayot, Plenet, Cellier, Machet, Meynard and Delecolle1998) to predict hydrothermal conditions from daily weather and soil texture. Since the objective of the present study was to focus on cropping system components, the number of cropping systems tested was increased instead, and only the soil texture effect that interacted most with the main component, e.g. tillage, was included.
How far are the simulation results applicable in field conditions?
Models are a simplification of reality, and thus simulation results should always be critically analysed and not to be confused with actual observations. Most of the major effects identified in the present paper are consistent with previous field observations and should therefore be robust in a large range of field conditions, despite the simulations using only weather data from a single location. For instance, frequent field reports originating from different countries confirm many of the present findings, e.g. the decrease in blackgrass or similar species in the case of mouldboard ploughing, spring crops, or delayed sowing (Schneider et al. Reference Schneider, Walter, Koch and Kemmer1984; Orson & Livingston Reference Orson and Livingston1987; McCloskey et al. Reference McCloskey, Firbank, Watkinson and Webb1996; Chauvel et al. Reference Chauvel, Guillemin, Colbach and Gasquez2001; Moss et al. Reference Moss, Perryman and Tatnell2007; Cirujeda & Taberner Reference Cirujeda and Taberner2009). Literature reports on minor factors such as nitrogen fertilizer increasing weed seed production are partial and inconsistent (e.g. blackgrass biomass decrease in pot-grown weed–wheat mixtures: Naylor Reference Naylor1972; blackgrass seed production increase in cereal crops: Chauvel Reference Chauvel1996; Chauvel et al. Reference Chauvel, Angonin, Colbach, van Ittersum, Venner and van de Geijn1996) and make it difficult to check the robustness of the present results.
The present study has a major advantage over many other simulation studies insofar as the AlomySys model was evaluated with independent field data and shown to produce satisfactory predictions, both in terms of ranking and quantification, in intensive and integrated cropping systems (Colbach et al. Reference Colbach, Busset, Yamada, Dürr and Caneill2006a, Reference Colbach, Chauvel, Gauvrit and Munier-Jolain2007). However, the model has not yet been evaluated in organic cropping systems. It is therefore possible that the important weed increase predicted here for organic systems, though consistent with existing field surveys (van Elsen Reference van Elsen2000; Hole et al. Reference Hole, Perkins, Wilson, Alexander, Grice and Evans2005), was partially overestimated, particularly as the simulated organic systems were not necessarily based on diversified rotations as is usual in actual organic systems. The evaluation data were also insufficient to check whether disregarding genetic, intra-specific variation in AlomySys could be problematic. The latter might lead to ignoring the risk of novel cropping systems selecting certain biotypes, similar to the advent of herbicide-resistance in the past (Délye et al. Reference Délye, Menchari, Guillemin, Matéjicek, Michel, Camilleri and Chauvel2007, Reference Délye, Michel, Bérard, Chauvel, Brunel, Guillemin, Dessaint and Le Corre2010; Moss et al. Reference Moss, Perryman and Tatnell2007).
The major deficiency of the present study is its mono-specific nature, only considering a single-weed species, albeit a frequent and harmful one. This is increasingly unacceptable because of an increasing diversification and shifts in weed floras due to modified cropping systems (Fried & Reboud Reference Fried and Reboud2007; Fried et al. Reference Fried, Chauvel and Reboud2009), as well as climate change and the resulting disruption in cropping practices (Rodenburg et al. Reference Rodenburg, Meinke and Johnson2011). However, the present conclusions can be extrapolated to similar species types (autumn-emerging, spring dormancy, susceptibility to stale seed bed techniques, no emergence for deeply buried seeds, seeds only surviving a few years, etc.) such as Bromus tectorum (Blackshaw Reference Blackshaw1993) or Vulpia myuros (Ball et al. Reference Ball, Frost, Fandrich, Tarasoff and Mallory-Smith2008). For instance, many studies report a decrease in weed infestation after ploughing for species with short-living seeds (e.g. Davidson Reference Davidson and Heap1990; McCloskey et al. Reference McCloskey, Firbank, Watkinson and Webb1996; Recasens et al. Reference Recasens, Planes, Bosque, Briceno and Taberner2001; Reddy Reference Reddy2003; Douglas & Peltzer Reference Douglas, Peltzer, Sindel and Johnson2004; Puricelli & Tuesca Reference Puricelli and Tuesca2005). Moreover, a similar sensitivity analysis has previously been carried out with a very different weed (i.e. the spring-emerging broad-leaved crop relative, Beta vulgaris spp. vulgaris, Tricault et al. Reference Tricault, Darmency and Colbach2009), with slightly different conclusions resulting from the difference in species characteristics. For instance, curative operations (e.g. mechanical weeding and hand-pulling) were shown to be more important than pre-emptive operations such as tillage. This difference has been related to species traits (Colbach et al. Reference Colbach, Chauvel, Darmency and Tricault2011): pre-sowing operations and life-cycle processes are crucial for autumn-emerging species with relatively short-lived seeds such as blackgrass for which the main limiting factors are fatal summer germination and delayed emergence relative to crop emergence. Conversely, post-sowing operations and processes are more important for spring-emerging species with persistent seeds; these species are usually dormant when stale seed bed techniques are feasible and must ensure reproduction once emerged as they rarely encounter favourable conditions and produce less seeds.
The results of these two contrasting studies are thus complementary and can be combined for drawing conclusions on a more general weed flora, both for management strategies and surveys. To be truly multi-specific, the present methodology needs to be adapted and used with truly multi-specific weed dynamics models (Colbach et al. Reference Colbach, Gardarin, Munier-Jolain, Bastiaans, Bohren, Christensen, Gerowitt, Hatcher, Krähmer, Kudsk, Melander, Pannacci, Rubin, Streibig, Tei, Thompson, Torresen and Vurro2010a; Gardarin et al. in press) to take account of the large diversity in weed species behaviour.
CONCLUSION
From a management perspective, the present study completed the management rules and biophysical indicators for weed management developed in the annual sensitivity analysis of the companion paper (Colbach & Mézière Reference Colbach and Mézière2012). with detailed and quantitative advice on additional management techniques and, particularly, to evaluate the long-term effect of past crops and management techniques. The combination of both studies thus determined (1) the key cropping system components to modify for integrated weed management, (2) which past practices (in terms of techniques and years) must be considered when choosing current options and (3) the optimal options for the different management techniques as a function of past operations and biophysical indicators.
The other originality of the present work has been the identification of field history variables to determine in surveys, by proposing several levels of detail and expense, ranging from complete (all AlomySys input variables) to simplified (a set of c. 20 easily answered questions), with an intermediate compromise between completeness for simulation quality and surveying feasibility.
The major drawback of the present study was its mono-specific nature, considering only a single-weed species, moreover one already frequently studied for which novel conclusion are more difficult to draw. Despite this limitation, the results are innovative, even for this rather well-known species, because of the large range of simultaneously analysed factors and interactions, the inclusion of minor factors, the long-term analysis and the quantification of effects and interactions. These are all aspects that are difficult to study in experiments which usually focus on one or two major factors. Moreover, the present results can be extrapolated to similar species (i.e. autumn-emerging with little dormancy and seeds with low persistence) and completed with similar studies (e.g. Tricault et al. Reference Tricault, Darmency and Colbach2009). However, the present methodology needs to be adapted to truly multi-specific weed dynamics models (Colbach et al. Reference Colbach, Gardarin, Munier-Jolain, Bastiaans, Bohren, Christensen, Gerowitt, Hatcher, Krähmer, Kudsk, Melander, Pannacci, Rubin, Streibig, Tei, Thompson, Torresen and Vurro2010a; Gardarin et al in press.) to design simplified survey questionnaires adapted to the diverse weed flora found in fields and the diverse concerns of agro-ecological studies aiming not only at controlling harmful weeds but also at maintaining species with functional roles in the agro-ecosystem.
SUPPLEMENTARY MATERIAL REFERENCE
Supplementary Material. Additional information and results for ‘Using a sensitivity analysis of a weed dynamics model to develop sustainable cropping systems. II. Long-term effect of past crops and management techniques on weed infestation’. Journal of Agricultural Science, Cambridge 2012; Supplementary Material (available at http://journals.cambridge.org/AGS)
The present work was financed by INRA, ANR SYSTERRA ADVHERB (ANR-08-STRA-02) and ANR OGM VIGIWEED (ANR-07-POGM-003-01).