I. INTRODUCTION
Tellurite glasses are of technological importance due to their unique properties, as reported by previous works in recent years.Reference El-Deen, Salhi and Elkholy1–Reference Tanaka, Kashima, Hirao, Soga, Mito and Nasu8 The favorable properties for a wide region of transmission (∼0.35–5 µm),Reference El-Deen, Salhi and Elkholy1,Reference Wang, Vogel and Snitzer4,Reference Massera, Haldeman, Jackson, Rivero-Baleine, Petit and Richardson6,Reference Tanaka, Kashima, Hirao, Soga, Mito and Nasu8–Reference Sekiya, Mochida, Ohtsuka and Tonokawa11 low melting temperature (∼700 °C),Reference Massera, Haldeman, Jackson, Rivero-Baleine, Petit and Richardson6,Reference Brady9–Reference El-Mallawany15 low-energy phonons when compared to silicates (∼600–850 cm−1),Reference Wang, Vogel and Snitzer4,Reference Manikandan, Ryasnyanskiy and Toulouse5,Reference Lim, Jain, Toulouse, Marjanovic, Sanghera, Miklos and Aggarwal16 large third-order susceptibility,Reference El-Deen, Salhi and Elkholy1,Reference Tanaka, Kashima, Hirao, Soga, Mito and Nasu8,Reference D'Alessio, Pietrucci and Bernasconi17,Reference Kundu, Dhankhar, Punia, Nanda and Kishore18 high linear refractive index (n ∼ 2),Reference Wang, Vogel and Snitzer4,Reference Tanaka, Kashima, Hirao, Soga, Mito and Nasu8,Reference Bürger, Kneipp, Hobert, Vogel, Kozhukharov and Neov10,Reference Kozhukharov, Marinov, Gugov, Bürger and Vogel19 high solubility for rare earth ions,Reference Wang, Vogel, Snitzer, Jackel, da Silva and Silberberg7,Reference Annapurna, Chakrabarti and Buddhudu20,Reference El-Mallawany21 and high glass stability (∼100 °C)Reference El-Deen, Salhi and Elkholy1,Reference Wang, Vogel and Snitzer4,Reference Manikandan, Ryasnyanskiy and Toulouse5 make this glass family a good candidate for optical switching devicesReference Wang, Vogel and Snitzer4–Reference Wang, Vogel, Snitzer, Jackel, da Silva and Silberberg7 and laser hosts.Reference Tatsumisago, Lee, Minami and Kowada3–Reference Manikandan, Ryasnyanskiy and Toulouse5 However, the origin of the nonlinear optical properties is currently not fully understood. Hence, a study of the structural properties is crucial to elucidate the origin of those remarkable properties.
Theoretically, the formation of various oxide glasses is characterized by an A–O–B structure, where A and B are the network formers and O is the oxygen atom.Reference Selvaraj and Rao22 The more conventional network formers are Si, Ge, B, and P.
The addition of an alkaline atom and an earth alkaline oxide species to the network oxide glass causes modifications in the structural, thermal, and optical properties of the glass. In tellurite glasses, these modifications have been associated with possible broken Te–O–Te bonds and to a three-dimensional structural change.Reference Selvaraj and Rao22,Reference Kalampounias and Boghosian23
Systems composed of Te atoms as the network formers and Li atoms as the network modifiers are reported in TeO2–Li2O binary glass systems.Reference Tanaka, Kashima, Hirao, Soga, Mito and Nasu8,Reference Lim, Jain, Toulouse, Marjanovic, Sanghera, Miklos and Aggarwal16,Reference Kalampounias and Boghosian23–Reference Tanaka, Yoko, Yamada and Kamiya28 Tanaka et al.Reference Tanaka, Yoko, Yamada and Kamiya28 reported that the addition of Li2O to TeO2 glass caused the weakening of the axial bonds of oxygen atoms with the Te atom in the Te–Oax bond of TeO4 structural units, creating nonbridging oxygen (NBO). Sekiya et al.Reference Sekiya, Mochida and Ogawa29 observed a decrease in the glass transition temperature (T g) as the Li2O content increased. The bending and breaking of Te–O–Te bonds promote the transformation of the TeO4 structure to TeO3+1 and finally to TeO3, with a decrease in T g. These structural changes give rise to an increase of NBOs in the glass structure.
In contrast, the addition of a transition metal (R) to the Te-based glass structure can break the bond Te–O–Te, acting as a network modifier. Alternatively, the transition metal may play the role of a network former, and a Te–O–R structure type is formed. This is the case of the binary system TeO2–MoO3. In this system, the coordination of Mo atoms depends upon the mol% of MoO3 in these glasses. If the glass contains less than 25 mol%, part of the MoO6 structures in the glass shares bonds with Te-coordinated polyhedral-forming Te(short)–O–Mo bonds.Reference Sekiya, Mochida and Ogawa29 With increasing concentration of MoO3 up to 40 mol%, TeO4 units transform to TeO3 units, with the consequent increase of the NBO content in the glass network. A consequent decrease in glass stability also occurs. The increase in the NBO content has also been attributed to Mo=O bonds and the coordination number of the Mo ion, which was 6 for all compositions. With concentrations higher than 40 mol%, there is a transition from Mo4+ into Mo6+ ions, resulting in a decrease in NBO content.Reference Sekiya, Mochida and Ogawa29
Previous works investigated the relationship between the NBO content and the optical properties in TeO2–ZnO glasses. These works demonstrated that the band gap energy decreases significantly with the increase in NBO concentration.Reference Gayathri Pavani, Sadhana and Chandra Mouli30,Reference Sidek, Rosmawati, Talib, Halimah and Daud31 The TeO2–V2O5–K2OReference Farahmandjou and Salehizadeh32 and TeO2–TiO2–Nd2O3–WO3 glassesReference Fares, Jlassi, Elhouichet and Férid33 presented the same relationship between the band gap and the NBO concentration.
In this work, we investigate a new ternary glass combining the network modifier oxide Li2O and the transition metal oxide MoO3 with the aim of elucidating the role of MoO3 oxide in the physical and optical properties of this glassy system. We report the influence of the NBO content on the thermal, optical, and structural properties of the (100 − x)TeO2–x(Li2O–MoO3) glassy system with x = 10, 15, 20, and 25 mol%.
II. EXPERIMENTAL PROCEDURE
The samples were prepared by the melting–quenching technique using TeO2 (Alfa Aesar 4N), Li2CO3 (LAFAN 3N), and MoO3 (Vetec 2N) as precursor reagents. The mixtures were ground in an agate mortar for 50 min and then melted in a platinum crucible at a temperature of 850 °C for 30 min in air. The melts were quenched on a preheated brass mold at a temperature 20 °C lower than T g and subsequently were submitted to annealing treatment for 4 h at this temperature inside a furnace, followed by slow cooling to room temperature. Depending on the desired technique, the samples were cut and polished accordingly. Table I presents all the nominal compositions of the samples studied.
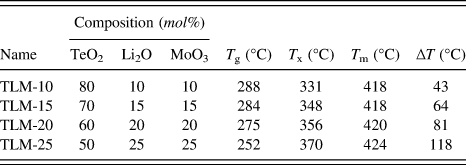
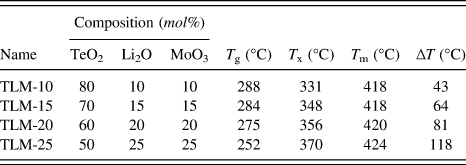
Molar composition ratios and temperatures of the ternary system (1 − x)TeO2–x(Li2O–MoO3) used in this study.
The thermal analyses were performed using a differential scanning calorimeter Setaram Instrumentation Model Labsys Evo. A heating rate of 10 °C/min in argon atmosphere (flow rate of 20 mL/min) was used for all the samples. For this technique, the samples were ground and sieved (53 µm).
Raman spectra with excitation at a wave length of 532 nm were recorded using a Senterra Brüker spectrometer with a grating of 1200 grooves/mm. The acquisition integration time was 20 s with 5 co-additions using a 20x objective and a 50 × 1000 µm slit.
Fourier transform infrared (FTIR) spectroscopy spectra were obtained by an IR-Prestige 21 Shimadzu instrument (Tokyo, Japan) in the range of 4000–400 cm−1 using 64 scans with 4 cm−1 resolution. The powdered samples were mixed with dry KBr in the 1:50 ratio by weight, and then, the pellets were prepared under a pressure of 80 kN.
Optical absorption spectra were acquired using a Varian Carry 50 spectrometer (Victoria, Australia) in the wave length range 300–700 nm. The sample thicknesses were 300 µm.
III. RESULTS AND DISCUSSION
Table I shows the T g, crystallization onset (T x), and melting (T m) temperatures for all samples. The glass stability, defined as ΔT = T x − T g,Reference Wang, Vogel and Snitzer4,Reference Udovic, Thomas, Mirgorodsky, Durand, Soulis, Masson, Merle-Méjean and Champarnaud-Mesjard34–Reference Kauzmann36 is also presented. T g decreases and T x increased with increasing Li2O–MoO3 concentration. An increase in the glass stability (ΔT) from 43 to 118 °C was also observed. This glass stability exceeds the ∆T = 75 °C obtained for the TeO2 glassy.Reference El-Mallawany2 According to the literature,Reference Tatsumisago, Lee, Minami and Kowada3,Reference Tanaka, Kashima, Hirao, Soga, Mito and Nasu8,Reference El-Mallawany15,Reference Selvaraj and Rao22–Reference Tatsumisago, Kato, Minami and Kowada25 there is a strong dependence between T g and the modifier oxide present in the glass structure. Li2O causes the breaking of Te–O bonds, distorting the network and creating voids. In this type of structure, there is a decrease in the internal energy, directly causing a decrease in T g. Meanwhile, the addition of a transition metal oxide (e.g., MoO3) also influences the symmetry of the Te–O bonds, creating multiple voids and increasing the amorphous character of the TeO2-based glass, decreasing T g and, consequently, increasing ΔT.Reference El-Mallawany2,Reference El-Mallawany15,Reference Chowdari and Gopalakrishnan37
Note that T m remains almost constant, within the mean value 420 ± 4 °C. According to the literature,Reference El-Mallawany2 on the one hand, the addition of MoO3 in TeO2-based glasses raises T m; on the other hand, Li2O addition decreases T m.Reference Idalgo, Araújo, Yukimitu, Moraes, Reynoso and Carvalho26 Therefore, the addition of Li2O and MoO3 concurrently increases glass stability due to the increase of the amorphicity of the glass network.
A. Raman results
Figure 1(a) presents the Raman spectra for all samples in the range 550–1000 cm−1. According to the literature,Reference El-Deen, Salhi and Elkholy1–Reference Manikandan, Ryasnyanskiy and Toulouse5,Reference Himei, Osaka, Nanba and Miura13,Reference Kalampounias and Boghosian23,Reference Sekiya, Mochida and Ogawa29,Reference Chowdari, Tan and Ling38,Reference Yoko, Kamiya, Tanaka, Yamada and Sakka39 six characteristics peaks corresponding to different structural units present in this glass system should be considered: 615, 665, 720, 780, 875, and 915 cm−1. To further explore these results, the spectra were deconvoluted by Gaussian fitting. The center and width of each peak were maintained fixed for the analysis of all samples. The Raman spectrum of the sample deconvoluted TLM-25 is shown in Fig. 1(a). As x increases, there is a decrease in the shoulder centered at 665 cm−1, a broadening of the 915 cm−1 band and a significant variation in the intensity of peaks in the range of 720–780 cm−1.
(a) Raman spectra of all the samples. The Gaussian fitting for the six modes centered at 615, 665, 720, 780, 875, and 980 cm−1 for the TLM-25 sample is also presented. (b) Variation of the areas of the fitted Gaussian peaks of the 665, 720, 780, and 875 cm−1 modes with increasing x; these modes are attributed to  $_TQ_4^4$,
 $_TQ_3^1$,
 $_TQ_{3 + 1}^3$, and
 $_MQ_4^2$, respectively (the solid lines are only to guide-eyes).

The notation  $_AQ_m^n$ based on Ref. Reference Gulenko, Masson, Berghout, Hamani and Thomas40 was used to distinguish between different structural units observed by Raman and Infrared spectroscopies. The index m is the total number of bridging oxygen (BO) atoms with tellurium or molybdenum atoms. The exponent n is related to the number of NBO atoms by the difference m − n = NBO. The index A denotes the atom to which the structural unit is referred, T or M for Te or Mo structural units, respectively. Table II shows the assignment of each
 $_AQ_m^n$ structural unit and the peak position.
Characteristic vibrational modes used for Raman and infrared spectra analysis with the respective units with bridging or NBO atoms.
The peak areas obtained by Gaussian fitting of the Raman spectra as a function of x (mol%) are shown in Fig. 1(b). The mode intensities related to  $_TQ_4^4$ (615 and 665 cm−1) and
 $_TQ_3^1$ units (720 cm−1) decrease with increasing x, up to x = 20 mol%. For x > 20 mol%, the amount of
 $_TQ_3^1$ increases. The increase in
 $_TQ_{3 + 1}^3$ units (780 cm−1) is observed up to x = 20 mol%, but with x = 25 mol%, there is a drastic decrease. This behavior, for x > 20 mol%, can be attributed to the influence of the change coordination number of the Mo atoms.Reference Sekiya, Mochida and Ogawa29 The transition of
 $_TQ_4^4$ to
 $_TQ_{3 + 1}^3$ units and possibly to
 $_TQ_3^2$ units is caused by the electrostatic repulsion of NBO and the double bonds of the glassy structure.Reference Sekiya, Mochida, Ohtsuka and Tonokawa24 Therefore, it is possible to form new bonds from NBO originating from Te atom structural units to Mo atom structural units.
Moreover, the intensity of the 875 cm−1 mode remains constant in the range 15 < x < 25 mol%. This behavior can be attributed to a reduction in the number of  $_MQ_4^2$ units because this decrease is necessary to accommodate the transition from
 $_MQ_4^2{ \to _M}Q_6^5$ units.Reference Sekiya, Mochida and Ogawa29,Reference Dimitriev, Dimitrov and Arnaudov49,Reference Neov, Gerasimova, Sidzhimov, Kozhukharov and Mikula55 The proportion of
 $_MQ_4^2$ and
 $_MQ_6^5$ units can be determined by the behavior of the 915 cm−1 mode that is associated with the Mo–O–Te linkages. This peak area increases slowly with the x mol% content. Therefore, in the area of the peaks associated with the structural units of Te atoms, we observed that the NBO decreased. As the band-related links of Mo increased, it was concluded that the predominant is Mo–O–Te linkage via transposition of NBO in the glassy structure.
B. Fourier transform infrared (FTIR) results
Figure 2(a) shows the FTIR spectra for all samples in the range 550–1000 cm−1. In this range, there are five vibrational modes involving the Te and Mo structures: 591, 645, 740, 871, and 916 cm−1. The assignments of these modes are presented in Table II.Reference El-Deen, Salhi and Elkholy1,Reference Bürger, Kneipp, Hobert, Vogel, Kozhukharov and Neov10,Reference Kundu, Dhankhar, Punia, Nanda and Kishore18,Reference Selvaraj and Rao22,Reference Idalgo, Araújo, Yukimitu, Moraes, Reynoso and Carvalho26,Reference Tanaka, Yoko, Yamada and Kamiya28,Reference Gayathri Pavani, Sadhana and Chandra Mouli30,Reference Chowdari, Tan and Ling38,Reference Rada, Culea and Culea47–Reference Manisha, Hirota, Tsujigami and Sakata52,Reference Sotani, Eda, Sadamatu and Takagi54 There is an increase in the peak intensities in the range 645–920 cm−1 with increasing x up to 20 mol%.
(a) Infrared absorption spectra of the glass samples (x = 10, 15, 20, and 25 mol%). (b) Evolution of the area of the fitted Gaussian peaks of the infrared Spectra of Fig. 2(a) versus x mol%. The peak centers were fixed as assigned in Table II. (c) Ratio of the peak areas at 591 cm−1 related to Te–O–Te and Mo–O–Mo bonds; the peak at 645 cm−1 is related to the structural units  $_TQ_4^4$, the peak at 871 cm−1 is related to Mo–O–Mo in relation to
 $_MQ_4^2$ units, and the peak at 916 cm−1 is related to Mo–O− and Mo=O bonds.
To further explore these results, the spectra of all samples were fitted using Gaussian peak centers at 591, 645, 740, 871, and 916 cm−1. The behavior of the fitted peak areas versus x mol% is shown in Fig. 2(b). The mode intensity at 591 cm−1, related to Te–O–Te and Mo–O–Mo bonds, remains constant up to x = 20 mol%. However, at x = 25 mol%, a slight decrease in the mode intensity is observed. This reduction in area can be related to a change in coordination of the Mo atoms. This decrease is a consequence of the formation of the Mo–O–Te bonds formed from NBO, as already interpreted from the Raman results.
The mode at 645 cm−1 indicates a small decrease in  $_TQ_4^4$ units up to x = 15 mol%. For x > 15 mol%, there is an increase in concentration of these units. At 740 cm−1, an inverse behavior is observed. The variations of these two modes can be related to the transition
 $_TQ_4^4{ \to _T}Q_{3 + 1}^4$ throughout the structure with increasing x content.
The behavior of the 871 cm−1 peak area is attributed to a pronounced increase in  $_MQ_4^2$ units with increasing x mol%, which indicates a preferential tendency of Li2O to break the linkages between
 $_TQ_4^4$ units. For x > 20 mol%, a reduction in this peak area is observed, associated with the change of coordination of Mo atoms and the consequent contribution of NBO to the formation of Mo–O–Te bonds, as already discussed above for the 591 cm−1 mode.
The mode related to NBOs in the Mo units (916 cm−1) increases with increasing x mol%. The premise of the concomitant action of Li atoms breaking the double bonds in  $_MQ_4^2$ units and changing the coordination of Mo as
 $_MQ_4^2{ \to _M}Q_6^5$ can be inferred.
Figure 2(c) shows the behavior of the peak area ratios versus x mol%. Each ratio is related as follows: A645/A591 Te–O–Te bonds to  $_TQ_4^4$ ; A871/A591 to the proportion of Mo–O–Mo bonds to
 $_MQ_4^2$ units; A645/A871 to the
 ${{_TQ_4^4} \mathord{\left{\vphantom {{_TQ_4^4} {_MQ_4^2}}} \right\kern-\nulldelimiterspace}/ {_MQ_4^2}}$ proportion units; A916/A871 to the proportion of NBO for Mo atoms structure units. The ratio of A741/A591 is related to Te–O–Te bonds from
 $_TQ_{3 + 1}^4$ units and is not shown because it behaves similar to the A645/A591 ratio.
The A645/A591 ratio has a well-pronounced increase with x for x > 20 mol%. This effect is due to the action of Li atoms in the breaking of Te–O–Te bonds in a smaller proportion of  $_TQ_4^4$ units. Because of direct inhibition, with the concomitant increase of MoO3 concentration, an effect due to the resonance energy of double bonds of both the MoO4 units as well as the MoO6 units is observed. Thus, the Li atoms may also be breaking
 $_MQ_4^2$ units, and changes of coordination can occur, which means the transition of
 $_MQ_4^2{ \to _M}Q_6^5$ units occurs by breaking a double bound between Li atoms. In contrast, for the ratio A871/A591, the proportion of Mo–O–Mo linkages relative to the
 $_MQ_4^2$ units increases with increasing content x. This increase can be attributed to the same effect of the Li atoms on the
 $_MQ_4^2$ units, as mentioned previously, by forming more Mo–O–Mo linkages and also by changing the coordination number of the Mo atoms.
For the A645/A871 ratio, the number of  $_TQ_4^4$ units is observed to decrease rapidly up to x = 20 mol% and then begins to increase slowly for x > 20 mol%. This behavior is due to the increase of more
 $_MQ_6^5$ units than
 $_TQ_3^2$ units. The attribution to this sharp decrease is the action of one Li atom in the breaking of Te–O–Te bonds affecting the
 $_TQ_4^4{ \to _T}Q_3^2$ transitionReference Tatsumisago, Lee, Minami and Kowada3 much more than the
 $_MQ_4^2{ \to _T}Q_6^5$ transition.Reference Sekiya, Mochida and Ogawa29 This bond breaking becomes less influenced by the Li atoms with x > 20 mol%.
The curve of the A916/A871 ratio that shows the formation of NBO remains practically constant and is linearly related to the  $_MQ_4^2$ units. Thus, there is the possibility that the decrease of NBOs is directly related to the units that contain Te atoms. This tendency is attributed to the change of coordination of the Mo atoms. The trend occurs via the creation of “new” links Mo–O–Te and the transpositions of NBOs caused by the Li atom in the breaking of the Te–O–Te bonds.
C. Band gap behavior
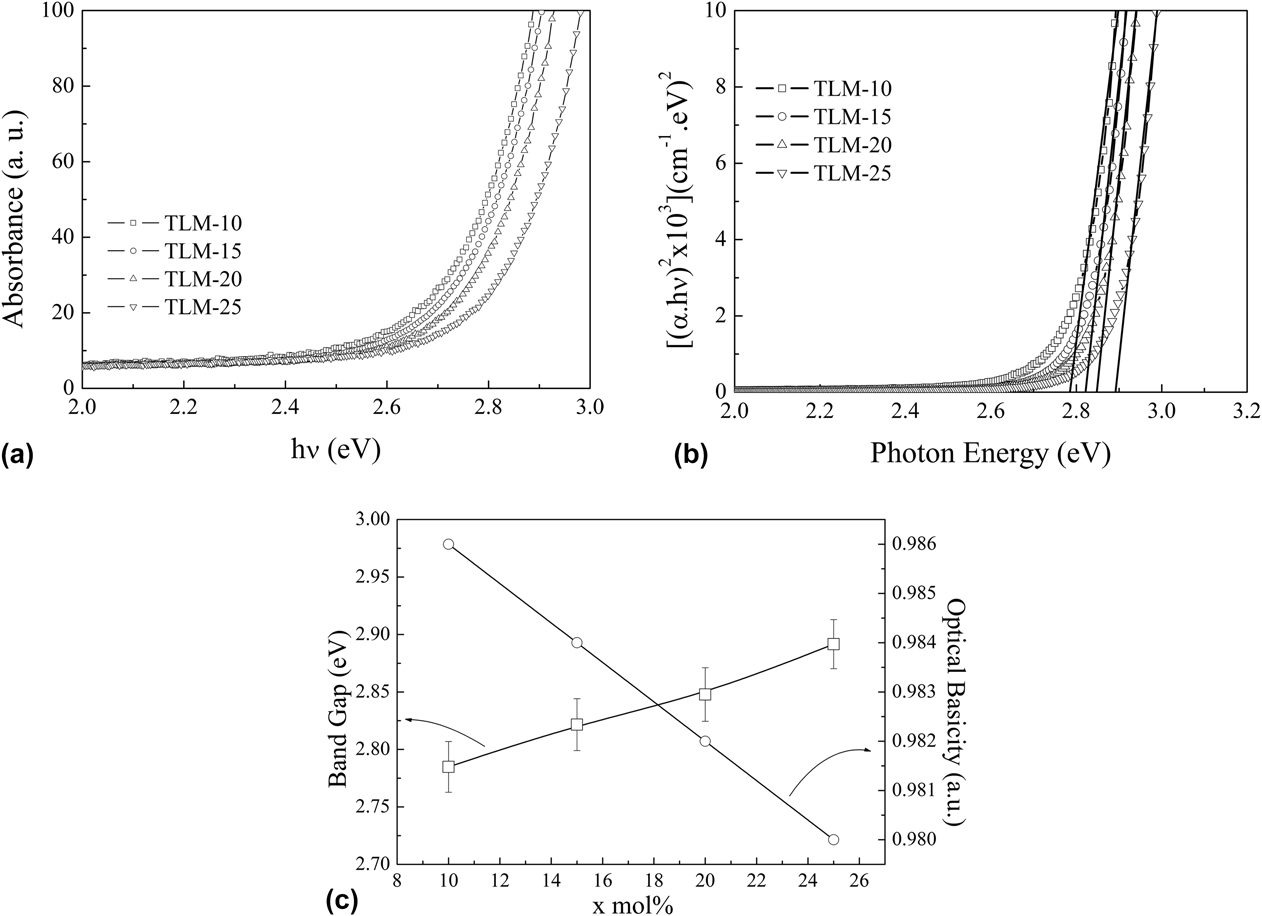
Figure 3(a) shows the absorption spectra of all the studied samples. The absorption edge shifts toward higher frequencies with increasing x mol%. The energy band gap was estimated by αhν ∝ (hν − E g)m,Reference Moraes, Nardi, Sidel, Mantovani, Yukimitu, Reynoso, Malmonge, Ghofraniha, Ruocco, Andrade and Lima27,Reference Abdel-Kader, El-Mallawany and ElKholy48,Reference Novatski, Steimacher, Medina, Bento, Baesso, Andrade, Lima, Guyot and Boulon56 where E g is the energy band gap, α is the absorption coefficient, hν is the photon energy, and m identifies the type of electronic transition involved in the absorption process: m = ½ identifies a direct allowed transition, m = 3/2 identifies a direct forbidden transition, and m = 3 an indirect forbidden transition.Reference Tauc, Grigorov and Vancu57,Reference Abu El-Fadl, Mohamad, Abd El-Moiz and Rashad58 The best fit to the data was obtained for m = ½, as shown in Fig. 3(b).
(a) Absorption spectra from TeO2–Li2O–MoO3 glass samples; (b) (αhν)2 versus photon energy; (c) calculated band gap values and optical basicity as a function of x mol%.
The band gap energies for different glasses were estimated by extrapolation of the linear portion of the curves, where (αhν)2 = 0. Figure 3(c) shows the values of E g as a function of x. The energy band gap changes from 2.75 ± 0.02 eV for TLM-10 to 2.89 ± 0.02 eV for TLM-25. These values are consistent with results presented in the literature for an energy band gap of approximately 3 eV.Reference Wang, Vogel and Snitzer4 Pavani et al.Reference Gayathri Pavani, Sadhana and Chandra Mouli30 suggested that the energy band gap shift to lower energies is related to the NBO transitions present in glasses because the NBO has electrons with lower connectivity when compared with BO. When a modifier oxide (such as Li2O) is added to the glass network, there is usually a shift to the red region (lower energy). This red shift does not occur in TeO2 - Li2O - MoO3 (TLM) glass. In this study, we observed a shift to higher energy. This variation is another indication that the concomitant addition of MoO3 + Li2O makes the glass network more polymerized with the increase in the energy band gap values. Even if Li2O breaks the Te–O–Te linkages, the resulting NBO atoms reorganized themselves, thereby changing the coordination of the Mo atoms.
D. Optical basicity
Duffy and IngramReference Duffy and Ingram59 were pioneers in the establishment of the optical basicity concept. The idea is associated with the ability of oxygen to donate a negative charge to the glass matrix. A high optical basicity means that the free O2− ions are not influenced by the closest cations. However, if the bonds between the O2− and the neighboring cations are of the covalent type, then the ability of O2− to donate charge decreases. As a result, the total optical basicity depends directly on the relative ratio between NBO and BO present in the glass structure.
The optical basicity also depends on the role of each oxide's function in the glass. The network formers are elements that interact covalently with oxygen, while the network modifiers have ionic interactions with oxygen. Consequently, the covalency of the glass becomes inversely proportional to the optical basicity.
From another point of view, optical basicity also provides information on the relationship between cations and O2− ions. An increment in optical electronegativity between atoms bound into an oxide generates an increase in the ionicity. As the valence and conduction bands in a material originate from the O2− and cation orbitals, the promotion of an electron from the valence band to the conduction band by photon absorption is similar to the transfer of electrons between ions. Consequently, the electronegativity difference involving O2− and cations is directly related to the energy band gap of the glassy matrix. A higher optical electronegativity difference indicates a lower optical basicity due to the difficulty in promoting electrons from the valence to the conduction bands. For glass, the optical basicity can be defined asReference Duffy and Ingram59–Reference Dimitrov and Sakka62:
 $${\Lambda _{{\rm{glass}}}} = {X_1}{\Lambda _1} + {X_2}{\Lambda _2} + {X_3}{\Lambda _3} + .....\quad ,$$
in which X 1, X 2, X 3 are the equivalent fraction of each oxide compound in glass, each one with its optical basicity Λ1, Λ2, Λ3. The Λ1, Λ2, Λ3 used in this work were obtained from Ref. Reference Dimitrov and Sakka62.
Figure 3(c) shows the dependence of the optical basicity on x mol%. Note that the optical basicity decreases with the x content for the TLM samples. This behavior is due to a decrease in the polarizability of the oxygen ions in the glass,Reference Higby, Ginther, Aggarwal and Friebele63 due to lower NBO concentration with increasing x. Decreasing the number of NBO atoms corresponds to a more polymerized glass. As a result, the behaviors of optical basicity and energy band gap are in agreement with the FTIR and Raman results, in which the total number of NBO atoms in the TLM glasses decreases as x increases.
IV. CONCLUSION
The results demonstrated that increasing the Li2O and MoO3 concentrations concomitantly in the TeO2–Li2O–MoO3 system leads to structural changes that directly influence the thermal, structural, and optical properties of these glasses. Li atoms play a role in breaking the Te–O–Te bonds (induced by the action of electrostatic repulsion of  $_MQ_4^2$ units), creating voids in the network, increasing the amorphous character of the glass, and finally decreasing T g in this glass system. The invariance of T m is influenced by the units related to MoO3 in increasing T m; concomitantly, the alkaline oxide (Li2O) reduces T m. Therefore, for our samples, we observed that as x increases, TLM-25 presented a higher glass stability value (118 °C) when compared to TeO2-pure glass (75 °C).
The apparent increase in NBOs for x < 20 mol% is attributed to the initially preferred share of the Li atoms in breaking bonds of Te–O–Te type. Therefore, the transition and change in the coordination number  $_TQ_4^4{ \to _T}Q_3^2$ occur more rapidly than the transition
 $_MQ_4^2{ \to _M}Q_6^5$. Above x = 20 mol%, both the Raman and FTIR spectroscopies revealed the NBO reduction in the glass network. This decrease is due to the change in coordination
 $_MQ_4^2{ \to _M}Q_6^5$ and the formation of the Mo–O–Te linkage type. This variation in coordination occurs due to the action of Li atoms concomitantly in TeO4 and MoO4 units, resulting in a transposition of these NBO atoms, rendering the total quantity of NBO atoms in the glass network to decrease with x mol% increment.
Finally, the structural changes with increasing x mol% content showed a decrease in the quantity of NBOs in the glass, leading to a decrease in the polarizability of oxygen ions, as confirmed by optical basicity analysis. This behavior indicates a more polymerized glass network, with increased band gap values for the TeO2–Li2O–MoO3 glassy system.
ACKNOWLEDGMENTS
The authors thank the Brazilian agencies CNPq, CAPES and Fundação Araucária for financial support of this work. The authors are grateful to CLABMU–UEPG and CRRQ-UEPG for their technical support.