


I. INTRODUCTION
Epitaxial thin films have been rigorously studied for decades and have had a major impact on many important technologies including semiconductor light sources, power transistors used in cell phones, solar cells, and CMOS transistors. A great number of these materials leverage the pseudomorphic, layer-by-layer growth paradigm first described by Frank and van de Merwe in 1949. There is another aspect of van de Merwe’s research regarding relaxed overgrown films that form misfit dislocations (MDs) at the film–substrate interface. This geometry allows strain relaxation in an abrupt manner and are often referred to as metamorphic or lattice-mismatched structures. Reference Richardson and Lee1 Networks of MDs at the film–substrate interface were analyzed by Frank and van de Merwe in a single-dimension to determine the conditions for dislocation generation, limits, and activation energies based on parameters determined with the aid of Lennard-Jones potentials. Reference Frank and van der Merwe2 Furthermore, the pair evaluated single monolayer on a substrate that has a large misfit strain and a crystalline alignment with the monolayer and substrate. Reference Frank and van der Merwe3 Abrupt interface metamorphic heterostructures have been demonstrated by a number of groups using a variety of metal Reference Woltersdorf4 and semiconductor Reference Johnson, Cavenett, Kerr, Kirby and Wood5–Reference Richardson, He and Kanakraju8 material combinations and a number of device demonstrations including lasers Reference Mehta, Balakrishnan, Huang, Khoshakhlagh, Jallipalli, Patel, Kutty, Dawson and Huffaker9,Reference Richardson, He, Apiratikul, Siwak and Leavitt10 and high mobility materials. Reference Edirisooriya, Mishima, Gaspe, Bottoms, Hauenstein and Santos11 van de Merwe also extended this original work to consider two-dimensional models: Reference van der Merwe12,Reference van der Merwe13 the elastic strain and misfit accommodation of finite-sized islands could result in either a positive or a negative strain depending on the island size Reference Jesser and van der Merwe14 and the low energy state of the hexagonal interfacial symmetry such as the ones studies, with interfaces between materials that both have close packed planes but differ in lattice constant. Reference Snyman and Snyman15 van der Merwe also predicted that the introduction of MDs would result in a mound-like growth. Reference van der Merwe16 The role of interfacial energies resulting from both physical strain and chemical bonding is a continuing area of study for both experimental Reference Danescu, Gobaut, Penuelas, Grenet, Favre-Nicolin, Blanc, Zhou, Renaud and Saint-Girons17 and computational research. Reference Pilania, Thijsse, Hoagland, Lazic, Valone and Liu18
This study is motivated by the goal of improving material quality of the primary superconductor in a nonlinear quantum circuit that is being pursued as a possible qubit technology for quantum information applications. Specifically, superconducting aluminum is used to implement circuit quantum electrodynamics (cQED) to form the high-quality resonator in a two-dimensional Transmon Reference Koch, Yu, Gambetta, Houck, Schuster, Majer, Blais, Devoret, Girvin and Schoelkopf19 or X-mon Reference Barends, Kelly, Megrant, Veitia, Sank, Jeffrey, White, Mutus, Fowler, Campbell, Chen, Chen, Chiaro, Dunsworth, Neill, O’Malley, Roushan, Vainsencher, Wenner, Korotkov, Cleland and Martinis20 device. The use of cQED, a circuit-based analog of atomic physics experiments, is effective as a superconducting qubit because it provides a means to couple resonant photons and quantum state excitations in an engineered fashion that can enhance qubit lifetimes and coherence times in a framework that enables quantum state manipulations. Reference Blais, Huan, Wallraff, Givin and Schoelkopf21 In this architecture, it has been effective to engineer performance improvements through the enhancement of the internal quality factor of the resonator. The internal quality factor of the two-dimensional coplanar waveguide or lumped L–C circuit resonators is directly related to the microwave losses and material quality. Reference Megrant, Neill, Barends, Chiaro, Chen, Feigl, Kelly, Lucero, Mariantoni, O’Malley, Sank, Vainsencher, Wenner, White, Yin, Zhao, Palmstrøm, Martinis and Cleland22–Reference Richardson, Siwak, Hackley, Keane, Robinson, Arey, Arslan and Palmer24 One of the primary sources of microwave losses in the resonator is a two-level system (TLS) defect, which is generally present in dielectric materials. Energy loss from TLS defects occur through resonant absorption with the microwave electric field of the qubit. Apart from the substrate, the various interfaces between the substrate, air, and the superconducting material are sensitive locations to TLS defects. Reference Gao, Daal, Vayonakis, Kumar, Zmuidzinas, Sadoulet, Mazin, Day and Leduc25,Reference Wenner, Barends, Bialczak, Chen, Kelly, Lucero, Mariantoni, Megrant, O’Malley, Sank, Vainsencher, Wang, White, Tin, Zhao, Cleland and Martinis26 Therefore, an important interface is the superconductor–substrate interface that is created during the nucleation of the aluminum thin film. Furthermore, the creation of Josephson junctions fabricated from aluminum oxide tunnel junctions that is grown on top of aluminum has critical sensitivities concerning the thickness of the tunnel barrier that may be influenced by the surface roughness of the underlying aluminum layer. Reference Zeng, Nik, Greibe, Krantz, Wilson, Delsing and Olsson27 In addition to its relevance to quantum information applications, Al on Si has continued to be a focus of research because of its simple elegance as a model system of heterogeneous nucleation and growth of metamorphic epitaxial materials that can be explored experimentally and computationally.
This article reports on an experimental study of the nucleation and growth morphology of single-crystalline aluminum thin films grown on silicon (111) wafers with two surface reconstructions. Experimental observations show that different reconstructions of silicon (111) surfaces affect the properties of thin films grown over it. Al deposition on Si(111)
 $\sqrt 3 \times \sqrt 3$
R30–Al at room temperature shows an excellent epitaxial growth of Al(111) compared to the Al/Si(111) 7 × 7 system.
Reference Horio28–Reference Lander and Morrison31
These surfaces are selected because they can be created without adding any additional elements to the system and are shown to influence the formation of growth twins, where 100-nm Al grown on the Si(111)
 $\sqrt 3 \times \sqrt 3$
R30–Al reconstructed surface has found to be twin-free, while any film on a Si(111) 7 × 7 surface is always twinned.
Reference McSkimming, Alexander, Samuels, Arey, Arslan and Richardson32
In this article, the rapid relaxation of the aluminum thin film is explored using in situ reflection high energy electron diffraction (RHEED), and the nucleation and initial growth of Al on Si(111) 7 × 7 and
 $\sqrt 3 \times \sqrt 3$
R30 reconstructed surfaces are compared using atomic force microscopy (AFM). The relaxation of the aluminum on silicon (111) is also verified using scanning transmission electron microscope (STEM).
II. GROWTH
Aluminum is grown on silicon wafers using a solid source in a V80-H solid-source molecular beam epitaxy (MBE) system under ultra-high vacuum (UHV) conditions with base pressure below 1 × 10⁻¹⁰ mbar. All samples are grown on 3-inch diameter float-zone refined n-type Si(111) wafers with a resistivity greater than 3000 Ω cm. Prior to the introduction of wafers into the UHV system, the substrate is chemically degreased with sequential rinses of acetone, methanol, and isopropyl alcohol to remove any organic contaminants. Wafers are then etched ex situ with 5% hydrofluoric acid for 1 min to remove the native surface oxide followed by a 40% ammonium fluoride (NH4F) treatment for 1 min to prepare an atomically smooth hydrogen-terminated surface. Reference Higashi, Becker, Chabal and Becker33 The wafers are heated in UHV at 150 °C for at least 30 min to desorb any moisture from the surface before loading them into the MBE growth chamber. The RHEED images of the as-loaded wafers indicate a disordered 1 × 1 Si(111) reconstruction.
To create the Si(111) 7 × 7 reconstructed surface, the 1 × 1 reconstructed surface was further heated at 775 °C for 15 min under UHV conditions. The thermal treatment desorbed hydrogen, fluorine, and residual oxide
Reference Ali and Richardson34
as indicated by RHEED images. The 7 × 7 reconstruction is stable and persists when the sample is cooled to room temperature indicating that the aluminum adatoms experience different initial surfaces. Ultra-high purity 6N-aluminum is evaporated from a standard cold-lip effusion cell at 1150 °C, which corresponds to a growth rate of 0.279 Å/s. Substrate temperature is determined by optical pyrometer but controlled through a closed-loop feedback operating on thermocouple measurements. The effective emissivity of the optical pyrometer is calibrated using the aluminum–silicon eutectic temperature.
Reference Mizutani35
During aluminum growth, the substrate is maintained at a temperature of 100 °C that is determined from extrapolating the optical pyrometer and thermocouple measurements collected on each sample. To create the Si(111)
 $\sqrt 3 \times \sqrt 3$
R30 reconstructed surface, the Si(111) 7 × 7 reconstructed surface was used as a starting point, where only one-third of the monolayer of Al was deposited at room tempreature. This partially covered surface is then annealed at 775 °C for 15 min and verified by RHEED. The
 $\sqrt 3 \times \sqrt 3$
R30 surface reconstruction occurs due to the selfassembled surface alloying of various metal adatoms with the silicon (111) surface at high temperatures.
Reference Horio28–Reference Lander and Morrison31
The
 $\sqrt 3 \times \sqrt 3$
R30 reconstruction is also stable and persists even at room temperature.
An effusion cell generates a lobe-shaped vapor cloud, whose shape depends on the crucible, melt, and chamber geometry. For off-axis chamber geometries, such as all multi-port MBE systems, the source–substrate angle affects the distribution of the evaporant that is deposited across the substrate.
Reference Ohring36
Therefore, different locations of a nonrotating substrate experience different deposition rates, and using a single deposition, those locations represent different stages of the growth. To study the nucleation and initial growth with AFM, aluminum is deposited for 12 s on nonrotating Si(111) wafers that have been prepared to express either a 7 × 7 or
 $\sqrt 3 \times \sqrt 3$
R30 reconstructed surface. The use of a nonrotating substrate is not conventional for uniform film growth; however, it is also used to facilitate visualization of the initial aluminum nucleation using in situ RHEED.
III. RHEED STUDY
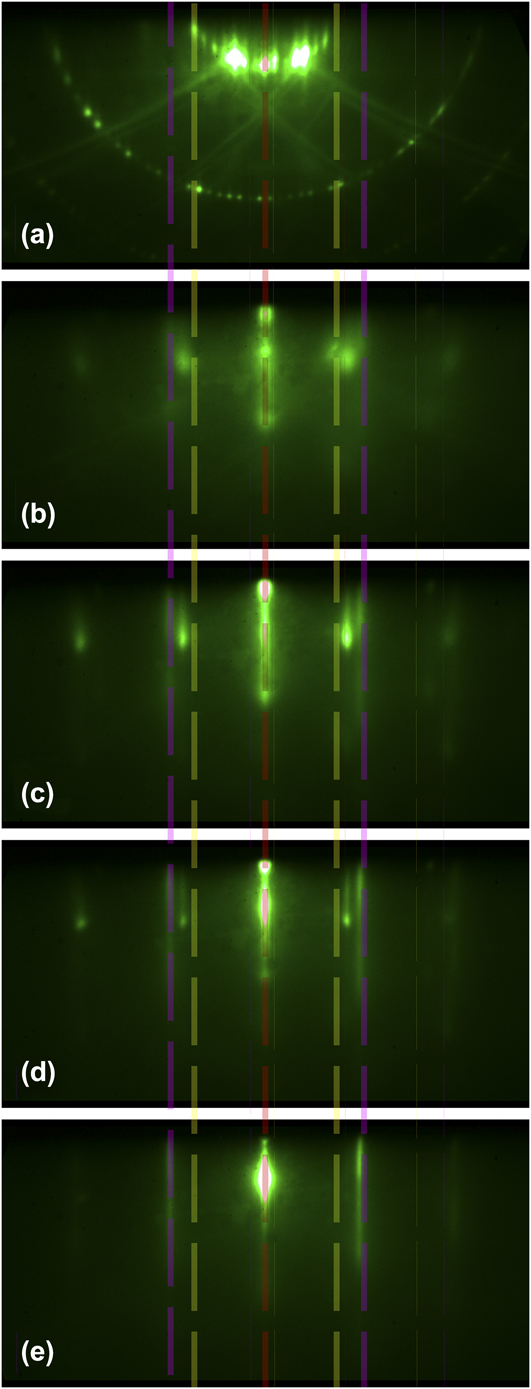
The initial growth as determined by in situ RHEED patterns collected with the electron beam parallel to
 $\left[ {1\bar 10} \right]$
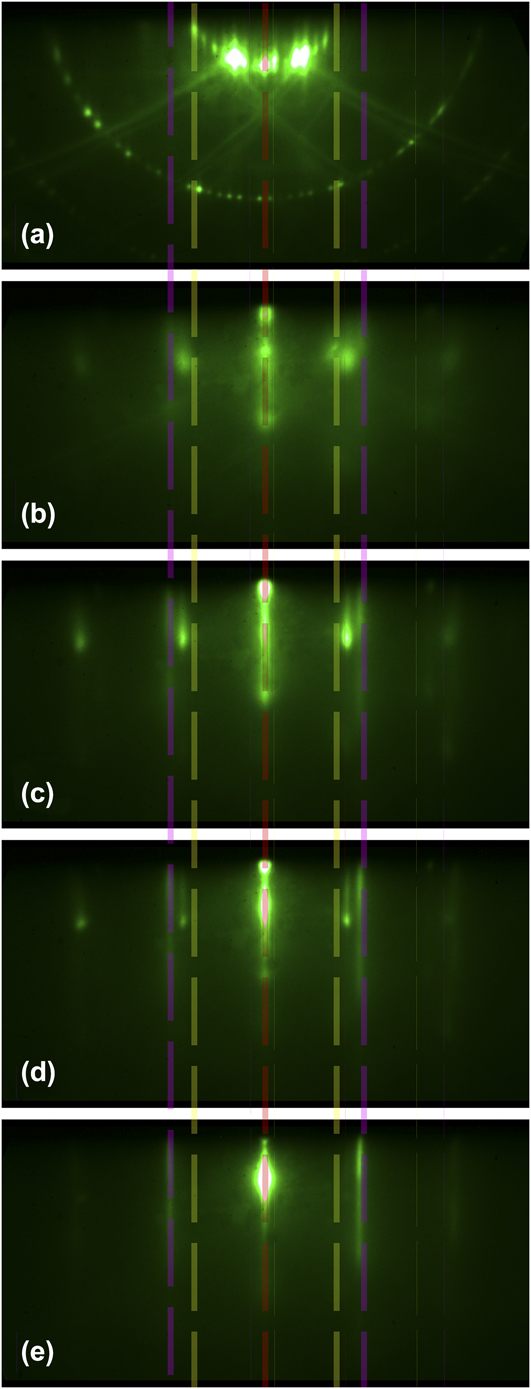
is shown in Fig. 1. The bare Si(111) 7 × 7 surface in 1(a) and films with aluminum coverage corresponding to 1 monolayer (ML) (b), 2 ML (c), 5 ML (d), and 10 ML (e) are shown in progression and determined by selecting the appropriate frames from a RHEED movie collected with a frame rate of 0.1 s on a substrate that is not rotating. The specific frames are selected to correspond to the deposited thickness using the growth rate as calibrated by thickness measurements of nominally 100-nm thick films that are grown on a rotating substrate. The specular streak is indicated by the central dashed red line through each image, while the positive and negative primary Si peaks are indicated by a yellow line and the primary Al peaks are indicated in purple. Using the in-plane nearest neighbor atomic spacing for Si,
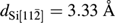 ${d_{{\rm{Si}}\left[ {11\bar 2} \right]}} = 3.33$
Å, and the green lines (and Al streaks) correspond to an aluminum in-plane atomic spacing that corresponds to a relaxed lattice of
 ${d_{{\rm{Al}}\left[ {11\bar 2} \right]}} = 2.48$
Å. The transitionary peak that appears between the Si and Al streaks corresponds to an atomic spacing of 2.86 Å, which matches the relaxed spacing of a rotated aluminum overgrown film corresponding to
 ${d_{{\rm{Al}}\left[ {1\bar 10} \right]}} = 2.87$
Å. This streak progression suggests that the overgrown aluminum initially forms as Al
 $\left[ {1\overline {10} } \right]$
‖Si
 $\left[ {11\bar 2} \right]$
and rapidly rotates to Al
 $\left[ {11\bar 2} \right]$
‖Si
 $\left[ {11\bar 2} \right]$
. The spacing in the streaks indicate that the aluminum rapdily relaxes to the unstrained lattice parameter within a few monolayers of deposition.
Frames from a RHEED movie of the nucleation and initial growth of metamorphic aluminum on the silicon (111) 7 × 7 surface corresponding to the starting surface (a) and the aluminum coverage corresponding to 1 ML (b), 2 ML (c), 5 ML (d), and 10 ML (e). The specular streak is indicated by the central dashed red line through the image stack, while the positive and negative primary Si peaks are indicated by a yellow line, while the primary Al peaks have the largest spacing as indicated by the dashed purple line.
An earlier investigation of RHEED during nucleation of Al on Si(111) 7 × 7 observed Al(001) islands are also aligned such that Al
 $\left[ {1\bar 10} \right]$
‖Si
 $\left[ {1\bar 10} \right]$
, which is consistent with the observations made here.
Reference Horio29
Studies of thicker films using high-resolution X-ray diffraction (HRXRD) ω − 2θ scan on 100 nm-thick Al films the on Si(111) 7 × 7 surface exhibited only relaxed aluminum films with Al(111)‖Si(111), and Al
 $\left[ {1\bar 10} \right]$
‖Si
 $\left[ {1\bar 10} \right]$
.
Reference Horio30
There is no evidence of any interfacial compounds observed in thicker samples from either HRXRD or cross-section STEM images observed in any samples.
IV. AFM STUDY
The samples are characterized ex situ at different locations of the angle-deposited aluminum using a Digital Instruments model D5000 AFM operating in tapping mode. Previously published results indicate that the step edges for the
 $\sqrt 3 \times \sqrt 3$
R30 are the smoothest compared to the 1 × 1 and 7 × 7 reconstructions and contained the least number of monolayer pits.
Reference McSkimming, Alexander, Samuels, Arey, Arslan and Richardson32
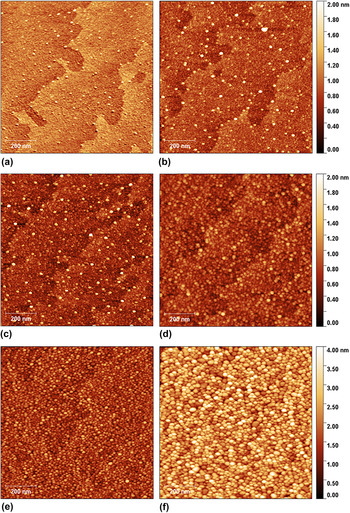
Figure 2 shows the AFM images of 1 × 1 μm areas at different locations on the Al overgrown films on the Si(111) 7 × 7 substrate. Images (a) to (f) are in increasing order of aluminum coverage on the substrate. As the precise growth duration at each point is difficult to calculate, the coverage description at each location is unknown. These images indicate a 3D isolated island-type growth. The presence of few bright spots at a very low coverage is due to the spitting from the aluminum source and residual carbon contamination,
Reference McSkimming, Alexander, Samuels, Arey, Arslan and Richardson32
both are ignored in the further analysis. As the coverage increases, the number of mounds grows uniformly, and they are fairly independent of each other across the region.
1 × 1 μm AFM images taken at six different regions on a nonrotating 7 × 7 surface-reconstructed Si(111) substrate corresponding to different stages of Al growth on it. (a)–(f) are in the increasing order of Al coverage.

A different picture emerges in Fig. 3 for similar images acquired from the Al grown on the Si(111)
 $\sqrt 3 \times \sqrt 3$
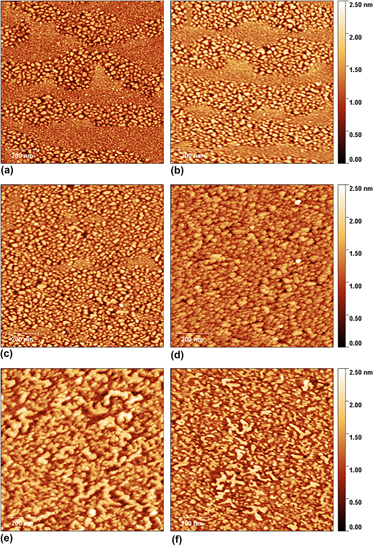
R30 substrate. Here again, images (a) to (f) are in the increasing order of the Al coverage on the substrate. These images also indicate a 3D island-type growth, but the growth progression is very different. That is, the mounds growing on the
 $\sqrt 3 \times \sqrt 3$
R30 surface preferentially grow near the Si step edges. As growth evolves, the mounds eventually cover the whole terrace starting from the lower side of each step edge. Individual mounds also showed the tendency to coalescence to form bigger mounds and mesa-like structures that are never observed during the growth on 7 × 7 reconstructed surfaces.
1 × 1 μm AFM images taken at six different regions on a nonrotating
 $\sqrt 3 \times \sqrt 3$
surface-reconstructed Si(111) substrate corresponding to different stages of Al growth on it. (a)–(f) are in the increasing order of Al coverage.

V. STEM ANALYSIS
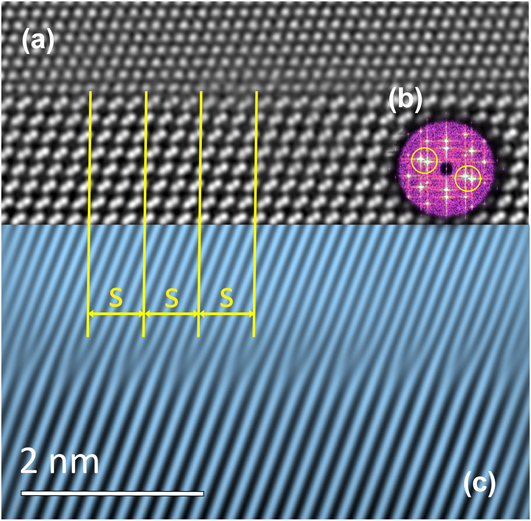
As shown in the aberration corrected STEM image in Fig. 4, growth of aluminum on silicon (111) results in a highly aligned single crystal aluminum thin film with Al(111)‖Si(111) and Al
 $\left[ {1\bar 10} \right]$
‖Si
 $\left[ {1\bar 10} \right]$
, with strain relaxation through a series of MDs at the aluminum-silicon interface. The raw image is shown in (a); the fast Fourier transform is shown in (b). The inverse transform of the image using only the (100) and
 $\left( {\bar 100} \right)$
spots, shown circled, result in the filtered image (c). The diagonal lines that are apparent in this processed image are useful visual guides that clearly show locations of the parallel MDs that have a periodic spacing for every four adjacent planes of aluminum atoms, with the measured spacing from these images is 0.9176 nm. The equilibrium structure of a thin single-crystalline epitaxial film was also analyzed by van der Merwe.
Reference van der Merwe37
The natural spatial period of MDs in the i-direction is
 $${p_i} = \left( {{{{a_i}} \mathord{\left/ {\vphantom {{{a_i}} {\left( {{b_i} - {a_i}} \right)}}} \right. \kern-\nulldelimiterspace} {\left( {{b_i} - {a_i}} \right)}} + 1} \right){a_i}\quad ,$$
where a
i
is the lattice parameter of the substrate and b
i
is that lattice parameter of the overgrown film. For this image taken down in the
 $\left[ {11\bar 2} \right]$
direction, adjacent planes of atoms are
 ${a_i} = {a_{{\rm{Si}}\left( {1\bar 10} \right)}} = 0.3087$
nm and
 ${b_i} = {b_{{\rm{Al}}\left( {1\bar 10} \right)}} = 0.2294$
nm which yield p
i
= 0.893 nm, which is in good agreement with the measurement.
Aberration corrected STEM image down the
 $\left[ {11\bar 2} \right]$
raw image (a), the fast Fourier transform (b) with the (100) and
 $\left( {\bar 100} \right)$
spots circled, and the filtered image (c) to show locations of the parallel MDs at the aluminum substrate interface.
VI. DISCUSSION
According to the thermodynamic capillarity theory of heterogeneous nucleation, the free energy change in the formation of a mound depends on its volumetric energy and the interfacial surface energy between the film and substrate, film and vapor phase, and substrate and vapor phase. For spherical cap-shaped mounds, the radius above which mounds are thermodynamically stable is termed as critical radius, which is defined as
 $${r^ * } = {{ - 2{\gamma _{{\rm{fv}}}}} \mathord{\left/ {\vphantom {{ - 2{\gamma _{{\rm{fv}}}}} {\Delta {G_{\rm{V}}}}}} \right. \kern-\nulldelimiterspace} {\Delta {G_{\rm{V}}}}}\quad ,$$
where γfv is the surface tension of the film and ΔG
V is the volumetric energy of the mound. Balancing the surface tensions on the mound leads to the Young’s equation which can be expressed in terms of the contact angle θ as γsv = γfs + γvf cos θ, where γfv is the interfacial tension between the film and vacuum, γfs is the interfacial tension between film and substrate, and γsv is the interfacial tension between the substrate and vacuum.
Reference Ohring36
The volumetric free energy of the Al mound is,
 $\Delta {G_{\rm{V}}} = \left( {\bar H\left( {T - {T_{\rm{m}}}} \right)} \right)/\left( {\bar V{T_{\rm{m}}}} \right)$
, where
 $\bar H$
is the latent heat of fusion, T
m is the melting point of aluminum, T is the temperature of mounds, and
 $\bar V$
is the molar volume. Using the standard values of these thermodynamic quantities
Reference Haynes38
and the surface energy of aluminum,
Reference Tang, Cheng, Lu and Yu39
the critical radius is approximately 2.77 nm. The number of atoms for a spherical cap-shaped mound of radius r is given by
 $${n_{{\rm{Al}}}} = {4 \over {a_{{\rm{Al}}}^3}} \times {1 \over 3}\pi {r^3}{\left( {1 - \cos \theta } \right)^2}\left( {2 + \cos \theta } \right)\quad ,$$
where a
Al is the lattice constant of Al. The contact angle for different mounds of the low coverage regions of both 7 × 7 and
 $\sqrt 3 \times \sqrt 3$
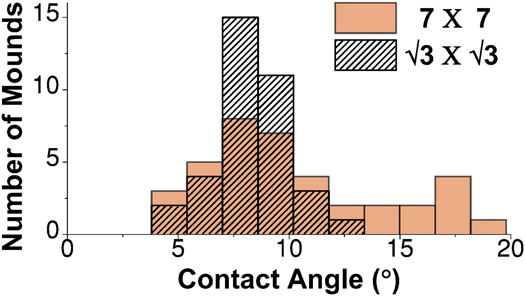
R30 is estimated from the AFM data. The distribution of these measured contact angles is shown in Fig. 5. The data indicates the contact angle varying between 4° and 20°. For this range of angles, using Eq. (3), the upper bound for the number of atoms in a spherical cap-shaped mound having a critical radius of 2.77 nm would be less than 15 atoms, which accounts for lateral size of 1.5 nm. Since the resolution size of 1 × 1 μm AFM images is 2 nm, all the mounds apparent in the image are stable mounds.
Sample distribution of the contact angle of Al islands grown on 7 × 7 and
 $\sqrt 3 \times \sqrt 3$
Si(111) reconstructed surfaces for a low coverage region.
A qualitative comparison between similar coverage of Al on 7 × 7 and
 $\sqrt 3 \times \sqrt 3$
R30 reconstructed surfaces highlights differences in the evolution of the island size. Here, similar regions from both the 7 × 7 and
 $\sqrt 3 \times \sqrt 3$
R30 surfaces are compared based on the subjective coverage and appearance of the Si step edges. Figure 6 shows the comparison for lower and higher Al coverage. Figures 6(a) and 6(d) show the regions from Al on the 7 × 7 surface-reconstructed Si(111) while (b) and (e) show data from the Al on the
 $\sqrt 3 \times \sqrt 3$
R30 reconstructed surface. (c) and (f) show the comparison of the histogram of mounds from the 7 × 7 and
 $\sqrt 3 \times \sqrt 3$
R30 surfaces. Comparison of the mean size of islands for both the higher and lower coverage, the mean mound size does not significantly change for either surface. For the 7 × 7, the mean mound area is 110.1 nm2 for the small coverage area and 97.3 nm2 for the larger coverage area, but the mean mound area for the
 $\sqrt 3 \times \sqrt 3$
R30 surface region with a lower mound coverage is 146.4 and 153.1 nm2 for the larger coverage area. The histogram of island sizes on 7 × 7 and
 $\sqrt 3 \times \sqrt 3$
R30 surfaces in Figs. 6(c) and 6(f) shows the presence of larger mounds for
 $\sqrt 3 \times \sqrt 3$
R30 and suggests greater coalescence of mounds on the
 $\sqrt 3 \times \sqrt 3$
R30 surface than those on the 7 × 7 surface, resulting in bigger mounds.
Comparison of the sizes of aluminum mounds grown on 7 × 7 and
 $\sqrt 3 \times \sqrt 3$
surface-reconstructed Si(111) for two different coverages. The regions for comparison are selected subjectively based on the coverage and Si step edges. (a) and (b) are the AFM images corresponding to the region of low Al coverage on Si(111) 7 × 7 and
 $\sqrt 3 \times \sqrt 3$
surfaces, while (d) and (e) are corresponding AFM images for higher Al coverage. (c) shows the comparison of the histogram of the normalized number of mound sizes for lower Al coverage on both surfaces, while (f) shows the comparison for higher Al coverage.

The atomic description of the reconstruction crystal surfaces helps suggest a physical mechanism for the observed differences. Compared to the unreconstructed surface, the Si(111) 7 × 7 surface forms a parallelogram that is 7 × 7 atoms per side. This Dimer–Adatom–Stacking–Fault (DAS) model consists of three layers and reduces the number of dangling bonds from 49 to 19 in each unit cell. Reference Takayanagi, Tanishiro, Takahashi and Takahashi40 Scanning tunneling microscopy indicates that monolayer depositions of Al on Si(111) 7 × 7 reveal that adatoms tend to preferentially nucleate at specific rest atom sites, leading to the clustering of Al atoms even at the monolayer of deposition. Reference Uemura, Ohkita, Inaba, Hasegawa and Nakashima41
Alternatively, the Si(111)
 $\sqrt 3 \times \sqrt 3$
R30 surface reconstruction is formed by the chemisorption of the submonolayer coverage of a group-III (B, Al, Ga, In) metal onto a Si(111) surface. A 1/3 ML coverage of trivalent group-III atoms terminates the three surface dangling atoms of Si(111) and leads to a 30° rotation of the over layer structure with respect to the unreconstructed Si(111) surface with only the adatom and first silicon monolayer participating in the reconstruction.
Reference Horio28,Reference Wang, Radny and Smith42–Reference Hoshino, Okano, Enomoto, Hata and Tsuda45
Previous studies on the initial growth of Al deposited onto Si(111)
 $\sqrt 3 \times \sqrt 3$
R30 suggest that the additional adatoms fill the remaining 2/3 of the silicon T4 sites. This surface evolution yields a relatively smoother transient structure that leads to an atomically smoother and more homogenously terminated surface that may enhance the surface diffusion of the subsequently deposited Al.
Reference Uemura, Ohkita, Inaba, Hasegawa and Nakashima41
The preferential nucleation at a small number of sites and the various bonding arrangements of the participating three near surface layers in the 7 × 7 surface may frustrate surface diffusion with a higher activation energy of diffusion compared to the metal alloyed Si(111)
 $\sqrt 3 \times \sqrt 3$
R30 reconstructed surfaces.
Reference Takayanagi, Tanishiro, Takahashi and Takahashi40,Reference Hoshino, Okano, Enomoto, Hata and Tsuda45
Presence of atoms near the step edges suggests the ease of diffusion of Al atoms on a
 $\sqrt 3 \times \sqrt 3$
R30 surface even at the deposition temperature of 100 °C. The homogeneous mound distribution of the 7 × 7 reconstructed surface is consistent with adatoms that move comparatively shorter distances after finding a nucleation site.
VII. CONCLUSION
The STEM and RHEED studies of aluminum grown on Si(111) 7 × 7 and
 $\sqrt 3 \times \sqrt 3$
R30 reconstructed surfaces show an overgrown film that is abrupt and relaxes within the first few monolayers of growth. The AFM studies indicate a 3-D island-type growth for both surface reconstructions. However, the mound evolution is distinct for these two surfaces with respect to their distribution on the Si surfaces with respect to step edges. These studies show that few monolayer thick films of aluminum on silicon are not monoatomically smooth, and applications that require a monoatomically smooth aluminum surface such as tunnel barrier devices will be limited by surface roughness.
ACKNOWLEDGMENTS
The electron microscopy was conducted at the Pacific Northwest National Laboratory (PNNL). PNNL is operated by Battelle for the US Department of Energy under contract DE-AC05-76RL01830.