INTRODUCTION
It has long been noted that young children's production of comparable phonological structure can vary from one word to another (Berg, Reference Berg1995; Ferguson & Farwell, Reference Ferguson and Farwell1975; Menn & Matthei, Reference Menn, Matthei, Ferguson, Menn and Stoel-Gammon1992; Sosa & Stoel-Gammon, Reference Sosa and Stoel-Gammon2006). For example, the production of an initial [b] by a child before 2 ; 0 may differ not only within words but also across words (e.g. ball [b], bye-bye [b∼ph], baby [b∼β], book [b∼Ø]) (Ferguson & Farwell, Reference Ferguson and Farwell1975). In some cases the variability is conditioned by a phonological context (e.g. the production of initial [b] may be influenced by the subsequent vowel or other sounds contained within the same word). But there are many cases where the variability appears to be largely lexical (Berg, Reference Berg1995). Inter-word variability is also observed in the timing at which the production of target sound patterns is mastered. New sound patterns are often seen to emerge first in a subset of words in the child's lexicon and then to spread to other words (Berg, Reference Berg1995; Macken, Reference Macken, Ferguson, Menn and Stoel-Gammon1992; Johnson, Lewis & Hogan, Reference Johnson, Lewis and Hogan1997). For example, in Berg's (Reference Berg1995) longitudinal analysis of velar stops produced by his German-speaking daughter (3 ; 4–4 ; 3), [g] in gut (‘good’) was produced reliably as [g] from the second month of the observation. In contrast, the production of target [g] in ganz (‘quite’) fluctuated between [g] and [d] for several months. A German–English bilingual child studied by Ferguson and Farwell (Reference Ferguson and Farwell1975) mastered the production of [l] in the word alle (‘all’) at 1 ; 7, and maintained targetlike production of the sound thereafter in that word. Meanwhile, [l] in words such as hello, lie, Loch (‘hole’), Löscher (‘extinguisher’) was produced variably as [l] and [j] even after 1 ; 10. To use a term borrowed from historical phonology, sound changes observed in children's word production are ‘lexically diffused’, or gradual with respect to the words that contain the relevant phonological environment (Gierut, Reference Gierut2001; Hsieh, Reference Hsieh1972; Phillips, Reference Phillips2006).
Lexical diffusion in the development of sound production has important implications for the role of the lexicon in phonological acquisition. If changes toward adultlike forms do not always occur across-the-board in words containing the same phonological contexts, the development of sound production might be contingent on the words that children learn. Depending on the extent to which this is true, the basic units of acquisition in the early stages of production development may be better construed as the individual lexical items (Ferguson & Farwell, Reference Ferguson and Farwell1975) rather than phonological elements such as features, segments and syllables, which have been assumed in most generative analyses of early word production (e.g. Jakobson, Reference Jakobson1941; Smith, Reference Smith1973).
One way to gain better understanding of the exact role individual words play in phonological development is to identify the parameters that are systematically related to the lexical gradualness in the development of sound production. Why are some sound patterns acquired in certain words first? What special status do these words have in comparison to those that lag behind in sound production? At least three factors have been proposed in the literature: (1) the frequency of words; (2) the number of phonologically similar words in the lexicon (neighborhood density); and (3) the age of acquisition of words (Garlock, Walley & Metsala, Reference Garlock, Walley and Metsala2001; Gierut, Reference Gierut2001; Sosa & Stoel-Gammon, in press; Stoel-Gammon, Reference Stoel-Gammon2011). The focus of this study is the first of these: lexical frequency. More specifically, we address the role of input lexical frequency, or the frequencies at which different words are heard in the child's linguistic environment, which we distinguish from production frequency, or the frequency at which children produce the individual words they know.
There are reasons to believe that sound patterns are acquired first in words with high input frequencies. First, frequently heard words are more likely to have targetlike phonological representations than infrequent words. Perception studies with infants and children suggest that the phonological encoding of early words becomes sufficiently specified only after a certain amount of exposure (Metsala, Reference Metsala1997; Schwartz & Terrell, Reference Schwartz and Terrell1983; Swingley, Reference Swingley2007). This may be because segment-based lexical representations emerge gradually with increased experience with the sound patterns of words (Metsala, Reference Metsala1997; Metsala & Walley, Reference Metsala, Walley, Metsala and Ehri1998). Alternatively, words with limited familiarity may have some segments whose feature values remain unspecified, or have too few tokens to construct exemplar-based representations with tight probability distributions. Although currently available empirical evidence does not differentiate these accounts, it clearly shows that children's phonological encoding of new words improves with repeated exposure (Schwartz & Terrell, Reference Schwartz and Terrell1983; Swingley, Reference Swingley2007). For example, in Swingley's (Reference Swingley2007) experiment, children aged 1 ; 2 to 1 ; 6 exposed to novel words were not capable of distinguishing them from words that differ only by one segment when they had heard the novel words eight times. After twenty-two repetitions, however, they could discriminate such minimal pairs. Second, frequently heard words may be more reliably accessed in production. Research with adult speakers has shown that frequent words are produced not only faster, but also more accurately than infrequent words (Dell, Reference Dell1990; Forster & Chambers, Reference Forster and Chambers1973; Stemberger, Reference Stemberger1984). One possibility is that such a production effect is due to the better lexical retrieval that frequent words enjoy over infrequent words (Jescheniak & Levelt, Reference Jescheniak and Levelt1994; although see Balota & Chumbley, 1995, for a potential contribution of articulatory programming). If this interpretation is correct, then children are also likely to show a frequency–accuracy relationship in their word production.
Previous research on the role of lexical frequency in phonological production
Surprisingly, however, the available evidence for the relationship between lexical input frequency and the acquisition timing or accuracy of phonological production is quite inconclusive. A few studies have addressed this issue in children older than five, but without reaching a consensus. In an elicited production task, Leonard and Ritterman (Reference Leonard and Ritterman1971) found that the seven-year-olds' production of /s/ in word-initial and word-final clusters was more accurate in high-frequency words (e.g. sleep) than in low-frequency words (e.g. sleek), where frequency estimates were based on the Kucera and Francis (Reference Kucera and Francis1967) corpus of adult English. But a study using the same method and materials failed to replicate this result (Moore, Burke & Adams, Reference Moore, Burke and Adams1976). Similarly, Garlock et al. (Reference Garlock, Walley and Metsala2001) found no effect of lexical frequency in their elicited production from five-year-olds and seven-year-olds, when age of acquisition of words and neighborhood density were controlled for.
Approaching the question from a different angle, Gierut and her colleagues examined training effects in phonologically delayed children (3 ; 0 to 7 ; 4), and showed that, in most cases, there was better improvement in the production of untrained words after treatment in high-frequency words than in low-frequency words (Gierut, Morrisette & Champion, Reference Gierut, Morrisette and Champion1999; Gierut & Storkel, Reference Gierut and Storkel2002; Morrisette & Gierut, Reference Morrisette and Gierut2002). They interpreted these results to mean that phonological generalization can be facilitated by lexical frequency. Developmental changes beginning in frequent words are therefore seen to follow the more natural pattern of lexical gradualness in phonological development. However, they also noted that it was low-frequency words that showed the most amount of change due to the training, suggesting that lexical frequency has different effects in words that initiate phonological generalizations and words that receive the generalizations (Gierut & Dale, Reference Gierut and Dale2007).
To our knowledge, the only studies that specifically examined this question in typically developing children before the age of 3 ; 0 are Ota (Reference Ota2006) and Sosa and Stoel-Gammon (in press; a publication version of Sosa's 2008 dissertation). Ota (Reference Ota2006) analyzed the spontaneous speech of three Japanese-speaking children between 1 ; 5 and 2 ; 1. For some age periods, a significant negative correlation was found between the proportion of syllable omission and the lexical frequency in the maternal speech of the children. The implication is that frequently heard words are generally produced more accurately than infrequent words with a comparable prosodic structure. Despite this, input lexical frequency was not related to the proportion of syllable omission in words with some word prosodic structures (e.g. disyllabic words with two light syllables). If there is any effect of input lexical frequency in young children's production, then, it appears to be dependent on the type of sound pattern to be acquired.
The study by Sosa and Stoel-Gammon (in press) was based on the word productions of eight English-speaking children at 2 ; 0, and seven children at 2 ; 5. The data consisted of 323 word tokens (from 32 different target word types) elicited from the children. No correlation was found between production accuracy and lexical input frequency, where accuracy was calculated as the proportion of targetlike consonants adjusted for the overall number of segments in the word, and frequency measures were taken from the Kucera and Francis corpus. However, there was a negative correlation between lexical frequency and intra-word variability in the children's production, indicating that the production of high-frequency words, though not more targetlike, is more stable. Sosa and Stoel-Gammon (in press) attributed this finding to increased motor practice in frequent words (i.e. words with high production, rather than input, frequency), which makes their production more stable but not necessarily more accurate.
It is difficult to interpret these disparate outcomes given the small number of relevant studies which also differ in various methodological aspects, including the children's age, population (typically developing vs. phonologically delayed), the sounds or sound structures analyzed, data collection method, and frequency estimates used (adult corpora vs. maternal speech addressed to the child). One thing that is evident, however, is that there are several methodological challenges involved in examining the effects of lexical input frequency on the lexical variability in phonological development, especially in young children before the age of three years.
A major source of complication is the inter-relatedness of input frequency and other lexical factors. Frequently heard words tend to be those that are acquired earlier (Goodman, Dale & Li, Reference Goodman, Dale and Li2008; Storkel, Reference Storkel2004). Thus, a positive effect of input frequency may simply be due to the age of acquisition of words; that is, words that have been in the child's lexicon longer tend to be produced more accurately (as demonstrated by Garlock et al., Reference Garlock, Walley and Metsala2001, for school-aged children). Frequently heard words are also likely to be produced more frequently by the child. There is therefore the possibility that the real source of a frequency effect is how often the child attempts to produce the lexical item, which adds to the child's experience in articulating the word and matching the proprioception of production with the perceived word form (Vihman & DePaolis, Reference Vihman, DePaolis, Knight, Hurford and Studdert Kennedy2000). In a relevant study by Tyler and Edwards (Reference Tyler and Edwards1993), the voice onset time of voiceless stops in two children (1 ; 9–2 ; 1 and 1 ; 10–2 ; 5) was seen to approximate the adult values first in frequently produced words (input frequency was not included in their analysis). This relationship between input and output frequency also has a methodological implication for analyses using spontaneous speech data. Words that are produced frequently by the child are more likely to be sampled in corpus data. Therefore, even when a sound pattern is acquired around the same time in frequent words and infrequent words, we tend to observe instances of accurate production earlier in frequent words. Studies looking at first occurrences of targetlike production can be particularly subject to such sampling biases (Rowland, Fletcher & Freudenthal, Reference Rowland, Fletcher, Freudenthal and Behrens2008; Tomasello & Stahl, Reference Tomasello and Stahl2004). Another known confounding factor with lexical frequency is word length. In running speech, frequent words tend to be shorter (Zipf, Reference Zipf1935), and therefore may be inherently easier for children to produce. Finally, lexical frequency is connected to neighborhood density, or the number of phonologically similar lexical items in the lexicon. High-frequency words tend to have more neighbors than do low-frequency words (Landauer & Streeter, Reference Landauer and Streeter1973), and children repeat words in dense neighborhoods less accurately than those in sparse neighborhoods (Garlock et al., Reference Garlock, Walley and Metsala2001). Frequency and neighborhood density also interact in the context of lexical acquisition. Although children tend to learn words in dense neighborhoods earlier than those in sparse neighborhoods, the effect is less pronounced for high-frequency words (Storkel, Reference Storkel2004). Children's word recognition is faster in sparse neighborhoods than in dense neighborhoods when the words are of high frequency, but the opposite is the case for low-frequency words (Metsala, Reference Metsala1997). These findings indicate that the number of phonologically similar words needs to be controlled in order to determine whether the effects of lexical frequency are independent of neighborhood density. Although word length was taken into consideration in Ota's (Reference Ota2006) analysis of syllable omission in child Japanese, none of the other factors mentioned here were controlled for, leaving the possibility that the reported lexical input frequency effect was actually a reflection of the age of acquisition of words, number of neighbors, or the frequency of production rather than that of input.
Another source of methodological challenge is the size and individual variability of young children's lexicon and lexical environment. The small lexicon size of children before the age of three means that the potentially covarying factors discussed above cannot be fully manipulated in experimental studies, as it is extremely difficult to come up with enough words that orthogonally differ in input frequency, production frequency, age of lexical acquisition, word length and neighborhood density. Experimental manipulations are further constrained by the individual variability in the early lexicon, which limits the number of words that can be commonly tested across children. Individual differences in lexical frequency also tend to be more substantial for young children than for older children or adults, and such variance has a direct impact on children's vocabulary development, such as the acquisition order of individual words (Huttenlocher, Haight, Bryk, Seltzer & Lyons, Reference Huttenlocher, Haight, Bryk, Seltzer and Lyons1991). The implication of this is that frequency estimates based on adult corpora, such as that of Kucera and Francis (Reference Kucera and Francis1967), not only fail to accurately capture the general distribution of words directed to young children (Goodman et al., Reference Goodman, Dale and Li2008), but also underestimate the relationship between input frequency and the lexical order of early sound development.
One way to address these problems is to use longitudinal data of spontaneous production in individual children with frequency estimates based on speech directed to each child, and control for the extraneous factors rather than experimentally manipulate them. However, corpus data encounters problems stemming from sampling variability. The number and regularity of productions that can be found in the data for a given word can vary, sometimes leaving large gaps in the data. Suppose, for instance, we are interested in establishing the age at which a child learns the production of the consonant cluster /dr/ in the word dragon. In a corpus that covers the age range 1 ; 4–3 ; 0, we may find non-adultlike productions of dragon between 1 ; 8 and 2 ; 4. But if we find no examples of the word after 2 ; 4, we have no way of knowing when exactly the cluster may have been acquired in that word.
In sum, although it is thought that input frequency of words is a major factor in predicting lexical variability in phonological production, there is to date no conclusive empirical evidence to support this hypothesis. In particular, there is a paucity of studies investigating whether accurate production of sound patterns is achieved first in frequently heard words during the initial years of word production. In addition, previous research suffers from several methodological problems that might have led to inconsistent results.
Purpose of the current study
In this study we set out to directly test the question of whether the production accuracy of a particular sound pattern reaches a predetermined criterion first in frequent words in the maternal speech when potentially confounding lexical factors are controlled for. We attempted to answer this question by examining the production of word-initial consonant clusters in English (e.g. /dr/ in dragon) from the onset of word production up to 4 ; 0. Consonant clusters were chosen as the target structure because the process of mastering the production of clusters is known to be protracted, presenting a good degree of variance in the timing of acquisition within the first few years (Smit, Reference Smit1993). Consonant clusters also contain well-defined subtypes (e.g. stop+approximant, /s/+stop), which allow us to examine whether the effects of input frequency, if any, are conditioned by the specific type of phonological structure to be acquired. To this end, we also examined if the relationship between word frequency and accuracy of word-initial cluster production differs across different types of consonant clusters.
We took several measures to circumvent the methodological problems discussed above. In order to account for individual differences in lexical input frequency, we used frequency estimates based on the maternal speech of each child we studied. To minimize sampling biases, we analyzed the densest phonetically transcribed longitudinal corpus known to us (i.e. the Providence Corpus), and used accuracy level instead of first emergence to estimate the timing of phonological acquisition. Furthermore, we employed survival analysis (also known as ‘event history analysis’ or ‘hazard modeling’) to overcome the statistical problems associated with the frequent lack of critical observations in the corpus that provide information about the timing of the acquisition event (i.e. instances of production that meet the accuracy criterion). Survival analysis computes the likelihood of relevant events occurring by a particular time (referred to as their survival function) given what we know (events observed in the data) and what we do not know (CENSORED data, or events not observed during the data collection period) (Singer & Willet, Reference Singer and Willet1991). Although the technique was originally developed in actuarial science to model human lifetimes, it has been successfully applied to other areas including language development (e.g. Smolík, Reference Smolík, Burgos, Clark-Cotton and Ha2005; Tamis-LeMonda, Bornstein, Kahana-Kalman, Baumwell & Cyphers, Reference Tamis-LeMonda, Bornstein, Kahana-Kalman, Baumwell and Cyphers1998), where the research question concerns whether, and if so when, a particular event (such as the acquisition of a particular linguistic structure) occurs. We also used a method known as Cox regression (Cox, Reference Cox1972), which compares the effects of potential predictor factors on the survival functions. This allowed us to examine how the timing of cluster acquisition across different words may be affected by lexical input frequency independently of other factors. In order to ensure that the frequency effect was not an artifact of sampling bias, we compared the estimated age of cluster acquisition between words whose average frequency of production in the corpus was approximately the same.
METHOD
Data
Source
The analysis was carried out on the longitudinal spontaneous speech data of three children, Lily, Naima and Violet, in the Providence Corpus (Demuth, Culbertson & Alter, Reference Demuth, Culbertson and Alter2006) available from the CHILDES database (MacWhinney, Reference MacWhinney2000). These datasets were chosen as they met several criteria for our analysis. First, the data collection period covered the age range we were most interested in, namely the first few years of word production. Recording sessions for all three children began at the onset of first word production (1 ; 3 for Lily, 0 ; 11 for Naima and 1 ; 2 for Violet) and continued until four years. Second, the corpus was dense enough to provide us with sufficient samples of cluster production of the same words over these years. Each child was recorded for at least one hour every two weeks up to 3 ; 0 and then every month up to 4 ; 0. In addition, weekly recordings were carried out for Naima between 1 ; 3 and 2 ; 0 and for Lily between 2 ; 0 and 3 ; 0. In total, Lily had eighty sessions during the data collection period, Naima, eighty-eight sessions, and Violet fifty-four sessions. Third, the child data were fully phonetically transcribed and reliability-tested with a second coder. Fourth, the corpus included maternal speech data, which were necessary to estimate the lexical input frequency for each child.
Selection of cases
A list was compiled of all target lexical items with a word-initial consonant cluster and their phonetic realizations in the child's speech using the CLAN commands FREQ and KWAL provided by the CHILDES project. Cases marked by a ‘[?]’ in the transcription (a CHILDES convention indicating unclear targets) were deemed unreliable and discarded. Because the word from is often pronounced with a reduced cluster in adult speech (i.e. [fəm]), all instances of this word were also excluded from the analysis. In addition, when a target initial syllable that contains a cluster was omitted altogether in the production (e.g. flamingo produced as [meŋgo]), the item was not included in the analysis. Onomatopoeic expressions transcribed as words with an initial cluster (e.g. vroom) were also excluded. After these exclusions, the number of attempted productions of initial clusters was 5,209 for Lily, 7,140 for Naima, and 1,536 for Violet.
Lemmatization
For the purpose of the analysis, we aggregated some morphologically related word forms into ‘lemmas’ and considered them to have the same base phonological target. Word forms with regular inflectional suffixes were combined under the same entry, but word forms related through irregular morphology were treated separately. For example, try, tries and tried were combined into one entry, but swim and swam had separate ones. Compounds also had separate entries (e.g. grass vs. grasshopper). This data reduction was based on the assumption that word forms related through regular inflectional suffixes in English, such as try, tries and tried, were unlikely to have different phonological representations word initially. On the other hand, we took into account the likelihood that irregular and derived forms are stored separately in the mental lexicon, and that more substantive phonological differences are observed in irregular forms (which tend to have vowel differences) or compounds (which add word-length phonological material to the first element). After this procedure, the type count of lemmatized lexical items was 481 (based on 705 word forms) for Lily, 521 (755 word forms) for Naima, and 271 (368 word forms) for Violet. Hereafter, we will refer to these lemmatized lexical items simply as ‘words’.
Criterion variable: age of cluster acquisition
The criterion variable was the age when a cluster in a lexical item was ‘acquired’, which was defined as the point where the production was more than 80% targetlike within a unit of analysis (as defined below). A cluster production was considered non-targetlike if it had fewer segments than the target (e.g. [pei] for play), a vowel inserted between the consonants (e.g. [pəlei]), or a phonemically different segment (e.g. [pwei]). Otherwise, all productions were deemed targetlike. Voicing mismatch was ignored as children can have a phonetic boundary for voicing that is different from adults' (Macken & Barton, Reference Macken and Barton1980). For instance, a child production of play transcribed as [blei] was treated as targetlike.
The accuracy level was calculated for every three 30-day months counted from the date of birth. For example, if a child attempted to produce the word play 25 times between 20·01 months (601 days) and 23·00 months (690 days) and recorded 18 targetlike cases during that period, the child's accuracy level for this period would be 18/25, or 0·72 (72%). To minimize estimation errors due to small samples, accuracy scores were calculated only when there were three or more observations for a given word within that age bin. For each word, the age of cluster acquisition was operationalized as the median value of the first three-month bin whose mean accuracy level surpassed 0·8 (80%).
For words that never reached the 80% accuracy criterion during the data collection period, the age bin of the last observation was recorded as a right-CENSORED event (i.e. an event that has not been observed before the end of the data collection period). The survival analysis we carried out processed these timings differently from those of observed targetlike productions.
Predictor variables
Input frequency of words in maternal speech
Estimates of lexical input frequency were calculated from the mother's speech addressed to each child during the data collection period. Word forms in child-directed speech were lemmatized using the method described above, and log-transformed cumulative tokens were obtained for each lemma. Because some of the words produced by the children were not found in the corresponding mother's data, the log-transformation was applied to the observed frequency+1. The number of words with zero frequency in the mother's data was 27 out of 481 (5·6%) for Lily, 44 out of 521 (8·4%) for Naima, and 28 out of 271 (10·3%) for Violet.
Production frequency of words in the child's speech
To estimate how often the child produced each word, we calculated the mean number of attempts made at producing the target word each month. For instance, if the first production of the word play was recorded at 19·00 and 70 observations were made up to the 48th month, the mean number of attempts per month was 2·41 (=70/(48–19)). Log-transformed values of these estimates were used in the analysis. In our study, this factor was used mainly as a control variable to adjust for the potential effects of sampling bias.
Age of first attempt
As an indicator of when each word entered the child's lexicon, we used the age (in months) at which the first attempt at producing was found in the data. While this does not directly translate to the actual age of acquisition of words, there is a reliable degree of correlation between the timings at which children first comprehend and produce a word (Nelson, Reference Nelson1973; Tamis-LeMonda & Bornstein, Reference Tamis-LeMonda and Bornstein1990), which justifies the use of age at first production as a proxy of the actual order of lexical acquisition. As with the criterion variables, the timing was measured in 30-day months.
Neighborhood density
Following the standard operationalization (Luce & Pisoni, Reference Luce and Pisoni1998), lexical neighborhood density was defined as the number of words that differed from the target by one phoneme substitution, deletion or addition. Raw counts were obtained from the English Lexicon Project (Balota et al., Reference Balota, Yap, Cortese, Hutchison, Kessler, Loftis, Neely, Nelson, Simpson and Treiman2007) and log-transformed with one count added before the transformation.
Number of phonemes
The number of phonemes was used as a measure of the size of the target word. Diphthongs (e.g. /ai/ in fright) were treated as a single phoneme. Most of the phoneme counts were taken from the English Lexicon Project (Balota et al., Reference Balota, Yap, Cortese, Hutchison, Kessler, Loftis, Neely, Nelson, Simpson and Treiman2007). Words that could not be found in this database were hand-coded for phoneme counts.
Cluster size
Word-initial clusters in English can have either two (e.g. /st/ in stay) or three consonants (e.g. /str/ in stray). As there is the suggestion in the literature that three-consonant clusters are more difficult to acquire than two-consonant clusters (Lleó & Prinz, Reference Lleó and Prinz1996; Smit, Reference Smit1993), the size of the cluster (CC or CCC) was used as one of the predictors.
Cluster types
Clusters were further divided into several categories based on the phonotactic distribution pattern of consonants at the beginning of the word. In English, three-consonant clusters always have /s/ as the initial member, a voiceless plosive as the second member (i.e. /p, t, k/), and /w/, /j/, /r/ or /l/ as the last member. Two-consonant clusters with a nasal (/m, n/) or a voiceless plosive (/p, t, k/) as the second member always have /s/ or /ʃ/ as its first member. Otherwise, the second member of a two consonant cluster is /w/, /j/, /r/ or /l/. Based on these descriptions, we grouped the clusters into six types.
1. ‘C(C)w’: Clusters ending in /w/ (e.g. /tw/ as in twinkle, /kw/ as in quack, and /skw/ as in squash).
2. ‘C(C)j’: Clusters ending in /j/ (e.g. /bj/ as in beautiful, /mj/ as in music, and /spj/ as in spew).
3. ‘C(C)r’: Clusters ending in /r/ (e.g. /br/ as in bread, /kr/ as in cry, and /spr/ as in spring).
4. ‘C(C)l’: Clusters ending in /l/ (e.g. /bl/ as in blanket, /kl/ as in clean, and /spl/ as in splash).
5. ‘SN’: /s, ʃ/-nasal sequences (e.g. /sm/ as in small, /sn/ as in snow, and /ʃm/ as in schmutz).
6. ‘SP’: /s/-plosive sequences (e.g. /sp/ as in spill, /st/ as in star, and /sk/ as in skip).
RESULTS
Descriptive and correlational data
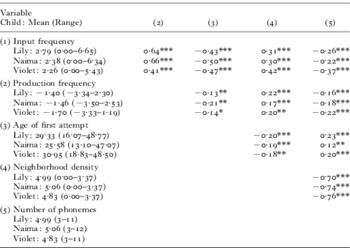
Table 1 shows the descriptive data and correlations of the continuous predictor variables. As expected, there were significant correlations among all five predictors. Most importantly, in all three children, maternal lexical frequency covaried with production frequency, age of first attempt, neighborhood density and the number of phonemes in the target word. Words frequent in maternal speech were more frequently attempted by the child, attempted first at an earlier age, found in a phonologically denser neighborhood, and shorter in structure (i.e. had fewer phonemes) than infrequent words in maternal speech.
Descriptive data and correlations among continuous predictor variables

notes: ***=p<0·001, **=p<0·01, *=p<0·05. All Ns=481 (Lily), 521 (Naima), 271 (Violet).
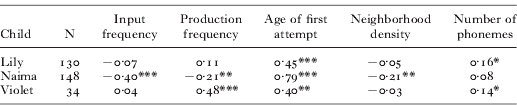
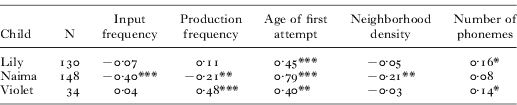
Table 2 shows the correlations between these predictor variables and the age of cluster acquisition. These figures are based only on uncensored data; that is, words for which the corpus contains at least one age bin in which the accuracy was above 80%. The only relationship consistent across all three children is the one between the age of first attempt and age of cluster acquisition. This correlation, however, may be superfluous as a word could not have reached its point of acquisition any earlier than its recorded first attempt. A significant correlation between the age of cluster acquisition and maternal lexical frequency is found in Naima's data, but, given the strong effect of age of first attempt and the correlation between age of first attempt and maternal lexical frequency, it is difficult to interpret this result.
Correlations between predictor variables and the age of cluster acquisition (uncensored data only)
note: ***=p<0·001, **=p<0·01, *=p<0·05.
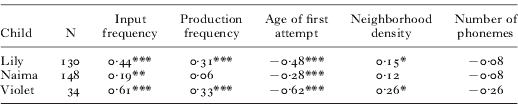
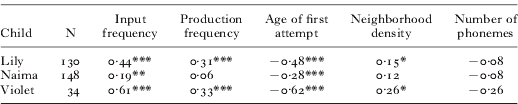
Table 3 presents correlations between the continuous predictor variables and learning time, or the time it took for a word to reach the 80% criterion from the age of first attempt. There was a robust relationship between the age of first attempt and learning time, but a negative one, indicating that the later a word enters the child's lexicon, the faster its cluster was acquired. Furthermore, all three children showed a significant correlation between input frequency and learning time. Unlike in the case of age of cluster acquisition, however, the correlation was positive; the more frequent a word was heard, the longer it took to reach the acquisition criterion. This curious result can be explained through the effect of age of lexical acquisition. Because frequent words in the input are likely to be acquired earlier than infrequent words, they tend to have an early age of first attempt. As indicated by the negative correlation between first attempt and learning time, the time required to reach the acquisition criterion for cluster production decreases with age, and therefore clusters in earlier-acquired words (which tend to be frequently heard words) on the whole take longer to be learned.
Correlations between predictor variables and learning time (uncensored data only)
note: ***=p<0·001, **=p<0·01, *=p<0·05.
These descriptive results highlight the challenges in ascertaining the effects of input frequency in phonological production with correlations between lexical frequency and acquisition events observed in spontaneous production data. Input frequency covaries with other measurements that potentially influence the timing of cluster acquisition, making it difficult to isolate its effects. The impact of input frequency may change over time as the child becomes faster at learning phonological patterns in newly learned words. In addition, an analysis based only on observed acquisition events is limited by the small proportion of data that can be used. Note that the correlations given in Tables 2 and 3 only represent the patterns found in 13% (Violet) to 28% (Naima) of the words produced by the children. For the remaining words, productions reaching the 80% accuracy criterion were not observed in the corpus, either because the production accuracy actually did not reach that level during the data collection period or because the event was not sampled in the data even though the accuracy threshold might have been reached. These issues are addressed in the survival analysis presented in the next subsection.
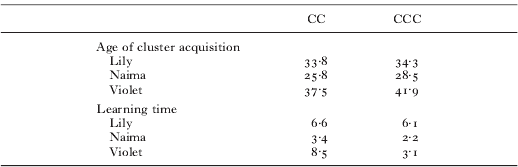
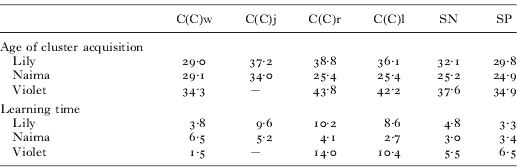
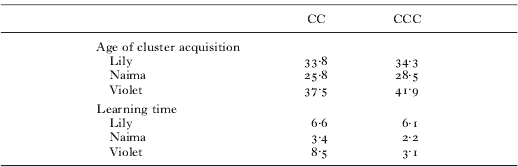
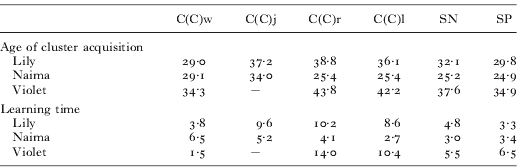
The differences in the timing and speed of cluster acquisition by cluster size and cluster type are summarized in Tables 4 and 5. Table 4 presents the mean age of acquisition and learning time of two-consonant clusters (CC) and three-consonant clusters (CCC). CCC clusters are generally acquired later, although not necessarily more slowly, than CC clusters. Table 5 presents the mean age of acquisition and learning time of different cluster types. SP clusters (as in /st/ in stay) and C(C)w clusters (as in /kw/ in quick) tended to be the earliest and fastest acquired, while C(C)r clusters were usually the latest and slowest acquired (the latter may also reflect the fact that a large portion of C(C)r clusters were CCC structures such as /str/, /spr/ and /skr/). Thus, there is an indication that the timing and speed of cluster acquisition differ systematically between words depending on the size and type of cluster that appear in the word. This also suggests that the size of impact lexical input frequency has on the learning of the cluster may differ across clusters depending on their size and type.
Mean age of cluster acquisition (months) and mean learning time (months) by cluster size (uncensored data only)
Mean age of cluster acquisition (months) and mean learning time (months) by cluster type (uncensored data only)
Survival analysis of age of cluster acquisition
We first examined the survivalfunction of the acquisition event – a time-varied curve estimating the proportion of words that have not reached the acquisition criterion – and then conducted a Cox regression to estimate the relative impact (or the hazard) of each predictor variable on the estimated proportion of words in which a cluster was acquired at each tri-monthly period.
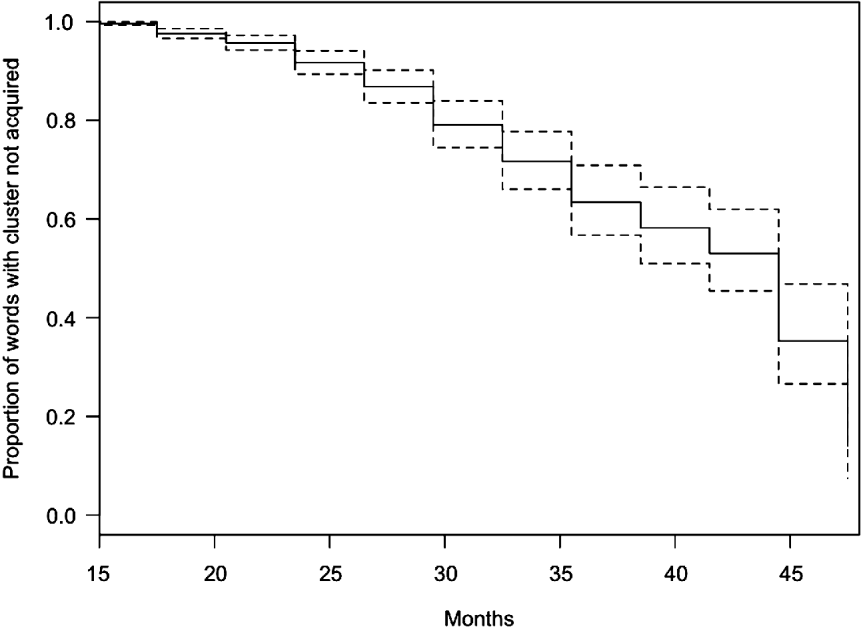
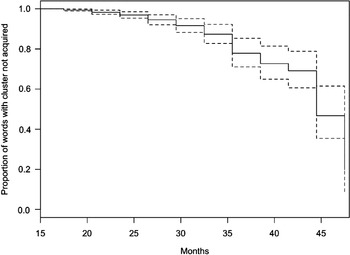
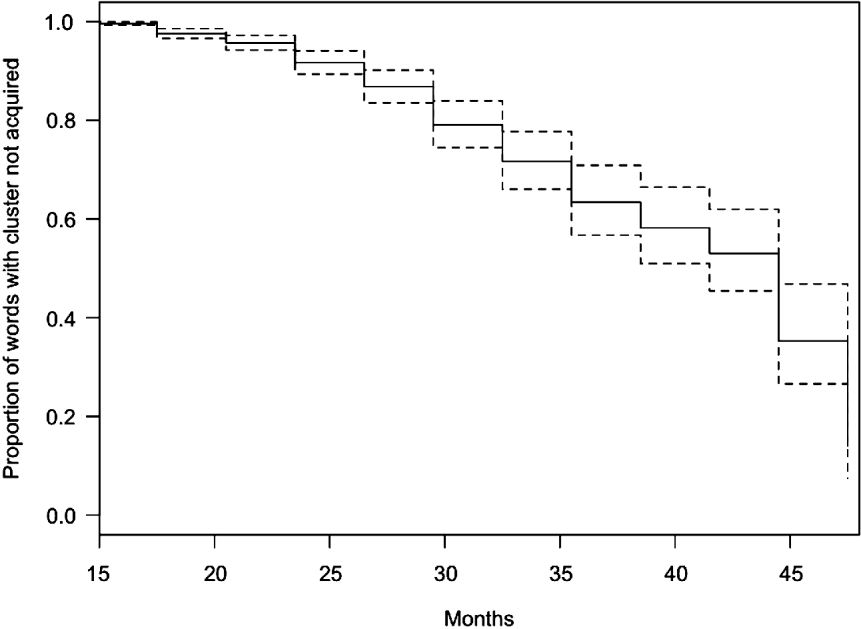
The survival functions of cluster acquisition pooled for all three children are illustrated in Figures 1 and 2. These graphs display the estimated proportion of words that have not reached the 80% accuracy criterion. All the attempted words that can be found in the corpus were grouped into two halves, words with above-median input frequency (in Figure 1) and those below-median input frequency (in Figure 2). The Kaplan−Meier method was then used to estimate what proportion of each set of words had not met the acquisition criterion. For example, Figure 1 shows that at 35–38 months, the acquisition criterion for cluster production was not reached in approximately 60% of all above-median frequency words; or to put it positively, cluster production was acquired in approximately 40% of high-frequency words. In contrast, Figure 2 shows that during the same period, the acquisition criterion was not met in nearly 80% of all below-median frequency words; so cluster production was acquired only in about 20% of all low-frequency words. From these survival curves, it appears that, given the same amount of time, accurate production of clusters is achieved in more high-frequency words than in low-frequency words.
Survival curve of cluster acquisition for words with high input frequency (above median). Dotted lines indicate a 95% confidence interval.
Survival curve of cluster acquisition for words with low input frequency (below median). Dotted lines indicate a 95% confidence interval.

In order to statistically verify this observation and to test whether the effect can be attributed to input frequency, we performed a Cox regression analysis with input frequency, age of first attempt, number of phonemes, neighborhood density, cluster size and cluster type as predictor variables. Production frequency was not used as a predictor but instead controlled for by subsetting the data into four strata based on the log-transformed monthly mean of the child's productions of each word (i.e. Stratum 1 <−2·5; −2·5⩽Stratum 2 <−1·5; −1·5 ⩽Stratum 3 <0; and 0⩽Stratum 4). Thus, separate baseline hazard functions were applied to groups of words with different production rates. Because the descriptive analysis above suggested that the effects of input frequency may change over time, the interaction between input frequency and the age of first attempt was included as a factor. However, words that appeared after 36 months were not analyzed since a higher proportion of those words (72·1%) did not have the acquisition event observed during the data collection period. In addition, as we were interested in whether input frequency effects may be conditioned by the size and type of onset clusters, we included the interaction between input frequency and cluster size, as well as the interaction between input frequency and cluster type. Data from each child were grouped into statistical clusters and treated as within-subjects observations.
The results of the Cox regression are given in Table 6. The model had an overall significant fit with the data (likelihood ratio=379, df=17, n=1082, p<0·001). The exponentiated coefficients of the main effects are interpretable as multiplicative effects on the likelihood of a cluster being acquired in that stage. For example, a significant exponentiated coefficient of 1·25 means that a unit increase in that factor raises the likelihood of cluster acquisition by 25% (i.e. a hazard ratio of 1·25). A significant exponentiated coeffecient of 0·85 means that a unit increase in that factor reduces the likelihood of cluster acquisition by a factor of 15% (a hazard ratio of 0·85). For categorical variables (i.e. cluster size and cluster type), exponentiated coefficients represent the ratio of effects with respect to the reference category. The reference category was set to CC for cluster size, and SP for cluster type, both the earliest acquired in the relevant dimension (see Tables 4 and 5).
Cox regression for the age of cluster acquisition: all words attempted by 36 months

Significant main effects were found in input frequency, neighborhood density and cluster type. The likelihood of cluster acquisition was higher by 33% for every log increase in input frequency. This supports the hypothesis that it is in frequently heard words that children start to produce new phonological patterns more accurately. The likelihood of cluster acquisition within the data collection period was also lower by 10% for every log increase in neighborhood density, indicating that accuracy of production is reached later in words with more phonological neighbors. The acquisition criterion was less likely to be met when the cluster was C(C)r or C(C)w than when it was SP, but more likely to be met when the cluster was C(C)l.
There were also significant interactions between input frequency and age of first attempt as well as between input frequency and cluster types C(C)r and C(C)l with respect to SP, such that the effects of input frequency were weaker in C(C)r and C(C)l. The interaction between input frequency and age of first attempt indicates that the effect of input frequency is slightly weaker for words that entered the productive lexicon later.
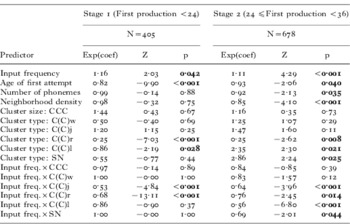
In order to examine how the input frequency effect changes depending on the timing of lexical acquisition, we split the data into two sets. The first set (‘earlier-acquired’ words) included words whose first attempts occurred before the 24th month, and the second set (‘later-acquired words’) consisted of words attempted after the 24th month (but before 36 months, because words attempted after three years were not included in the statistical analysis, as stated above). Separate Cox regressions were carried out on each dataset (Table 7).
Cox regression for the age of cluster acquisition: analyses by age of first production

Models for both sets had a significant fit with the data (earlier-acquired words: likelihood ratio=216, df=16, n=405, p<0·001; later-acquired words: likelihood ratio=166, df=16, n=677, p<0·001). For earlier-acquired words, significant main effects were found in input frequency, age of first production, and cluster type. The likelihood of cluster acquisition was higher by 16% for every log increase in input frequency. The likelihood of cluster acquisition within the data collection period was also lower by 18% for every month of delay in the first production. The acquisition criterion was less likely to be met when the cluster was C(C)r or C(C)l than when it was SP.
There were also significant interactions between input frequency and cluster types C(C)r and C(C)j with respect to SP, such that the effects of input frequency were weaker in C(C)r and C(C)j. The prediction for such interactions was that weaker frequency effects should be observed in ‘easier’ phonological patterns. Although not significant, the hazard ratio for C(C)j was indeed higher than 1. In contrast, C(C)r in words acquired during this stage was clearly late acquired and yet displayed weaker frequency effects, in diametric contradiction to the prediction.
For later-acquired words, significant main effects were found in input frequency, age of first attempt, number of phonemes, and neighborhood density. The frequency hypothesis was supported in this stage too. The likelihood of the acquisition of clusters in a word increased by 11% with every log increase in input frequency. In addition, the likelihood of cluster acquisition decreased by 7% with every monthly delay in the age of first attempt. A single phoneme increase in the length of a word resulted in an estimated 8% reduction of the likelihood of its initial cluster being acquired during the data collection period. Neighborhood density contributed negatively to cluster acquisition. The likelihood of cluster acquisition for a word decreased by 15% for every additional phonological neighbor. As in the earlier-acquired words, C(C)r clusters had a lower hazard ratio than SP, but C(C)l and SN clusters had a higher hazard ratio than SP clusters.
The interaction between input frequency and cluster types indicates that all of these clusters (i.e. C(C)r, C(C)l and SN) as well as C(C)j clusters had a weaker effect of input frequency than the reference type SP. Again, despite not reaching significance, C(C)j clusters had a hazard ratio above 1. Thus, C(C)l, SN and C(C)j followed the prediction that the effect of input frequency should be weaker in earlier-acquired sound patterns, while C(C)r once again behaved in the opposite direction.
Finally, to see if there are important individual differences across the three children, we ran the Cox regression on data from each child. All three models had a significant fit with the data (Lily: likelihood ratio=150, df=17, n=401, p<0·001; Naima: likelihood ratio=282, df=17, n=471, p<0·001; Violet: likelihood ratio=43·9, df=17, n=210, p<0·001). For Lily, the analysis revealed a main effect of input frequency (Exp(coef)=2·95, z=2·36, p=0·018), and interactions between input frequency and age of first attempt (Exp(coef)=0·97, z=−1·99, p=0·047), input frequency and C(C)l (Exp(coef)=0·59, z=−3·43, p<0·001), and input frequency and C(C)r (Exp(coef)=0·55, z=−3·24, p=0·001). For Naima, there was a significant main effect of input frequency (Exp(coef)=1·38, z=1·05, p=0·013), age of first attempt (Exp(coef)=0·92, z=−2·50, p=0·030), and C(C)r (Exp(coef)=0·25, z=−2·01, p=0·045), as well as an interaction between input frequency and C(C)r (Exp(coef)=0·57, z=−2·52, p=0·012). No other factors were significant. The significant effects are consistent with the general pattern discussed above in that input frequency raised the likelihood of cluster production acquisition in Lily and Naima. C(C)r clusters were late acquired in Naima, and also showed an attenuated impact of input frequency. Although none of the factors in Violet reached significance, the direction of the input factor (Exp(coef)=4·20, z=1·20, p=0·23) was the same as the two other children. Overall, there is no clear evidence for individual differences, and the lack of significant results in Violet's data, which was the smallest of the three, is most likely due to lack of statistical power.
DISCUSSION
The primary purpose of this study was to re-examine the hypothesis that the frequency of lexical items in the input language influences the order in which the production of sounds and sound patterns is mastered from one word to another. Another question addressed was whether the particular subtype of phonological structure to be acquired influences the degree to which input lexical frequency exerted an effect on the development of sound production. These questions were investigated longitudinally in the production of English word-initial consonant clusters between 0 ; 11 and 4 ; 0, using a survival analysis.
Results from a Cox regression analysis applied to the survival data showed maternal lexical input frequency to be a significant predictor of the age at which targetlike production of a cluster in a word is acquired. The effect was observed even when we controlled for production frequency and took into consideration other lexical properties such as the age of lexical acquisition, number of phonemes in the word, neighborhood density, the size of cluster, and the type of cluster. More specifically, other things being equal, clusters contained in frequently heard words were acquired faster than clusters in infrequently heard words. The impact of input frequency varied by the type of cluster. Overall, cluster types that were relatively impervious to input frequency tended to be those that are acquired early, with the one notable exception of C(C)r clusters. We now discuss these findings in turn.
Input frequency and lexical variability in phonological production
The main finding of this study – that new phonological patterns are mastered first in frequently heard words – is at variance with the study by Sosa and Stoel-Gammon (in press), in which no effects of input frequency were found on the accuracy of word production in children with comparable ages. There are several possible reasons for these different outcomes. First, the developmental effect of lexical frequency may be only detectable in a longitudinal analysis that spans a long period and includes a large number of lexical items. In the current study, the observational period spanned two years and the analysis was carried out on at least 270 lexical items per child, in contrast to the two cross-sectional periods (2 ; 0 and 2 ; 5) that recorded the accuracy of 32 word types in Sosa and Stoel-Gammon's study. In a small set of words, the effects of input frequency may also be suppressed by other factors unless they are carefully controlled for. For example, the contrast between our regression analysis and the descriptive data in Table 3 indicates that an input frequency effect is difficult to observe in the face of the strong age of lexical acquisition effect.
Second, in this study, estimates of lexical frequency in the input language were obtained from maternal speech, in contrast to Sosa and Stoel-Gammon's study (and several previous studies that investigated the role of lexical input frequency), which used an adult corpus. Given the relatively small size of lexicon that young children have, individual differences in the relative frequency of words in the ambient input may be too large to be estimated with a corpus of adult language.
A third important methodological difference between Sosa and Stoel-Gammon (in press) and the current study is that the acquisition criterion was much more general in the former (the overall accuracy of segmental production) than in the latter (accuracy of word-initial cluster production analyzed according to the size and type of the cluster). As our results showed, the effects of lexical input frequency can vary across target sounds and sound patterns, and may be captured only when an analysis is carried out on specific phonological structures.
It is important to note, however, that the results of the two studies are not contradictory. Words that are frequently heard in the input may become more stable (as shown in Sosa and Stoel-Gammon, in press) and also more accurate in production at a higher rate than infrequent words (as shown in the current study). A more careful examination of such a relationship between accuracy and intra-word variability of production is likely to reveal important patterns in the process by which children's word production converges on the adult target. For example, early production may first undergo rapid and rough approximation of the phonological patterns of the adult word (resulting in a noticeable reduction in intra-word variability), after which a much slower process of detailed convergence ensues.
Structural influence on the lexical frequency effect
The second major finding of this study was that the effects of input frequency on the age of acquisition in different lexical items were conditioned by the type of cluster. In the majority of cases, the clusters that showed significantly weaker input frequency effects (i.e. C(C)j in both earlier- and later-acquired words, and C(C)l, SN in later-acquired words) were also acquired earlier than the reference cluster type. This pattern is consistent with the observation made in Ota (Reference Ota2006), where the effects of lexical input frequency on syllable omission were limited to words with later-acquired prosodic structures. The interpretation in that study was that although targetlike production of a phonological structure develops gradually word by word, once the learning extends to a sufficient number of words, it generalizes almost categorically to the production of all words that contain the structure. The impact of lexical frequency is, therefore, felt more in words that have not approximated that generalization threshold.
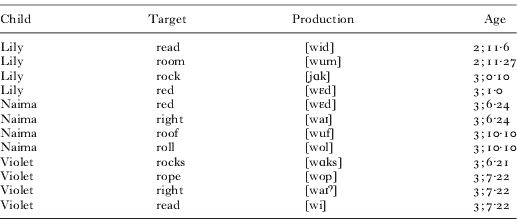
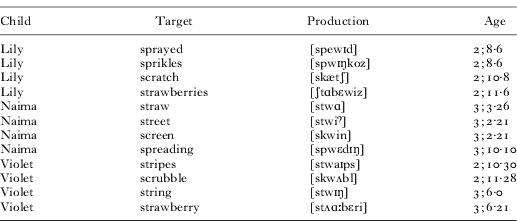
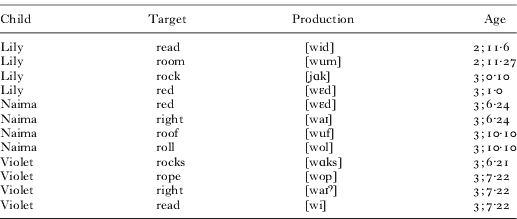
However, this account does not apply to C(C)r clusters in the current study, which were later-acquired and yet showed a weaker frequency effect. One possible explanation for this reversal of effect direction is that the difficulty in producing C(C)r clusters lies in the segment /r/ rather than the cluster as a whole. In fact, the data contain many examples of non-targetlike production of singleton /r/ even around or after three years (Table 8), and when the child's production of CCr clusters (i.e. /spr/, /skr/ or /str/) was non-targetlike, the deviance was usually found in the form of deletion or substitution of /r/ (Table 9). Thus, the accuracy of C(C)r at this stage of development is largely a matter of mastering the production of /r/, and the relationship between the accuracy of C(C)r production and the frequency of words containing the cluster may not be comparable to that of other cluster types.
Examples of non-targetlike production of singleton /r/s
Examples of non-targetlike production of CCr clusters
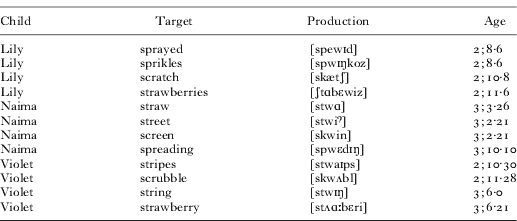
Taken together with the significant main effects of cluster types, these findings underscore the independent role played by phonological structures in the development of sound production. Certain initial consonant clusters take more time to be acquired regardless of how frequently words containing those clusters are heard in the input. Different cluster types are affected by lexical input frequency to various degrees. Thus, while it is true that words are important units in understanding the acquisition of sound patterns, the sound structures themselves cannot be dispensed with as units of analysis.
Input vs. production frequency
In this study, a distinction was made between input frequency and production frequency as, unlike in adult language use, the lexical frequencies in what children hear and what they produce may be different. The results of this study indicate that there is an effect of lexical input frequency that cannot be simply reduced to that of production frequency. The connection between production frequency and production accuracy is a fairly transparent one. Repetition of neuromotor routines can improve articulatory accuracy and may even enhance the phonological memory of learned words (Keren-Portnoy, Vihman, DePaolis, Whitaker & Williams, Reference Keren-Portnoy, Vihman, DePaolis, Whitaker and Williams2010). The link between input frequency and production accuracy, on the other hand, is less apparent. As briefly mentioned in the ‘Introduction’, one possible explanation is that the effect arises from the fidelity or retrievability of the phonological representations of words that improves through repeated exposure. While we are not able to provide direct evidence in support of this interpretation, the literature documents ample cases where the source of children's non-targetlike word production is located in representational errors (Macken, Reference Macken, Ferguson, Menn and Stoel-Gammon1992; Vihman, Reference Vihman1982). Such misrepresentation is more likely to be corrected when the adult model is heard often. There is also the possibility that frequent exposure to the adult production of a word imposes pressure on the child to overcome the phonological or articulatory restrictions on the production of clusters in a word. Recent models of phonological acquisition in constraint-based grammar acknowledge the need to incorporate lexical specificity into the phonological system by allowing individual words to induce different rankings of constraints on output forms (Coetzee & Pater, Reference Coetzee and Pater2008; Pater, Reference Pater, Burgos, Clark-Cotton and Ha2005). The relationship between the lexical gradualness of phonological change and input frequency may reflect such a developmental process, which restructures the phonological system that regulates possible production forms.
Future directions and conclusion
There are several directions in which this research can be extended. The effects of cluster type found in our study suggest that the role of input frequency in early phonological development may differ across broader types of sound patterns. Thus, to be able to generalize our findings, we need to carry out similar investigations on other phonological structures (e.g. segment type, syllable structure, word-level prosody). By comparing how frequency affects the production of sound patterns in different domains, we may also be able to gain some insights into which of these phonological structures play psychologically real roles in early word production.
Although the results of this study are in accordance with previous research indicating that frequency effects are more robust in late-acquired phonological patterns, the issue warrants further investigation. The hypothesis in this study was that the development of sound patterns is strongly lexically bound initially; this is then followed by generalization across-the-board after production becomes targetlike in a certain number of words. But the relationship between phonological structure and lexical frequency is likely to be more dynamic and less monotonous than suggested by such a model.
One lexical factor that was shown to affect the order of phonological acquisition is lexical neighborhood. For later-acquired words, but not in earlier-acquired words, mastery of initial clusters was more likely in sparse neighborhoods than in dense neighborhoods. This finding has some implications for when the lexicon of young children becomes large enough to exhibit any neighborhood effects (Charles-Luce & Luce, Reference Charles-Luce and Luce1990; Coady & Aslin, Reference Coady and Aslin2003; Dollaghan, Reference Dollaghan1994). It also seems to counter the Lexical Restructuring Model (Metsala & Walley, Reference Metsala, Walley, Metsala and Ehri1998), according to which words in dense neighborhoods are more likely to undergo restructuring as the inaccuracy of words with many neighbors has greater potential for confusion. Further longitudinal analysis of the production data from children under the age of three may shed new light on these issues.
In conclusion, this study provided the first systematic evidence that, during the first few years of linguistic production, children master new sound patterns first in frequent words. In particular, it has shown that lexical frequency in the maternal input was a significant predictor of the age at which a word reaches a certain level of accuracy in the production of initial clusters by English-speaking children. These results are consistent with the view that individual lexical items, in addition to the specific sound patterns, are important units of development in phonological acquisition.