Introduction
Yam plants belong to the genus Dioscorea in the plant family of Dioscoreaceae and are monocotyledonous (Etejere and Bhat, Reference Etejere and Bhat1986; Okigbo, Reference Okigbo2005). They are the second most important tuber crop globally after cassava in terms of production, and the third most important global source of carbohydrate after cereals and cassava (Wheatley et al., Reference Wheatley, Scott, Best and Wisesema1995). They are predominantly cultivated as underground tubers in the tropics of West and East Africa, Asia, Central and South America, whereas, Nigeria, Côte d'Ivoire, Ghana, Benin and Togo accounts for 90% of the 36.6 million tons that are produced worldwide primarily by smallholder farmers (Sotomayor-Ramirez et al., Reference Sotomayor-Ramirez, Gonzalez-Velez and Roman-Paoli2003; Katung et al., Reference Katung, Idem, Onyibe, Idem and Showemimo2006; IITA, 2013; Kolombia et al., Reference Kolombia, Karssen, Viaene, Kumar, De Sutter, Joos, Coyne and Bert2017; FAO, 2019). The yams occur in about 600 species with only seven of them being stapled food (Akoroda, Reference Akoroda, Kalloo and Bergh1993). The crop duration, from its planting to harvesting, ranges from 7 to 12 months (Ibeawuchi and Ofoh, Reference Ibeawuchi and Ofoh2003). Its economic importance has gone beyond being mostly a consumable staple food to the value chain in pharmaceutical and cosmetic industries thus becoming a major source of household income in the farming systems (IITA, 2013; Mignouna et al., Reference Mignouna, Abdoulaye, Alene, Aighewi, Pelemo, Manyong, Asiedu and Akoroda2013; Nyadanu et al., Reference Nyadanu, Dapaah and Agyekum2014; Bekele and Bekele, Reference Bekele and Bekele2018). However, its traditional cultivation systems over West Africa has been under increasing pressure to adapt to the short fallow periods due to the scarcity of new lands for shifting cultivation, and to climate change (Manyong et al., Reference Manyong, Smith, Weber, Jagtap and Oyewole1996).
Nigeria accounted for two-thirds of annual global yam production (Bergh et al., Reference Bergh, Orozco, Gugerty and Anderson2019). It accounts for 80% of West Africa's production valued at about USD7.75 billion based on the 2.9 million hectares of land cultivated in 2012 (Ezulike et al., Reference Ezulike, Udealor, Nwosu and Asumugha2006; Enesi et al., Reference Enesi, Hauser, Lopez-Montez and Osonubi2018; NBS, 2019). The crop is commonly grown in the country's rain-forest and Guinea savanna zones, which have a higher amount of humidity and rainfall (Olasantan, Reference Olasantan1999; Ike and Inoni, Reference Ike and Inoni2006; Bergh et al., Reference Bergh, Orozco, Gugerty and Anderson2019). Depending on the species, size of the seed piece and environment, the crop's potential yield ranges from 20 to 50 tons per hectare, whereas, the labor cost from mounding to staking accounts for about 40% of the cultivation cost (Kader, Reference Kader2005; Verte and Bečvařova, Reference Verte and Bečvařova2015). The tubers are mostly harvested between June and September and thereafter stored based on the cultural, traditional or technological capability of the people for consumption, sales and replanting (Amusa, Reference Amusa2000). A freshly harvested tuber contains about 70% water, 25% starch, 1–2% protein and traces of sugars, minerals and vitamins (Bassey and Akpan, Reference Bassey and Akpan2015; Nweke, Reference Nweke2015). However, with the increasing population comes a higher demand of food and nutrition hence an increment in yam consumption, which makes the demand to exceed its supply (Shiwachi et al., Reference Shiwachi, Kikuno, Fashola and Asiedu2008; Oluwatayo and Ojo, Reference Oluwatayo and Ojo2016).
An adequate storage system for the yams should prevent moisture loss, sprouting, attack by animals or insects and spoilage due to pathogens, thereby preventing reduction in weight and quality whereas retaining edibility and marketability (Osunde and Orhevba, Reference Osunde and Orhevba2009). In Nigeria, the yam barn is the main traditional storage method accepted by most farmers, whereas, improved yam storage technologies such as shelving has not been fully adopted (Okoedo-Okojie and Onemolease, Reference Okoedo-Okojie and Onemolease2009). The other storage methods are: the chemical preservation of the postharvest (Ogali et al., Reference Ogali, Opadokun and Okobi1991; Ejechi and Ilondu, Reference Ejechi and IIondu1999), the no-chemical treatment of curing of yams in the sun immediately after harvest (Okigbo and Ikediugwu, Reference Okigbo and Ikediugwu2002) and the cold room preservation of the postharvest below 10°C (Eze et al., Reference Eze, Umeh, Ugwuoke, Ameh and Onyeke2015). However, the major constrain is that more than 50–60% of the harvests are lost during storage starting from the third month and peaking in the sixth month while the tubers lose up to 50% of their fresh matter (Eze et al., Reference Eze, Umeh, Ugwuoke, Ameh and Onyeke2015). This constrain is not peculiar to Nigeria as studies have shown that more than 25% of global yam production is lost to storage annually (Nyadanu et al., Reference Nyadanu, Dapaah and Agyekum2014). Nigeria recorded its highest yam loss of over 3.7 million metric tons in 2006 (Verter and Bečvářová, Reference Verte and Bečvařova2015). The National Technical Committee on Nigeria Yam Export Programme has targeted USD10 billion earnings from the country's yam export by the year 2022 (Tribune, 2018). Indeed, the storage losses are attributed to microbial rot, with fungi having a superior effect compared to bacteria and nematodes (Otusanya and Jeger, Reference Otusanya and Jeger1996; Okoedo-Okojie and Onemolease, Reference Okoedo-Okojie and Onemolease2009; Nweke, Reference Nweke2015).
Studies have shown that rot severity is prevalent in the humid forest region of Nigeria (Dania et al., Reference Dania, Fadina, Ayodele and Kumar2019). Based on their symptoms and causal agents, the rot is categorized into dry, wet and soft rot, respectively, and the dry rot is considered the most devastating (Amusa and Baiyewu, Reference Amusa and Baiyewu1999; Amusa et al., Reference Amusa, Adegbite, Muhammed and Baiyewu2003; Anjorin et al., Reference Anjorin, Nwokocha and Sanni2014). The microorganisms infect the tubers through diseased foliage, roots or mother tubers, or during harvest and transportation to storage (Ogundana et al., Reference Ogundana, Naqvi and Ekundayo1970; Enesi et al., Reference Enesi, Hauser, Lopez-Montez and Osonubi2018). Several studies have investigated the pathogenicity of the rot, whereas, others suggested that biological/botanical methods to be used in preventing the rots owing to their advantage over chemical methods in harming both the tuber and the environment (Okigbo, Reference Okigbo2005; Kumar et al., Reference Kumar, Reddy, Reddy and Devi2007). In some of the previous studies, the fungal organism Trichoderma harzianum has been effective at inhibiting the pathogenic effect of the fungal pathogenic rot caused by Colletotrichum species and Penicillium purpurogenum (Gwa and Abdulkadir, Reference Gwa and Abdulkadir2017; Gwa and Ekefan, Reference Gwa and Ekefan2017). The fungal pathogens Aspergillus niger, Lasiodiplodia theobromae, Rhizoctonia solani, Penicillium oxalicum, Fusarium oxysporum and Sclerotium rolfsii are adequately inhibited by Bacillus subtilis (Dania et al., Reference Dania, Fadina, Ayodele and Kumar2016). The aqueous and ethanolic extracts of neem samples have effectively inhibited the pathogens S. rolfsii and L. theobromae (Ezeonu et al., Reference Ezeonu, Imo, Agwaranze, Iruka and Joseph2018). Also, Mimosa pudica has been effective at controlling the fungal pathogens A. niger and F. oxysporum (Okigbo et al., Reference Okigbo, Chukwuma and Ani2017). Similarly, the bacteria pathogens Erwinia carotovora, Pseudomonas aeruginosa, Serratia marcescens and Klebsiella oxytoca were completely inhibited by selected plant extracts that were synergistically administered (Shiriki et al., Reference Shiriki, Obochi, Eke and Shambe2017). The nematode pathogens Meloidogyne incognita, Scutellonema bradys and Pratylenchus brachyurus were effectively reduced by using vine propagation compared to the conventional sett method (Claudius-Cole et al., Reference Claudius-Cole, Omotayo and Montes2020). Nevertheless, varying climate conditions such as relative humidity, air temperature and rainfall are considered to increase the incidence and severity of these causative pathogens (Olabiyi et al., Reference Olabiyi, Afolabi, Adewole, Omomowo, Leal Filho, Belay, Kalangu, Menas, Munishi and Musiyiwa2017).
Optimum rot occurs at air temperature between 26 and 30°C, whereas, a significant rot from all pathogens occur in the range of 20–30°C at a relative humidity above 80% (Ogundana et al., Reference Ogundana, Naqvi and Ekundayo1970). These reduce the phenolics, saponins and other natural antioxidants in the tuber against the pathogenic organisms (Buzby and Hyman, Reference Buzby and Hyman2012). Hence, the virulent pathogens will not infect the tubers if the climatic conditions are not favorable (Velasquez et al., Reference Velasquez, Castroverde and He2018). It is common knowledge that climate change affects the growing pattern of most crops, hence becoming a major challenge to the global food system (Rosenzweig et al., Reference Rosenzweig, Elliot, Deryng, Ruane, Muller, Arneth, Boote, Folberth, Glotter, Khabarov and Neumann2014; Bashir et al., Reference Bashir, Atiq and Mohsan2018; Manners and van Etten, Reference Manners and van Etten2018). There have been efforts to quantify the effect of climate variability on crops while other studies have attempted investigating the potential impacts from future climate variability (Nwaobiala and Nottidge, Reference Nwaobiala and Nottidge2015; Manners and van Etten, Reference Manners and van Etten2018; Chen et al., Reference Chen, Wang, Niu, Zhang, Li and Li2020). A number of the studies have emphasized on the impact of climate change on the growing areas for yam production as well as on the rate of production (Sonder et al., Reference Sonder, Okonkwo and Asiedu2010; Srivastava et al., Reference Srivastava, Gaiser, Paeth and Ewert2012; Angba et al., Reference Angba, Baines and Butler2020; Fan et al., Reference Fan, Zhong, Hu, Tian, Sun, Fischer, Wang and Jiang2020). Indeed, climate affects all life stages of both the pathogens and the tuber; however, climate change could have a positive, negative or neutral impact on plant diseases (Olabiyi et al., Reference Olabiyi, Afolabi, Adewole, Omomowo, Leal Filho, Belay, Kalangu, Menas, Munishi and Musiyiwa2017).
The available primary tools for deducing future climate change scenarios due to changes in greenhouse gases concentrations, aerosols and land-use change across the world are climate models. The regional climate models (RCMs) dynamically downscale the global climate models (GCMs). Their outputs are at high-resolutions (up to 50 km) relevant for vulnerability, impact and adaptation studies (Giorgi and Mearns, Reference Giorgi and Mearns1999; Nikiema et al., Reference Nikiema, Sylla, Ogunjobi, Kebe, Gibba and Giorgi2017). The CoOrdinated Regional Downscaling Experiment (CORDEX) is the first international program offering a common protocol for downscaling experiments (Giorgi and Gutowski, Reference Giorgi and Gutowski2015). The performances of the RCM within the CORDEX-Africa experiments have been validated in numerous studies (Mounkaila et al., Reference Mounkaila, Abiodun and Omotosho2015; Diallo et al., Reference Diallo, Giorgi, Deme, Tall, Mariotti and Gaye2016; Akinsanola and Ogunjobi, Reference Akinsanola and Ogunjobi2017; Okoro et al., Reference Okoro, Chen, Nath and Nnamchi2020).
In this study, we analyze the near-term (up to the year 2050) effect of rainfall variability on yam production, considering the impacts from yam rot, within the humid tropical region of Nigeria. The specific objectives of this study are (i) to evaluate the recent trend in yam production in Nigeria, (ii) to investigate the statistical relationship between yam production, yam tuber rot disease and rainfall variability and (iii) to investigate the projections in yam production and rot disease to the year 2050 based on the CORDEX-Africa models output. Variability is more pronounced in the rainfall trends than in any other climate variable over this region (Sidibe et al., Reference Sidibe, Dieppois, Eden, Mahe, Paturel, Amoussou, Anifowose, Van De Wiel and Lawler2020).
Materials and methods
Study area
The humid tropical region of Nigeria is located from longitude 3°E to 12°E and latitude 4°N to 9°N, within the Guinea Coast zone of West Africa (Ogungbenro and Morakinyo, Reference Ogungbenro and Morakinyo2014; Akinsanola et al., Reference Akinsanola, Ogunjobi, Ajayi, Adefisan, Omotosho and Sanogo2016). The region accommodates about 53.5% of the country's population and accounts for about 30% of the country's total land area (FRNOG, 2007). There is a wide diversity of cultures among the people, who are predominantly farmers with about 72.4% labor force participation rate to the population (UNDP, 2015; Nwokocha et al., Reference Nwokocha, Okoro and Usoh2018). The humid rainforest, derived savanna and southern Guinea savanna agroecological zones of Nigeria, noted for the country's major yam production, are located within this region (Dania et al., Reference Dania, Fadina, Ayodele and Kumar2019). Yam production archives for Anambra, Benue, Delta, Ekiti, Ondo and Taraba states, respectively, within the region were analyzed. The choice for the locations is based on their being the foremost in output (Kolombia et al., Reference Kolombia, Karssen, Viaene, Kumar, De Sutter, Joos, Coyne and Bert2017; Bergh et al., Reference Bergh, Orozco, Gugerty and Anderson2019). The rot incidence survey was carried out in Imo state located within the region. This location is remote from the production locations as the yam wares should have been exposed to handlings during storage and transport. Also, the choice of the metropolitan State is vital to the frequency in the yam ware supply. However, the entire region has similar climate conditions, soil characteristics and a representative crop and soil management (Dania et al., Reference Dania, Fadina, Ayodele and Kumar2019). It is also influenced by the localized convection and variability of the West African monsoon, which supports the rainfall onset in May and its cessation in October (Sanogo et al., Reference Sanogo, Fink, Omotosho, Ba, Redl and Ermert2015). Figure 1 shows humid tropical Nigeria indicating the selected state with their climatological mean (1979–2018) of annual rainfall and the three agroecological zones, respectively.
Humid tropical Nigeria (delineated below thin horizontal line) indicating the selected state locations with their annual rainfall (mm) climatological mean from 1979 to 2018 (solid squares), and the three agroecological zones, respectively (shaded).

Yam production outputs
The Food and Agriculture Organization of the United Nations (FAO) archives the yearly output of national yam production for member countries. Production is defined as comprising both the quantities of yam sold in the market and those consumed or used by the farmers, recorded in metric tons (FAO, 2019). The production data for Nigeria from 1979 to 2018 were retrieved from https://fao.org/faostat/en/#data. However, records of Nigeria's yam production output vary between the FAO and Nigeria National Bureau of Statistics (NBS) as both datasets were prepared independently, with varying methods (Bergh et al., Reference Bergh, Orozco, Gugerty and Anderson2019). The NBS outputs archive for each of the Administrative States in Nigeria from 1995 to 2006 were retrieved from https://nigerianstat.gov.ng/. The NBS is used to validate the FAO at each of the foremost production locations selected in this study.
Rainfall
Observational monthly rainfall data were obtained from the Climatic Research Unit (CRU) version 4.01 at 0.5° by 0.5° horizontal grids over land areas (Harris and Jones, Reference Harris and Jones2017). The choice of CRU is based on it being gage only observation data, whereas, it has extensively been validated over the region with the results indicating its outstanding performance (Okoro et al., Reference Okoro, Chen, Chineke and Nwofor2014; Akinsanola et al., Reference Akinsanola, Ogunjobi, Ajayi, Adefisan, Omotosho and Sanogo2016; Sun et al., Reference Sun, Miao, Duan, Ashouri, Sorooshian and Hsu2018). In this study, we analyzed the period from 1979 to 2018, from when the CRU observations network was improved and the satellite observations could validate the quality of the datasets (Sun et al., Reference Sun, Miao, Duan, Ashouri, Sorooshian and Hsu2018).
CORDEX-Africa
The models' monthly outputs of rainfall were retrieved from the Earth System Grid Federation data nodes (https://esgfindex1.ceda.ac.uk/projects/esgf-ceda/). The five RCMs within the CORDEX-Africa domain that participated in similar experiments' and have outputs for the appropriate variables were selected (Giorgi and Gutowski, Reference Giorgi and Gutowski2015). The historical experiment outputs from 1979 to 2005 have been examined for performance evaluation. The bias-corrected (see Section ‘Data analysis’) projection outputs of the representative concentration pathway (RCP) 4.5 and 8.5 experiments from 2006 to 2050 were analyzed, respectively. The RCP 4.5 and RCP 8.5 were selected based on their representation of the moderate and extreme climate change scenarios, respectively (Meinshausen et al., Reference Meinshausen, Smith, Calvin, Daniel, Kainuma, Lamarque, Matsumoto, Montzka, Raper, Riahi and Thomson2011). Further descriptions of the selected models are presented in Table 1.
List of the CORDEX-Africa models, their descriptions and references

Sampling survey and rot incidence
The monthly field survey for white yam (Dioscorea rotundata Poir) rot incidence was carried out from January to December in 2018 at four selected major foodstuff markets in the Owerri metropolis of Imo state. Using simple random selection we acquired 100 tubers of yam by lottery method in each of the four markets, respectively, summing a total of 400 tubers of yam examined in each month. The choice of the yam species is based on it being the most cultivated and the most consumed, locally (Dania et al., Reference Dania, Fadina, Ayodele and Kumar2016; Bergh et al., Reference Bergh, Orozco, Gugerty and Anderson2019). The market serves as a functional storage facility to edible yam across the country and accommodates products originating from the foremost production locations, round the year. Personal communications with the traders confirm that a yam ware do not last more than 2 weeks in stock and they were sourced from the farmers located in the major yam producing locations. It is noteworthy that both the marketers and the farmers share grave loss experiences due to the rot. Recently, cities have served as major outlets for yam commercialization whereas the consumption fuels the expansion in its production (Amegbeto et al., Reference Amegbeto, Manyong, Coulibaly and Asiedu2008; Kolombia et al., Reference Kolombia, Karssen, Viaene, Kumar, De Sutter, Joos, Coyne and Bert2017).
The percentages of rot incidence per month on the examined yam samples were computed as,

Pathogenicity and proximate composition analysis
The diseased tissue, identified after cutting through a tuber, is typically brown and as the disease progresses the regions first infected turns darker and water-soaked lesions occur (Ogundana et al., Reference Ogundana, Naqvi and Ekundayo1970; Amegbeto et al., Reference Amegbeto, Manyong, Coulibaly and Asiedu2008). The diseased samples were isolated and subjected to pathogenicity tests to confirm rots using the methods described in Ezeonu et al. (Reference Ezeonu, Imo, Agwaranze, Iruka and Joseph2018) and Dania et al. (Reference Dania, Fadina, Ayodele and Kumar2019) for the fungi pathogen-induced rots, Shiriki et al. (Reference Shiriki, Obochi, Eke and Shambe2017) for the bacteria pathogen-induced rots and Kolombia et al. (Reference Kolombia, Kumar, Adewuyi, Korie, Viaene, Bert and Coyne2020) for the nematode induced rots. Both the healthy and the diseased samples were compared for nutritional composition using the proximate analysis methods described in Bekele and Bekele (Reference Bekele and Bekele2018).
Data analysis
The 12-month standardized precipitation index (SPI), which reflects the long-term annual rainfall variability over the region, is calculated using the gamma-to-normal distribution described in WMO (2012). The characteristic impact (Wei et al., Reference Wei, Su and Yang2016) of the variations in the monthly rainfall over the region on the percentage of yam rot incidence is estimated, assuming a linear relationship, as

where the value of κ is in percentage rot incidence per month, the first term is a regression coefficient of the monthly rainfall on the percentage rot incidence per month, whereas, the second term is the standard deviation (s.d.) of the monthly rainfall. A positive (negative) value of κ indicates a consequent increase (decrease) in the magnitude of the percentage rot incidence.
Trends of the rainfall variability and the national yam production output were investigated using the nonparametric Sen's slope and were tested for statistical significance using the Mann–Kendall test (Gilbert, Reference Gilbert1987). The coefficient of variation (CV) indicates the level of the variability with the climatological means. Assuming a linear dependency for simplicity, the coefficient of correlation (r) value indicates the strength of the relationship between compared datasets while the t-test determines the statistical significance of the value. The mean bias error (MBE) indicates the average deviation as well as the systematic differences between the models' output and the observational.
The bias-correction of the models' output is computed, assuming the MBE to be constant at each grid point, over time, in each model, respectively, using the method described in Nath et al. (Reference Nath, Cui, Nath, Graf, Chen, Wang, Gong and Li2017) as

where P mod is the model output and n is the number of months in the time series. The Kling–Gupta efficiency (KGE) indicates the models' performance to calibration and evaluation, compared to the observation, and is computed as

where σobs and σmod are the s.d. in the observation and models' simulation, respectively, while μmod and μobs are the models' simulation and the observation means, respectively. Assuming the mean states as the benchmark of evaluation, values in the range of −0.41 < KGE ≤ 1 are considered ‘reasonable’ performances, whereas, KGE = 1 indicates a perfect agreement (Knoben et al., Reference Knoben, Freer and Woods2019).
Results and discussion
Recent yam production status in Nigeria
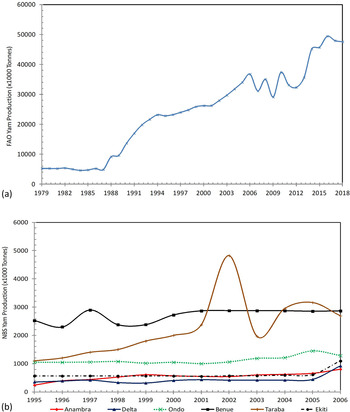
Differences in the preparation of the production datasets necessitated the representation performance evaluation of the national annual output at various locations. In Figures 2a and 2b the time series of FAO national annual yam production output for Nigeria from 1979 to 2018 and the NBS annual yam production data of the locations from 1995 to 2006, respectively, are shown. The FAO production output indicates an increment with a positive trend of 1157.08 × 103 metric tons of yam production per year, at α = 0.001 level of significance from the Mann–Kendall test. The FAO output is validated with the NBS data at the various locations, for the same time scale, to investigate their representation of the national output. From the comparison, the locations show positive r values (Anambra = 0.86; Benue = 0.59; Delta = 0.73; Ekiti = 0.70; Ondo = 0.85; Taraba = 0.57), all significant at 95% confidence level from the t-test. This result indicates that the recent increment in the national annual yam production is adequately replicable in the respective locations.
Time series of (a) FAO national annual yam production (tons) output for Nigeria from 1979 to 2018, and (b) NBS annual yam production (tons) data for the states from 1995 to 2006.

Rot incidence and the effect on tuber quality
The monthly percentage rot incidence, as observed in Imo state in 2018, is shown in Figure 3 with the error bars indicating the standard deviation (s.d.) of the percentage rot incidence in each month, respectively. The values indicate that July recorded the maximum incidence whereas January and December recorded the least incidences from the survey. To validate rot incidence, the pathogenicity test on the yam samples confirms rot by isolates of fungi, bacteria and nematodes as the virulent pathogens. Table 2 shows the average population of the fungi isolates expressed in colony forming unit (CFU) per 10 ml of water. The Botryodiplodia theobromae isolates have the maximum average number of colonies in the rot samples. Table 3 shows the average population of the bacteria isolates also expressed in CFU per 10 ml of water. The E. carotovora isolates show most colonies in the samples. Table 4 shows the average population density of the nematode species extracted from the peel of the rotted tubers. The Scutellonema species has the maximum frequency of occurrence in the diseased samples. This is linked to the storage conditions as the rate of infection is higher at higher storage temperature whereas poor storage spacing greatly enhances the population (Claudius-Cole et al., Reference Claudius-Cole, Omotayo and Montes2020). The quality of the sampled yams, from the proximate analysis, reveals that the rot diseased samples show deteriorating composition compared to the healthy samples (Table 5). These attributes affect the utilization value of yam tuber (Amegbeto et al., Reference Amegbeto, Manyong, Coulibaly and Asiedu2008).
Monthly percentage (%) of yam rot incidence from January to December 2018. The error bars indicate the s.d. of the percentage rot incidence in each month, respectively.

Average population of the pathogenic fungi isolates from the rotted tubers expressed in CFU per 10 ml of water

Average population of the pathogenic bacteria isolates from the rotted tubers expressed in CFU per 10 ml of water

Average population density of pathogenic nematode species extracted from the peel of the rotted tubers

Average percentage (%) composition from proximate analysis on 1 g sample of each yam

Rainfall variability and the links with rot incidence and yam production
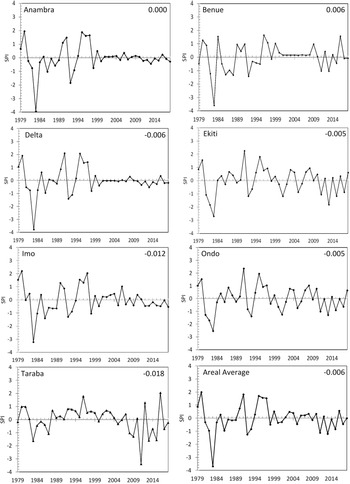
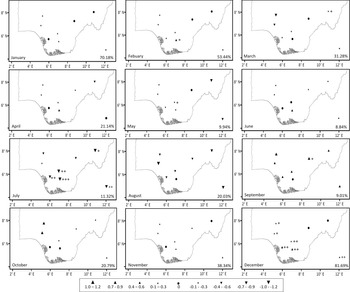
The 12-month SPI of the annual rainfall over the locations and the areal average from 1979 to 2018 is shown in Figure 4. The Sen's slopes indicate decreasing trends except at Anambra and Benue with increasing trends, respectively. However, the areal average shows a nonsignificant trend from the Mann–Kendall test, which is evident of the Guinea Coast zone (Sanogo et al., Reference Sanogo, Fink, Omotosho, Ba, Redl and Ermert2015; Okoro et al., Reference Okoro, Chen, Nath and Nnamchi2020). In Figure 5, the trends and CV of rainfall from 1979 to 2018 across the locations were computed for each month, respectively. The July rainfall show decreasing trends at all locations with the areal average indicating the decreasing trend at α = 0.01 level of significance from the Mann–Kendall test and less variability (CV = 11.32%). On the contrary, rainfall in December shows increasing trends in most locations with the areal average showing the increasing trend at α = 0.01 level of significance from the Mann–Kendall test but with high variability (CV = 81.69%).
12-month SPI of the annual rainfall at the locations and the areal average, respectively. Inserted at the top left corner of each panel is the Sen's slope of the trends.

Temporal trends of CRU monthly rainfall from 1979 to 2018 at the locations and the areal average, respectively. The Sen's slope (▴ = increase; ● = no trend; ▾ = decrease) values (mm yr−1) of the trends are indicated, whereas, the levels of significance (+ at α = 0.05; ++ at α = 0.01; +++ at α = 0.001) are shown. The Sen's slope value (mm yr−1), its significance level, and the CV value (%) for the areal average of each month, respectively, is indicated at the bottom right corner of each panel.

The statistical linear relationship between the monthly percentage rot incidence and the monthly rainfall at each location and the areal average is indicated in Table 6. The results show the positive correlation values, which are all significant at 99% confidence level from the t-test. Also, the monthly rainfall shows positive characteristic impact values with the percentage rot incidence, which signifies that increase (decrease) in the monthly rainfall corresponds to increase (decrease) in the magnitude of monthly percentage rot incidence. This result corroborates that the lower the natural antioxidants in plants occasioned by high rainfall, the more the rot incidence (Herrera et al., Reference Herrera, Verdecia, Ramirez, Garcia and Cruz2017). Hence, the significantly decreased July rainfall over the period (from 1979 to 2018) caused the reduction in the magnitude of percentage rot incidence that occurred in July for the same period. Indeed, this reduction in the magnitude of the July rot incidence guaranteed more healthy yams hence the increment in the country's annual yam production from 1979 to 2018.
Statistical relationship between the monthly percentage (%) yam rot incidence and the monthly rainfall

All correlation coefficient (r) values are significant at 99% confidence level from the t-test.
Since there is less percentage rot incidence in December coupled with the high CV value in the December rainfall, it is indicative that there exists little or no input to the annual yam production. The linear correlation value (r = −0.4, significant at 99% confidence level from the t-test) between the July rainfall and the annual yam production within the period corroborates the strong link that exit between them, whereas, that of the December rainfall and the annual yam production (r = 0.2, nonsignificant from the t-test) confirms little or no relationship.
CORDEX-Africa projected rainfall variability and the potential link with rot incidence and yam production
The CORDEX-Africa models’ performances were evaluated for the region by comparing the ability of the historical experiments’ outputs in simulating the CRU monthly rainfall from 1979 to 2005. The statistical results of the comparison are shown in Table 7. The models and their ensemble mean show positive correlation values, which are significant at 99.9% confidence level from the t-test. The models and the ensemble mean show negative MBE in simulating the CRU monthly rainfall except for CCLM4-8-17 and RCA4 having positive values. The KGE values indicate that all the models and the ensemble mean show reasonable performance in simulating the CRU monthly rainfall.
Statistical performance of the historical outputs (1979–2005) in simulating the CRU monthly rainfall variability and the annual rainfall temporal trends

All correlation coefficient (r) values are significant at 99.9% confidence level from the t-test.
Indeed, the models and the ensemble mean agree with CRU in simulating the nonsignificant (from the Mann–Kendall test) positive Sen's slope in the 12-month SPI of the region's interannual rainfall. Also, the results in Figure 6 reveal that the models and the ensemble mean show outstanding performance in simulating the CRU July rainfall. This is evident as they show negative trends on the areal averages except for HIRHAM5 with a nonsignificant positive trend.
Temporal trends of July rainfall simulations in historical output from the models and the ensemble mean, and the CRU for the same period. The Sen's slope (▴ = increase; ● = no trend; ▾ = decrease) values (mm yr−1) of the trends are indicated, whereas, the level of significance (+ at α = 0.05) is shown. The Sen's slope value (mm yr−1) for the areal average of each month is indicated at the bottom right corner of each panel.

The bias-corrected outputs of RCP 4.5 and RCP 8.5 experiments from the models and the ensemble mean were analyzed. The comparison of their performance in simulating the CRU rainfall from 2006 to 2018 is presented in Table 8. The models and the ensemble mean show outstanding improvements in simulating the CRU monthly rainfall as evident in the correlation and KGE values, respectively, in both RCP 4.5 and RCP 8.5. Also, the improved MBE values of the bias-corrected simulation of the monthly rainfall are presented in RCP 4.5 and RCP 8.5, respectively. However, the models and the ensemble mean show varying polarity and significance of their trends in simulating the bias-corrected 12-month SPI interannual rainfall. In the RCP 4.5, CCLM4-8-17 and the ensemble mean have positive trends (at α = 0.01 level of significance from the Mann–Kendall test), whereas, CRU has a nonsignificant negative trend. The remaining models have nonsignificant negative trends except for HIRHAM5 and RCA4. In RCP 8.5, the models and the ensemble mean concurs with CRU in simulating the nonsignificant trend in the 12-month SPI. Nonetheless, RACMO22T and REMO2009 simulate positive trends while the rest have negative trends, in agreement with the CRU.
Statistical performance of the bias corrected RCP 4.5 and RCP 8.5 outputs, respectively, in simulating the CRU monthly rainfall variability and the annual rainfall temporal trends from 2006 to 2018

All correlation coefficient (r) values are significant at 99.9% confidence level from the t-test.
++ Signifies at α = 0.01 level of significance.
In Table 9 the trends of the bias-corrected projection for 12-month SPI simulations of the interannual rainfall, between 2019 and 2050, from the RCP 4.5 and RCP 8.5 experiments, respectively, are shown. Both the RCP 4.5 and RCP 8.5 project nonsignificant trends (from the Mann–Kendall test) during the period. In the RCP 4.5, CCLM4-8-17, RACMO22T and RCA4 projects positive trends while HIRHAM5, REMO2009 and the ensemble mean project negative trends. On the contrary, all the models and the ensemble mean project positive trends except for CCLM4-8-17 and RCA4 with negative trends, respectively, in the RCP 8.5. Figures 7 and 8 show the models and the ensemble mean projections of the bias-corrected July rainfall from 2019 to 2050 in RCP 4.5 and RCP 8.5, respectively. The results in Figure 7 reveal that on areal average, projections in RCP 4.5 indicate that all the models and the ensemble mean have nonsignificant (from the Mann–Kendall test) positive trends except for REMO2009 that has a positive trend. Similarly in Figure 8, the projections in RCP 8.5 show the models and the ensemble mean have nonsignificant positive trends except for CCLM4-8-17 and REMO2009 with negative trends, respectively.
Projected 12-month SPI of annual rainfall temporal trends from 2019 to 2050 in the bias corrected outputs of RCP 4.5 and RCP 8.5 experiments, respectively

Projected trends of July rainfall in RCP 4.5 from the models and the ensemble mean from 2019 to 2050. The Sen's slope (▴ = increase; ● = no trend; ▾ = decrease) values (mm yr−1) of the trends are indicated, whereas, the level of significance (+ at α = 0.05) is shown. The Sen's slope value (mm yr−1) for the areal average of each month is indicated at the bottom right corner of each panel.

Projected trends of July rainfall in RCP 8.5 from the models and the ensemble mean from 2019 to 2050. The Sen's slope (▴ = increase; ● = no trend; ▾ = decrease) values (mm yr−1) of the trends are indicated, whereas, the level of significance (+ at α = 0.05) is shown. The Sen's slope value (mm yr−1) for the areal average of each month is indicated at the bottom right corner of each panel.

Eventually, from the outstanding performances of the bias-corrected output of the models and the ensemble mean, with the majority of the projections indicating positive trends in the July rainfall, it is adequate to state that the magnitude of July percentage rot incidence over the region will increase by the year 2050 if the practices remain business as usual. This increment in the magnitude of percentage rot incidence will consequently imply a decrease in the annual yam production over the region, vis-à-vis the country, by the year 2050. Indeed, the differences in the areal averages of both scenarios indicate that the magnitude of percentage rot incidence will be greater in the RCP 8.5 than in the RCP 4.5.
Uncertainties and limitations of the study
It is noteworthy to state some limitations in this study. First is the limited duration and spatial coverage of the diseased yam sampling for rot incidence. A longer time series and a broader areal coverage would have been desirable. Another limitation is that our study did not investigate the effects from the preservation techniques the yams may have been exposed to, the advancements in the method of yam storage and the improvements in the cultivation processes of the yam tuber. However, the uncertainties associated with this study is mostly on the possible occurring scenarios in the region rainfall variability due to climate change and the emergence of new yam diseases that may be associated with climate change.
Conclusion
Threats from the changing climate are obvious and one of the most vulnerable aspects is on global food security. In an approach to adapt and mitigate this vulnerability, we have analyzed the near-term impact of rainfall variability over humid tropical Nigeria on the percentage rot incidence and the annual yam production output. The FAO annual yam production data for the country from 1979 to 2018 indicate a significant increasing trend. The NBS data for Anambra, Benue, Delta, Ekiti, Ondo and Taraba states, respectively, from 1995 to 2006 validate the FAO submission of increasing production trend. The percentage rot incidences on the sampled yams from the survey indicate its peak occurrence in July. The rots virulent pathogens have been confirmed to be fungi, bacteria and nematodes, whereas, the effect of the rots on the yams composition and quality has been revealed. The CRU monthly rainfall climatology, which shows a nonsignificant decreasing trend in the region's interannual rainfall, indicates a significant decreasing trend in the July rainfall. As observed in 2018, the monthly rainfall showed significant positive correlation values with the percentage rot incidence, whereas, it indicated the positive characteristic impact value with the rot incidences. Therefore, we have deduced that the July rainfall that significantly reduced from 1979 to 2018 consequently reduced the magnitude in percentage rot incidence that peaks in July hence increasing the annual yam production over the region within the period.
The performances of CORDEX-Africa models and their ensemble mean historical outputs in simulating the CRU rainfall from 1979 to 2005 show a good measure of agreement, whereas, the differences are a measure of the uncertainties. The bias-corrected outputs in RCP 4.5 and RCP 8.5, respectively, have been compared with the CRU rainfall from 2006 to 2018 and the results indicate improved ‘reasonable’ performances. The projected July rainfall from 2019 to 2050 reveals an increasing trend, which indicates the potential increment in the magnitude of percentage rot incidence and consequently the impending decline in the annual yam production. This result is imperative considering the importance of yam as a major staple food and big input for pharmaceutical industries as well as the food insecurity that the decline in yam availability shall cause.
Acknowledgement
This research project is supported by the TETFund (2011–2014 Merged) Institution Based Research Intervention Fund (Ref No. TETFUND/DRSS/UNIV/OWERRI/2015/RP/VOL. 1) of Imo State University, Owerri, Nigeria. The authors are grateful to the research team as well as the anonymous reviewers.
Conflict of interest
There is no conflict of interest.