Introduction
Goats are among the most fertile of the domestic species, which makes their use very attractive for scientific, commercial and industrial purposes. Thus, assisted reproductive technologies have become increasingly important tools to boost the efficiency in highly organized breeding programmes or to make use of goats as bioreactors, in the context of gene pharming (Baldassarre et al., Reference Baldassarre, Wang, Kafidi, Guathier, Neveu, Lapoint, Sneek, Leduc, Duguay, Zhou, Lazaris and Karatzas2003b). Among such technologies, the in vitro production of embryos distinguishes itself as it offers an alternative to superovulation as a source of embryos for transfer and manipulation purposes (Cognié & Baril, Reference Cognié and Baril2002).
Laparoscopic oocyte recovery (LOR) has become a method of choice for oocyte retrieval in the past few years. Due to LOR's less invasive nature and repeatability on the same donor, allowing the collection even from prepuberal, pregnant, puerperal or aged animals (Baldassarre & Karatzas, Reference Baldassarre and Karatzas2004), we highlight the potential beneficial use of LOR for endangered breeds. The conservation of breeds that are considered at risk of loss, such as Canindé goats (Mariante & Egito, Reference Mariante and Egito2002), a breed unique to the Northeast Brazil, and used in the present work, is important for biodiversity.
To increase the number of oocytes available for recovery and, hence, the number of embryos available for transferring following in vitro fertilization, ovarian stimulation is usually carried out using exogenous gonadotrophins (Baldassarre et al., Reference Baldassarre, Keefer, Wang, Lazaris and Karatzas2003a). Years of research in goat ovarian stimulation have shown that exogenous follicle stimulating hormone (FSH) can be used to increase the number of viable oocytes on a per cycle/collection basis (Baldassarre & Karatzas, Reference Baldassarre and Karatzas2004).
It is known that in both mono- and poly-ovulatory species follicular growth is a continuum, controlled by the interaction between extra-ovarian factors, such as gonadotrophins, and locally produced growth factors (Van Den Hurk & Zhao, Reference Van Den Hurk and Zhao2005; Webb et al., Reference Webb, Garnsworthy, Campbell and Hunter2007). In general, growth factors such as epidermal growth factor (EGF), are considered the finely modulator of follicular growth, orchestrated by FSH and luteinising hormone (LH) through the surrounding somatic cells, being essential for the completion of oocyte growth and maturation (Gilchrist et al., Reference Gilchrist, Ritter and Armstrong2004; Webb et al., Reference Webb, Garnsworthy, Campbell and Hunter2007). Therefore, it is not surprising that several studies have reported the FSH-induced expression of EGF and EGF-like factors in cumulus–oocyte complexes (COCs) or cultured follicular cells (Sekiguchi et al., Reference Sekiguchi, Mizutani, Yamada, Yazawa, Kawata, Yoshino, Kajitani, Kameda, Minegishi and Miyamoto2002; Shimada et al., Reference Shimada, Hernandez-Gonzalez, Gonzalez-Robayna and Richards2006; Downs & Chen, Reference Downs and Chen2008). The presence of EGF in the follicular fluid of developing follicles has been reported in mammalian species such as pigs (Hsu et al., Reference Hsu, Holmes and Hammond1987) and humans (Westergaard & Andersen, Reference Westergaard and Andersen1989). EGF has also been shown to influence meiotic maturation and development competence of oocytes in various species (rat, Dekel & Sherizly, Reference Dekel and Sherizly1985; mouse and human, Das et al., Reference Das, Stout, Hensleigh, Tagatz, Phipps and Leung1991; sheep, Guler et al., Reference Guler, Poulin, Mermillod, Terqui and Cognie2000; cattle, Lonergan et al., Reference Lonergan, Carolan, Langendonckt, Donnay, Khatir and Mermillod1996; and pig, Prochazka et al., Reference Prochazka, Srsen, Nagyova, Miyano and Flechon2000), including goats (Gall et al., Reference Gall, Boulesteix, Ruffini and Germain2005).
The EGF receptor (EGFR) as the name suggests is the receptor for EGFs (Assidi et al., Reference Assidi, Dufort, Ali, Hamel, Algriany, Dielemann and Sirard2008), and its activation may be a common pathway mediating the meiosis-inducing influence of gonadotrophins (Zhang et al., Reference Zhang, Ouyang and Xia2009). mRNA for EGFR has been identified not only in follicular cells, but also in oocytes of a number of species (dog, Hatoya et al., Reference Hatoya, Sugiyama, Nishida, Okuno, Torii, Sugiura, Kida, Kawate, Tamada and Inaba2009; goat, Gall et al., Reference Gall, Chene, Dahirel, Ruffini and Boulesteix2004; pig, Singh et al., Reference Singh, Rutledge and Armstrong1995; cattle, Lonergan et al., Reference Lonergan, Carolan, Langendonckt, Donnay, Khatir and Mermillod1996; and human, Qu et al., Reference Qu, Nisolle and Donnez2000). Notwithstanding, cumulus cells are thought to be the major receptor-expressing site for EGFs actions, generating a positive signal transferred to the oocyte via gap junctions (Atef et al., Reference Atef, François, Christian and Marc-Andre2005).
As the oocyte developmental competence has been associated with in vivo transcript accumulation, which is important for embryo development up to genome activation (Dieleman et al., Reference Dieleman, Hendriksen, Viuff, Thomsen, Hyttel, Knijn, Wrenzycki, Kruip, Niemann, Gadella, Bevers and Vos2002), it is not surprising that the competence of in vitro matured oocytes is determined by factors such as hormonal stimulation and the origin of the oocyte (Webb et al., Reference Webb, Garnsworthy, Campbell and Hunter2007). In this light, the aim of this study was to determine the effect of two FSH protocols for ovarian stimulation in goats on the expression pattern of EGFR in goat COCs. After morphologically grading COCs, oocytes were stripped from cumulus cells, with both cell types analysed by quantitative real-time RT-PCR (qRT-PCR). Comparisons of expression profiles were performed prior to and after in vitro maturation (IVM) on a FSH protocol basis.
Materials and Methods
Animals and bioethics
Cyclic Canindé goats (mean body weight ± SEM, 32.9 ± 0.5 kg) were selected as oocyte donors. Animals were maintained in a semi-intensive system, receiving Tifton hay (Cynodon dactylon) in pens and having daily access to Tifton pasture. In addition, goats were supplemented with concentrate (20% crude protein), having free access to water and mineral salt. All procedures were performed in accordance with the guidelines of animal care, according to Van Zutphen & Balls (Reference Van Zutphen and Balls1997).
Estrus synchronization and ovarian superstimulation
The estrous cycle of goats was synchronized using intravaginal sponges impregnated with 60 mg medroxyprogesterone acetate (Progespon, Syntex) inserted for 11 days, along with a luteolytic injection of 50 μg cloprostenol (Ciosin, Coopers) in the eighth day of treatment. The ovarian stimulation was carried out using a total dose of 120 mg NIH-FSH-P1 (pFSH, Folltropin-V, Vetrepharm), in either one of the following protocols: (a) five-dose treatment, by the i.m. administration of five pFSH doses (30/30; 20/20; 20 mg) at 12 h intervals (n = 18 animals); or (b) three-dose treatment, by the i.m. administration of three pFSH doses (60; 40; 20 mg) at 24 h intervals (n = 17 animals). In both groups, the pFSH injections started at the eighth day of the progestin treatment. Both FSH stimulation protocols were performed in three sessions, with the use of five to six different animals per session per protocol.
Laparoscopic oocyte recovery (LOR)
Ovarian follicles were punctured just after the sponge removal using LOR procedures, as previously described by Baldassarre et al. (Reference Baldassarre, Keefer, Wang, Lazaris and Karatzas2003a). Briefly, goats were deprived of food for 36 h and of water 24 h prior to laparoscopy. Anesthesia was induced with intramuscular administration of 0.5 mg/10 kg body weight of 2% xylazin (Coopazine) and 25 mg/10 kg body weight of 10% ketamine (Ketamine). Oocytes were aspirated from all follicles >2 mm in diameter, visible on the surface of the ovaries, using a 22-gauge needle and a vacuum pump (Watanabe) set to –30 mmHg pressure. The aspiration medium consisted of TCM199 with Earle's salt, sodium bicarbonate and l-glutamine (Nutricell) supplemented with 10 mm HEPES, 20 IU/ml heparin and 40 μg/ml gentamicin sulfate (Sigma-Aldrich).
Oocyte grading and sampling
COCs from each stimulation protocol were isolated from the follicular contents and graded from GI to GIV based on cellular vestments and cytoplasmic uniformity, as follows: GI: multilayered compact cumulus cells and finely granulated oocyte cytoplasm; GII: one to three layers of cumulus cells and finely granulated oocyte cytoplasm; GIII: incomplete or no cellular vestment or heterogeneous oocyte cytoplasm; and GIV: oocyte with abnormal shape and heterogeneous oocyte cytoplasm or apoptotic oocytes in jelly-like cumulus-corona cells vestment.
Samples of pooled immature GI and GII COCs, and most immature GIII COCs were collected for further qRT-PCR analyses. In brief, COCs from each stimulation protocol session (three sessions per protocol) were washed four times in TCM199 with gentamicin sulphate, cumulus cells were carefully removed by repeated pipetting, and groups of 10 resulting denuded oocytes or cumulus cells from 10 denuded COCs were pooled in individual tubes, which were quickly spun and snap-frozen to be stored at –80 °C until RNA extraction. Denuded GIII and all GIV COCs were discarded.
IVM and assessment of oocyte maturation
Only GI and GII COCs were selected for IVM. Groups of pooled GI/GII COCs, per stimulation protocol, were washed four times and in vitro-matured for 24 h, at 38.5 °C and 5% CO2 in humidified air, in IVM medium consisted of TCM199 with Earle's salt, sodium bicarbonate, and l-glutamine (Nutricell) as a base medium, supplemented with 10 ng/ml EGF, 100 μM cysteamine and 40 μg/ml gentamicin sulphate (Sigma-Aldrich). Following IVM, COCs were visualized under an inverted microscope (TE2000, Nikon) and cumulus cells were carefully removed by repeated pipetting. Denuded oocytes were assessed for nuclear maturation by polar body screening, with oocytes with a clear first polar body considered matured (MII), whereas oocytes with no visible polar bodies were classified as non-competent (NC). Then, for each FSH protocol and stimulation session, and similar to sampling of immature oocytes, groups of 10 resulting denuded MII or NC oocytes or cumulus cells from 10 denuded COCs (from both MII and NC COCs, as cumulus cell removal was prior to oocyte screening) were pooled in individual tubes, quickly spun and stored at –80 °C until RNA extraction (post-IVM sampling groups). Immature GI/GII COCs were used as maturation controls (pre-IVM).
Total RNA extraction
Total RNA was prepared from pooled oocytes or cumulus cells obtained from pre-IVM (GI/GII and GIII immature COCs) and post-IVM (GI and GII MII or NC COCs) sampling groups using the RNeasy micro kit (Qiagen Inc.) according to the manufacturer's instructions. Briefly, 75 μl lysis buffer was added to each frozen sample and the lysate was diluted 1:1 with 70% ethanol and transferred to a spin column. Genomic DNA was degraded using RNase-free DNase for 15 min at room temperature. After three washes, the RNA was eluted with 12 μl RNase-free water.
Reverse transcription
Prior to reverse transcription, RNA samples from each cell type replicate and 20 μM oligo-dT primer (Promega) were heated to 70 °C for 5 min, to disrupt possible secondary structures, and then snap-cooled on ice. Thereafter, 1 μl of Improm II (Promega) in reverse transcription buffer, were combined with 0.5 mm of each dNTP (Promega), 2 U/μl of RNaseOUT (Invitrogen), and RNase-free water to make a final reaction volume of 20 μl. Reverse transcription was performed at 42 °C for 60 min, followed by 70 °C for 15 min. The first strand cDNA products were then stored at –20 °C for later use as template for qRT-PCR. Negative controls or RT blanks were prepared under the same conditions, but without inclusion of reverse transcriptase.
Quantitative real-time polymerase chain reaction
The PCR amplifications were performed in a MasterCycler EP Realplex4 S (Eppendorf). The three cDNA replicates from each cell type (oocytes or cumulus cells) were pooled prior to the PCR experiments, which were run in triplicates for EGFR and GAPDH genes, for each cell type. Each reaction consisted of 20 μl total volume containing 10 μl 2 × FastStart Universal SYBR Green Master (Roche), 0.2 μM of each primer (Table 1) and 1 μl cDNA. The PCR protocol comprehended an initial incubation at 95 °C for 10 min, followed by 40 cycles of an amplification program of 95 °C for 15 s, 55 °C for 15 s and 60 °C for 30 s. Fluorescence data was acquired during the 72 °C extension steps. To determine the linearity (R2) and the efficiency (E) of the PCR amplifications, standard curves were generated for each gene using serial dilutions of a cDNA preparation from ten immature COCs, with all other conditions being identical. Specificity of each reaction was ascertained after completion of the amplification protocol. This was achieved by performing the melting procedure (55–95 °C, starting fluorescence acquisition at 55 °C and taking measurements at 10 s intervals until the temperature reached 95 °C). As negative controls, samples with RNA but without reverse transcriptase were used. The sizes of the PCR products were further confirmed by gel electrophoresis on a standard ethidium bromide-stained 2% agarose gel and visualized by exposure to UV light.
Oligonucleotides used for quantitative real-time polymerase chain reaction analysis of gene expression in goat oocytes and cumulus cells.

Data and statistical analysis
The effect of hormonal treatment on mean number of COCs recovered per animal was determined using the t-test for non-paired samples, at a significance level of 5%. The percentage of graded COCs and maturation rates were analysed using the Fisher's exact test. Analysis was carried out with GraphPad InStat 3.06 software (GraphPad Software, Inc.) for Windows. The relative quantification of the expression of gene was performed using the 2−ΔΔCt method (Livak & Schmittgen, Reference Livak and Schmittgen2001). Target gene expression was normalized against GAPDH transcript levels (Goossens et al., Reference Goossens, Van Poucke, Van Soom, Vandesompele, Van Zeveren and Peelman2005). Threshold and Ct (threshold cycle) values were automatically determined by Realplex 2.2 software (Eppendorf), using default parameters. The Ct and Tm (melting temperature) data were expressed as mean ± SD of three or more measurements and were compared using one-way ANOVA followed by Tukey-Kramer multiple comparison test, and were determined to be significant when p < 0.05 or p < 0.01. The corresponding real-time PCR efficiencies were calculated from the given slopes (S) of the standard curves, according to the equation: E = 10(−1/S) – 1. Linearity was expressed as the square of the Pearson correlation coefficient (R2).
Results
Validation of qRT-PCR analyses
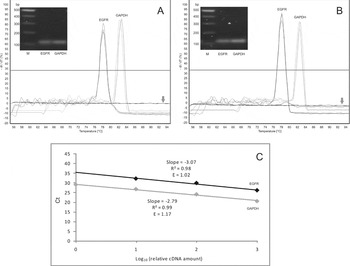
To validate our PCR conditions, standard curves prepared with serial dilutions of COC cDNAs were plotted for EGFR and GAPDH (Fig. 1). These experiments give valuable information about the range of template concentrations that yields similar amplification efficiency. In our analyses, the amplification reactions for EGFR and for GAPDH presented high linearity (R2 ≥ 0.98) and efficiency (E) close to 1 (Fig. 1C). These results indicate that differentially expressed mRNA species can be analysed within the same PCR run, as long as the template concentrations fall within the linear range (Dussault & Pouliot, Reference Dussault and Pouliot2006).
Specificity, linearity and efficacy of EGFR and GAPDH qRT-PCR amplifications in oocytes and cumulus cells. Derivative melting curves of EGFR and GAPDH amplicons in oocytes (A) and cumulus cells (B). Negative controls (arrows) were constituted of mRNA templates without reverse transcriptase. The inserts in panels (A) and (B) show the electrophoretic analysis of the products. M: 100 bp DNA ladder. Standard curves for EGFR (upper line) and GAPDH (lower line) amplifications in cumulus–oocyte complexes (COCs) (C). The curve slopes, efficiency values (E) and square of Pearson correlation coefficients (R2) were plotted.

The expression of EGFR was quantitatively analysed in COCs cells. Transcripts for EGFR were detected in both, cumulus cells and in oocytes (Fig. 1). The amplicons produced by qRT-PCR presented a melting temperature (mean ± SD) of 77.8 °C ± 0.2 (EGFR) and 82.5 °C ± 0.3 (GAPDH) in oocytes (Fig. 1A), and 77.7 °C ± 0.2 (EGFR) and 82.4 °C ± 0.4 (GAPDH) in cumulus cells (Fig. 1B). The electrophoresis in agarose gel from the products obtained showed an amplicon of approximately 130 bp for both genes and cells analysed. No amplification was observed for the samples with no reverse transcriptase enzyme (negative controls).
In vivo FSH treatment and IVM
In this work, quantitative and qualitative aspects of goats COCs produced by two distinct hormonal treatments for ovarian stimulation were compared (Table 2). Therefore, the number of COC structures retrieved from each animal, and the percentage of GI, GII and GIII structures did not differ statistically between the five-dose and the three-dose FSH treatment groups. On the other hand, the maturation rate for the three-dose treatment group was significantly lower (p < 0.05) than the five-dose ovarian stimulation treatment.
Cumulus–oocyte complexes (COCs) recovered from goats after five-dose or three-dose hormonal treatments for ovarian stimulation.

aProportion of GI/GII-only COCs, as GIII COCs were not submitted to in vitro maturation (IVM).
b ,c Numbers in the same column with distinct superscripts differ significantly (p < 0.05).
In vivo FSH treatment and expression pattern in graded COCs
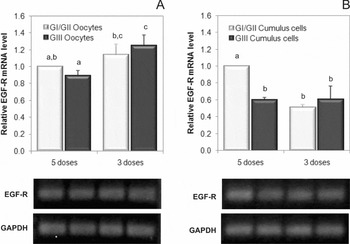
The quantification of EGFR mRNA abundance in structures that were not submitted to IVM (immature COCs), previously classified as GI/GII and GIII (Fig. 2), demonstrated that the five-dose hormonal treatment produced GI and II COCs with high number of transcripts for EGFR in cumulus cells (p < 0.001) than in GIII structures (Fig. 2B). However, such difference was not seen between oocytes (Fig. 2A). On the other hand, the three-dose treatment produced GI/GII and GIII COCs with similar expression levels for EGFR in oocytes (Fig. 2A) or in cumulus cells (Fig. 2B).
Real-time qRT-PCR analysis of EGFR expression in goat (A) oocytes and (B) cumulus cells from graded cumulus–oocyte complexes (COCs) obtained from the five-dose or three-dose FSH treatment groups for ovarian stimulation. Shown are the fold differences in mRNA expression after normalization to the internal standard (GAPDH). The mRNA levels in GI/GII oocytes and cumulus cells, both for the five-dose FSH treatment, were arbitrarily set to one-fold for oocyte and cumulus cells groups, respectively. Lower panels in A and B show the electrophoretic analysis of the EGFR and GAPDH amplicons. Histograms with columns with distinct superscripts differ, for p < 0.05 in (A) and p < 0.01 in (B).

In vivo FSH treatment and expression pattern in pre and post-IVM COCs
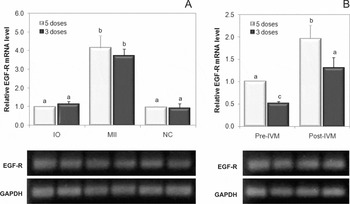
We also observed that the five-dose FSH treatment produced COCs, either prior to or after IVM, with higher levels of EGFR transcripts in cumulus cells (Fig. 2B, p < 0.01 and Fig. 3B, p < 0.05) when compared with the three-dose FSH treatment. However, similar to what was seen for immature graded oocytes, no differences were observed in oocytes (Figs. 2A and 3A).
Real-time qRT-PCR analysis of EGFR expression in goat (A) oocytes and (B) cumulus cells from pre and post-in vitro maturation (IVM) cumulus–oocyte complexes (COCs) obtained from the five-dose or three-dose FSH treatment groups for ovarian stimulation. Shown are the fold differences in mRNA expression in the immature (OI), mature (MII) and non-competent (NC) oocytes, and in cumulus cells from pre- and post-IVM COCs, after normalization to the internal standard (GAPDH). The mRNA levels in OI and pre-IVM cumulus cells, both for the five-dose treatment, were arbitrarily set to one-fold for oocyte and cumulus cells groups, respectively. Lower panels in (A) and (B) show the electrophoretic analysis of the EGFR and GAPDH amplicons. Histograms with columns with distinct superscripts differ, for p < 0.001 in (A) and p < 0.05 in (B).

Expression patterns in pre and post-IVM COCs
The expression levels of EGFR in GI/GII COCs prior to and following IVM were also quantified, irrespective of the hormonal treatment. Thus, transcription levels for EGFR were significantly higher in MII oocytes (p<0.001, Fig. 3A) and in post-IVM cumulus cells (p < 0.05, Fig. 3B) than in pre-IVM oocytes (IO) and in cumulus cells, respectively. Conversely, for both treatments, EGFR expression levels in NC oocytes were statistically lower (p < 0.001) than MII oocytes, but not from immature oocytes (IO).
Discussion
The in vitro production of embryos involves three main steps: maturation of primary oocytes collected from antral follicles, fertilization of matured secondary oocytes and culture of presumable embryos to the blastocyst stage, which can be transferred to recipients or frozen for future use (Cognié et al., Reference Cognié, Baril, Poulin and Mermillod2003). In this process, obtaining high-quality oocytes is of key importance. To obtain high-quality oocytes, LOR has been widely used in goats (Baldassarre et al., Reference Baldassarre, Keefer, Wang, Lazaris and Karatzas2003a; Gibbons et al., Reference Gibbons, Bonnet, Cueto, Catala, Salamone and Gonzalez-Bulnes2007). Hormonal treatments for ovarian stimulation have been used prior to laparoscopic recovery to increase the number of puncturable follicles (Pierson et al., Reference Pierson, Wang, Neveu, Sneek, Cote, Karatzas and Baldassarre2004).
Previous studies showed that gonadotrophins are critical for follicular growth, and FSH, being the key hormone, results in growth and development of follicles with 2.5 mm or bigger in diameter (Evans, Reference Evans2003). In the present work, we evaluated COCs recovered by laparoscopy in goats treated for ovarian stimulation with 120 mg pFSH administered in five or in three doses. Even though the two distinct hormonal treatments provided equivalent numbers of COCs per animal and the same proportion of GI/GII structures, oocyte maturation rate was significantly higher in the five-dose group. Such findings indicated a lower meiotic competence for GI/GII COCs when obtained from the three-dose FSH treatment. Interestingly, the assessment of the COC morphology prior to IVM was not a good predictor of oocyte meiotic competence. This suggests that improvements in the grading system to predict oocyte competence, using morphological criteria, are still a need.
Several pieces of evidence have suggested that the investigation of molecular markers using highly sensitive techniques, such as microarray and real-time PCR, is a promising approach for studies in COC gene expression for a better inference of oocyte competence to development (Wrenzycki et al., Reference Wrenzycki, Herrmann and Niemann2007; Assidi et al., Reference Assidi, Dufort, Ali, Hamel, Algriany, Dielemann and Sirard2008). Here, we applied real-time qPCR to investigate possible correlations between EGFR expression levels in cumulus cells and in oocytes with the quality of recovered COCs structures obtained from two FSH protocols for ovarian stimulation in goats. Based on the expression profiles, our results indicated the occurrence of significant differences in EGFR mRNA relative abundance in cumulus cells, but not in oocytes, depending on the FSH treatment protocol (three- vs. five-dose groups), COC morphological grading (GI/GII vs. GIII COCs), and maturation status (pre- vs. post-IVM COCs).
Regarding the comparisons between hormonal protocols, the treatment with five injections of FSH produced GI/GII COCs (used for IVM) with higher levels of EGFR expression in cumulus cells when compared with the three-dose FSH treatment. Moreover, the latter treatment generated GI/GII structures with EGFR levels as low as in GIII structures (not selected for IVM) from both hormonal treatments. These results were associated with a higher maturation rate for structures in the five-dose treatment relative to the three-dose group, also indicating that EGFR expression in cumulus cells may be positively correlated with oocyte meiotic competence in goat COCs. Even if the final total dose of FSH was the same between groups, the number and/or intervals of injected doses affected the levels of EGFR expression in cumulus cells.
It is known that successful FSH treatments for ovarian stimulation usually require multiple doses, which is primarily due to the shorter in vivo FSH half-life (Monniaux et al., Reference Monniaux, Chupin and Saumande1983). Studies have reported the important effect of gonadotrophins on the EGF network mediating the follicular growth (Zhang et al., Reference Zhang, Ouyang and Xia2009; Van Den Hurk & Zhao, Reference Van Den Hurk and Zhao2005). In fact, studies demonstrated that the EGFR expression increases with progression of folliculogenesis due to gonadotrophin stimulation, reaching its maximum at the preovulatory stage (Choi et al., Reference Choi, Choi, Auersperg and Leung2005). Consequently, it is possible that the three-dose injection protocol used in this study failed to supply adequate levels of FSH during follicular development, resulting in GI/GII COCs with lower oocyte meiotic competence (expressed in terms of lower maturation rate) and with reduced EGFR expression levels in its surrounding cumulus cells.
Oocyte competence was suggested to occur mainly due to the molecular memory acquired during maturation by the oocyte and the supportive somatic cells (Sirard et al., Reference Sirard, Dufort, Coenen, Tremblay, Massicotte and Robert2003). In addition, the presence of cumulus cells (Hashimoto et al., Reference Hashimoto, Saeki, Nagao, Minami, Yamada and Utsumi1998) and the maintenance of functional coupling between the oocyte and its surrounding cumulus by gap junctions are both necessary to the oocyte competence acquisition process (Atef et al., Reference Atef, François, Christian and Marc-Andre2005). Therefore, competent oocytes also appear to influence the pattern of expression of a set of biochemical markers in the cumulus that might be crucial to achieve maturation (Assidi et al., Reference Assidi, Dufort, Ali, Hamel, Algriany, Dielemann and Sirard2008).
Despite the apparent sufficient supply of FSH used in the five-dose treatment, a lower EGFR expression in the cumulus cells of GIII COCs would be expected when compared with GI/GII COCs. Given the key role of the cumulus–oocyte communications in the follicular growth (Van Den Hurk & Zhao, Reference Van Den Hurk and Zhao2005), we hypothesized that the very low or even nil number of cumulus cells surrounding the oocyte of GIII COCs significantly reduced the in vivo up regulation of EGFR in cumulus cells mediated by FSH.
Differences in the levels of EGFR expression in GI/GII goat COCs between the FSH treatments were restricted to the cumulus cells, with no differences being detected in the oocytes. Despite several investigations of potential marker genes for oocyte developmental competence has been performed in the own oocyte (Wrenzycki et al., Reference Wrenzycki, Herrmann and Niemann2007), studies with cumulus cells are emergent. In effect, the potential of analysing cumulus cell gene expression as a marker for oocyte quality, more than the oocyte itself, is being increasingly recognized (Feuerstein et al., Reference Feuerstein, Cadoret, Dalbies-Tran, Guerif, Bidault and Royere2007). Thus, Assidi et al. (Reference Assidi, Dufort, Ali, Hamel, Algriany, Dielemann and Sirard2008) proposed, that EGFR, among others genes, is a potential candidate to predict bovine oocyte competence. Furthermore, given the absence of FSH receptor on the oocyte, the EGFR expression in cumulus cells may provide more relevant biological information than transcripts from the oocyte per se, particularly concerning in vivo hormonal treatments. In fact, Assidi et al. (Reference Assidi, Dufort, Ali, Hamel, Algriany, Dielemann and Sirard2008) also used bovine cumulus cells for gene expression analysis to access in vivo responses to FSH stimulation. In the same way, we propose that EGFR may indeed be a good candidate marker for indirect prediction of goat oocyte quality.
In the present investigation, we also demonstrated the presence of EGFR transcripts in oocytes and in cumulus cells both prior and after IVM. This is in agreement with data obtained in goats in which EGFR transcripts, assessed by RT-PCR, and EGFR protein, detected using immunochemistry and western blot analyses, have been reported in follicular cells (granulosa and cumulus) and in oocytes (Gall et al., Reference Gall, Chene, Dahirel, Ruffini and Boulesteix2004). Additionally, reports have already shown the presence of EGFR in follicular cells (mouse, Hill et al., Reference Hill, Hammar, Smith and Gross1999; cattle, Lonergan et al., Reference Lonergan, Carolan, Langendonckt, Donnay, Khatir and Mermillod1996; human, Qu et al., Reference Qu, Nisolle and Donnez2000; pig, Singh et al., Reference Singh, Rutledge and Armstrong1995; rat, Chabot et al., Reference Chabot, St-Arnaud, Walker and Pelletier1986; hamster: Garnett et al., Reference Garnett, Wang and Roy2002) and in oocytes (mouse, Willey et al., Reference Wiley, Wu, Harari and Adamson1992; human, Chia et al., Reference Chia, Winston and Handyside1995; pig, Singh et al., Reference Singh, Rutledge and Armstrong1995; and hamster, Garnett et al., Reference Garnett, Wang and Roy2002) of several mammalian species.
It is clear that EGFs can influence maturation, having positive effects during the IVM process in a variety of species, including cattle (Lonergan et al., Reference Lonergan, Carolan, Langendonckt, Donnay, Khatir and Mermillod1996), humans (Das et al., Reference Das, Stout, Hensleigh, Tagatz, Phipps and Leung1991), and rodents (Das et al., Reference Das, Stout, Hensleigh, Tagatz, Phipps and Leung1991). Even though the mechanism whereby EGFs exert their effects on COC maturation has not been completely elucidated yet, cumulus cells are considered the major site of action for these factors, indirectly modulating oocyte maturation.
Here, we have shown that IVM was associated with a significant increase in EGFR expression in goat oocytes and cumulus cells in both in vivo FSH protocols used for ovarian stimulation. Following IVM, MII oocytes had nearly a four-fold increase in EGFR mRNA relative abundance in comparison with immature oocytes, with cumulus cells doubling the EGFR expression after IVM. This finding suggests that, in goats, EGFs could exert their targeting effects independently, at least in part, directly on cumulus cells and on the oocyte itself through EGFR intrinsically expressed in each cell type. This possibility is supported by findings in cattle (Lonergan et al., Reference Lonergan, Carolan, Langendonckt, Donnay, Khatir and Mermillod1996) and in the mouse (Das et al., Reference Das, Stout, Hensleigh, Tagatz, Phipps and Leung1991), in which EGF was shown to act directly on denuded oocytes and on COCs. Interestingly, EGFR expression was previously detected in the goat oocyte, but the receptor protein was likely immature, as it was proven unable to be phosphorylated (Gall et al., Reference Gall, Boulesteix, Ruffini and Germain2005). Our data indicated a possible upregulation in EGFR expression in cumulus cells and also in the oocytes during IVM, suggesting a potential physiological role during development. Moreover, NC oocytes, i.e. oocytes that failed to complete meiotic nuclear maturation, displayed similar EGFR expression pattern to immature oocytes. Then, we speculate that EGFR upregulation in oocytes is associated with the in vitro ability to resume meiosis, as also suggested by results from Gall et al. (Reference Gall, Chene, Dahirel, Ruffini and Boulesteix2004), which demonstrated an association between the increase in EGFR relative abundance and oocyte ability to resume and complete meiosis during goat follicular growth.
Altogether, data from the present study corroborate the importance of EGFR expression in cumulus cells and point to a putative direct action of EGFR in goat oocytes during IVM. Even though some biochemical mechanisms of EGF actions in goat cumulus cells (Gall et al., Reference Gall, Boulesteix, Ruffini and Germain2005) and oocytes (Dedieu et al., Reference Dedieu, Gall, Crozet, Sevellec and Ruffini1996) during the IVM process have already been described, the EGFR signalling in oocytes still remains poorly understood. Further studies are still necessary to address several issues in signal transduction events taking place in COCs during the IVM process in goat cumulus cells and oocytes.
In summary, the use of a protocol for ovarian stimulation in goats with higher number of pFSH injections at a shorter interval resulted in COCs with a higher level of EGFR expression in cumulus cells, but not in the oocyte, which appeared to be correlated with an elevated oocyte meiotic competence following IVM. The morphological grading of COCs prior to IVM was not a good predictor of oocyte meiotic competence, since it could not to assess the intrinsic quality of COCs. Therefore, EGFR may be a good indirect candidate marker for goat oocyte quality. Additionally, the investigation of gene expression in cumulus cells instead of in the oocyte, represent a valid alternative in the selection of competent oocytes for IVM. Finally, the IVM process of goat COCs increased the EGFR expression in oocytes and cumulus cells, which seemed to be strongly correlated with the resumption of meiosis. Cause-and-effect relationships between such increased expression levels in the oocyte and oocyte competence itself still need to be further investigated.
Acknowledgements
The authors are thankful for the financial support received from FINEP, CNPq, and PNPD/CAPES (Brazil). V.J.F. Freitas and M. Bertolini are senior investigators of CNPq.