1. Introduction
Protein chemistry has undergone dramatic changes during the past 65 years. These changes have been documented on several successive occasions by Scheraga (Reference Scheraga1961, Reference Scheraga, Engstrom and Strandberg1969a, Reference Scheragab), Poland & Scheraga, (Reference Poland and Scheraga1970), Anfinsen & Scheraga, (Reference Anfinsen and Scheraga1975), Némethy & Scheraga, (Reference Némethy and Scheraga1977), and Scheraga (Reference Scheraga1971, Reference Scheraga1979, Reference Scheraga1984, Reference Scheraga2011a and Reference Scheraga and Liwo2013). The evolution of these changes is summarized in this review. My research program evolved over the years, ultimately with the need to understand the mechanism of protein folding and the application of the folded structure to biological problems. To achieve this goal, I began an experimental hydrodynamic study, accompanied by theory, to determine the size and shape of a protein (Section 2). This led to the interpretation of the role of rotational diffusion coefficients for analysis of nuclear magnetic resonance (NMR) spectra of proteins, and also contributed to my blood-clotting study (Section 3). To gain a knowledge of the dynamics and thermodynamics of protein structure and protein folding, I investigated the interatomic interactions that stabilize protein structure in aqueous solution, including side chain–side chain hydrogen bonds (Section 4), hydrophobic interactions (Section 5) and the interplay between them (Section 6). Our work on the helix–coil transition was focused on homopolymers of amino acids (Section 7) and was extended to the thermodynamic properties of host–guest random copolymers to obtain the helix-forming tendency of the 20 naturally occurring amino acids (Section 8). At the same time, our experimental studies of bovine pancreatic ribonuclease A (RNase A) in Sections 9–11 focused our attention on ultimately developing a theoretical treatment (Section 12) to determine protein structure and protein folding based on these experimental results. This treatment later evolved into the Emperical Conformational Energy Program for Peptides (ECEPP) all-atom force field (Section 13). With the success of ECEPP for small polypeptide systems (Section 14) and the realization that an all-atom force field is too-computationally demanding, a coarse-grained UNited RESidue (UNRES), force field was developed (Section 15) and its capability to study large protein systems was demonstrated (Sections 15 and 16). To enhance the efficiency of UNRES to predict protein structure, a homology-modeling procedure, based on the physical properties of the 20 naturally occurring amino acids (Section 17), was introduced (Section 18). With UNRES, it is possible to compute not only protein structure and protein-folding pathways, but also kinetics of protein folding (Section 19). To further enhance the molecular dynamics facility of UNRES, a multiplexed – replica exchange procedure was adopted (Section 20), and UNRES was used to treat biological problems (Section 21). In addition, a new point of view was introduced to demonstrate how strong and weak forces combine together to give rise to a particular type of protein dynamics (Section 22). Finally, with the further goal to also treat nucleic acids, we successfully implemented the UNRES philosophy to create a Nucleic Acid UNited RESidue 2–Point model (NARES–2P), a coarse-grained model of DNA (Section 23), and are now developing a unified coarse-grained model to simulate protein–DNA interactions (Section 24).
2. Hydrodynamic theory to determine protein size and shape
In 1946, other than that a protein contained peptide-bond-linked amino acids, proteins were thought of as colloidal particles. Essentially the only structural property of a protein that could be determined was its size and shape using hydrodynamic methods. In 1946–1947, I was an American Chemical Society postdoctoral fellow with John T. Edsall in the Physical Chemistry Department of Harvard Medical School. In 1946, James Sumner shared the Nobel Prize in Chemistry for demonstrating that an enzyme is a large protein molecule (Sumner, Reference Sumner1933; Sumner et al. Reference Sumner, Gralén and Eriksson-Quensel1938). My first experimental experience with proteins in 1946 involved learning how to fractionate blood plasma proteins, and use flow birefringence to determine the dimensions of an ellipsoidal model for a particular plasma protein then-known as cold-insoluble globulin (Edsall et al. Reference Edsall, Gilbert and Scheraga1955). This was followed by theoretical work to obtain this information from rotational diffusion coefficients of ellipsoidal molecules from flow birefringence (Scheraga et al. Reference Scheraga, Edsall and Gadd1951), and subsequently, from non-Newtonian viscosity (Scheraga, Reference Scheraga1955) experiments.
2.1 Experimental study of flow birefringence
Flow birefringence is induced double refraction in a solution containing asymmetrical particles confined between two concentric cylinders, one of which can be made to rotate at a defined speed (a so-called Couette apparatus), establishing a velocity gradient G between the two cylinders. At zero speed, the particles are in random orientation and no light can pass through the solution when it is situated between crossed Nicol prisms. But if one of the cylinders is allowed to rotate, the particles begin to orient along the stream lines of the fluid, with the orientation increasing with increasing speed of the moving cylinder, and the solution exhibits double refraction. An equilibrium is established between the tendency of the hydrodynamic force to orient the particles and the Brownian motion which tends to disorient them. The establishment of the equilibrium orientation distribution function F at a given time t, and angular velocity ω of the rotating cylinder, is given by the differential equation  $\partial F/\partial t=\Theta\Delta F -div(F \omega)$ where Θ is the rotational diffusion coefficient of the dissolved particles and Δ is the Laplacian operator. Solution of this equation gives F as a function of α and R, where α = G/Θ and R is a function of the axial ratio of the dissolved particles taken as an ellipsoid of revolution. The rotational diffusion coefficient also plays a role in the analysis of NMR spectra of proteins.
With the distribution function F, it is possible to calculate the effect of the interaction of the oriented system with a beam of linearly polarized light, i.e., the double refraction (Scheraga et al. Reference Scheraga, Edsall and Gadd1951). Alternatively, combination of F with the total energy dissipation per unit time per unit volume (arising from both the hydrodynamic orientation and the Brownian motion) gives the intrinsic viscosity, [η]. In non-Newtonian viscosity, [η] depends on G (Scheraga, Reference Scheraga1955). Both flow birefringence and non-Newtonian viscosity ultimately provide values of α, hence of Θ for various values of R.
2.2 Numerical evaluation of size and shape
With the aid of the Mark I computer at the Harvard Computational laboratory (my first use of a computer), numerical solutions of the above differential equation were provided for the orientation distribution function F (Scheraga et al. Reference Scheraga, Edsall and Gadd1951) which was then available to interpret data from both flow birefringence and non-Newtonian viscosity experiments in terms of the lengths of asymmetrical molecules. Flow birefringence experiments were applied to a variety of rigid and flexible macromolecules (Cerf & Scheraga, Reference Cerf and Scheraga1952; Scheraga & Backus, Reference Scheraga and Backus1951), and to complex reacting systems of macromolecules (Backus et al. Reference Backus, Laskowski, Scheraga and Nims1952).
2.3 Flexible chain molecules
In the 1940s and 1950s much activity was carried out to try to understand the kinetics of polymerization to form synthetic polymers and the frictional properties of these polymers in solution. In that period, I participated in an experimental investigation of the sedimentation and viscosity behavior of fractions of polyisobutylene in cyclohexane (Mandelkern et al. Reference Mandelkern, Krigbaum, Scheraga and Flory1952) to test three existing theoretical treatments, all in the Cornell Chemistry Department, of the frictional properties of flexible chain molecules in solution, viz., those of Kirkwood & Riseman (Reference Kirkwood and Riseman1948), Debye & Bueche (Reference Debye and Bueche1948), and Flory & Fox (Reference Flory and Fox1951). Only the Flory–Fox theory accounted for the experimental data in a satisfactory manner; neither the Kirkwood–Risemen, nor the Debye–Bueche theories succeeded in doing so.
2.4 Scheraga–Mandelkern equation
Although proteins were still regarded as colloidal particles, Scheraga & Mandelkern (Reference Scheraga and Mandelkern1953), influenced by the Flory–Fox theory, formulated a general treatment of a variety of hydrodynamic properties of solutions of partially rigid proteins and applied it to determine their size and shape. The theory required data from two independent hydrodynamic experiments, e.g., sedimentation velocity, s, to obtain frictional coefficients, and intrinsic viscosity [η], ultimately to determine the dimensions of dissolved protein molecules, assumed to have a rotational–ellipsoidal shape. The calculations were based on the equations:
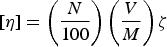 $$[\eta ]=\left( \displaystyle{{N} \over {100}}\right)\left(\displaystyle{{V} \over {M}}\right)\zeta $$
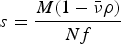 $$s=\displaystyle{{M(1 - \bar \nu \rho)} \over {Nf}} $$
 $$f=\displaystyle{{(162\pi^2)^{1/3}V^{1/3} \eta _0} \over {F}}$$
which, by elimination of V from equations 1a and 1c, leads to the following Scheraga–Mandelkern equation:
 $$\beta (\,p) = \displaystyle{{Ns[\eta ]^{1/3} \eta _0} \over {M^{2/3} \; \; (1 - \bar \nu \rho )}} = \gamma F\zeta ^{{\rm 1}/{\rm 3}}, $$
where N is Avogadro's number, M is the (known) molecular weight from, e.g., sedimentation equilibrium or light scattering, η 0 is the viscosity of the solvent,  $\bar v$ is the partial specific volume of the unhydrated protein molecule at infinite dilution, ρ is the density of the solution, f is a frictional coefficient, and γ=N 1/3/(16200π2)1/3. Since F and ζ, and hence β(p), are known hydrodynamic functions of the axial ratio p, Eq. (2) provides a value of p = a/b, where a and b are the semi-axes of the ellipsoidal molecule.
With this value of p and equation (1a) for the intrinsic viscosity, with the volume of the solute molecule, V, being a function of a and b, and ζ(p) and F(p) having been related to p by β(p) of Eq. (2), it is possible to compute a and b, i.e., the dimensions of the solute protein molecule.
In addition, this method was applied to another plasma protein, fibrinogen, which is a rod-like molecule with a molecular weight of 400 000 and a length of ~475 Å. With the Scheraga–Mandelkern treatment, the axial ratio of fibrinogen was found to be 5:1 as shown in Fig. 1, compared with the earlier reported value of 20:1 by J. L. Oncley, cited by Edsall (Reference Edsall1949). The fibrinogen molecule was later found by electron microscopy to be composed of three domains (Hall, Reference Hall1956; Krakow et al. Reference Krakow, Endres, Siegel and Scheraga1972; Siegel et al. Reference Siegel, Mernan and Scheraga1953) along the rod-like arrangement (see Fig. 1). The functional properties of each of the three domains of fibrinogen were elucidated by immunoelectron microscopy (Telford et al. Reference Telford, Nagy, Hatcher and Scheraga1980). Fibrinogen is a disulfide-linked dimer molecule, each monomer of which contains three chains, Aα, Bβ and γ. It appears that the central-domain nodule contains the N-terminal portions of each of these three chains, and that residues 240–424 of the Aα chains are located in each of the outer nodules (Telford et al. Reference Telford, Nagy, Hatcher and Scheraga1980).
Left side: – Scheraga – Mandelkern equation and early and refined proposals (20 and 5, respectively) for the axial ratio of fibrinogen and its dimensions from hydrodynamic measurements. Right side: – Electron micrograph and the interpreted-dimensions of the fibrinogen molecule (Hall, Reference Hall1956). The electron micrograph confirms the dimensions of the fibrinogen molecule, deduced from the hydrodynamic measurements.

Equation (2) was also applied to investigate the size and shape of horse serum albumin at increasing concentrations of urea, using diffusion and intrinsic viscosity data of Neurath & Saum (Reference Neurath and Saum1939). These authors had used only one equation of the type of Eq. (1a) for intrinsic viscosity and one more equation for the diffusion coefficient, instead of combining the hydrodynamic data from the two equations, as proposed in Eq. (2), to obtain values of the axial ratio p. Neurath and Saum interpreted their results from each of the two separate equations (1a), and the analog of (1b) for diffusion, in terms of increasing asymmetry (from about 5:1–20:1) attributed to the uncoiling of polypeptide chains to form very asymmetrical rod-like particles accompanying increasing degrees of urea-induced denaturation. Our re-interpretation of their experimental data with Eq. (2) led to the conclusion that, in urea, the protein swelled with increasing volume and remained spherical throughout the increase of the urea concentrations. Subsequent experiments on this system in our laboratory showed that these solutions did not exhibit any flow birefringence, indicating that the molecules were indeed spherical at all urea concentrations, and that the change in the so-called size and shape of the protein, and the consequent hydrodynamic properties were due to an increase in V, rather than in axial ratio (p), as the urea concentration increased.
3. Blood clotting
At the same time, I began an experimental study of the mechanism of the thrombin-induced clotting of fibrinogen, summarized in a 2004 review (Scheraga, Reference Scheraga2004). Fibrinogen, shown in Fig. 1 as a rotational–ellipsoidal model, and prothrombin (a precursor of thrombin), are both present in blood plasma. When blood contacts a wound, a cascade of proteolytic degradations is initiated, leading from prothrombin to thrombin to carry out the clotting process to stop the bleeding. Thrombin is an enzyme with specific trypsin-like action. As shown in Section 2.4, the central-domain nodule of the three-nodule arrangement in fibrinogen contains the N-terminal portions of the Aα, Bβ and γ chains (Telford et al. Reference Telford, Nagy, Hatcher and Scheraga1980). This central nodule is the site of thrombin action. I started using thrombin as a reagent to activate fibrinogen to a polymerizable form, and then proceeded with experiments to determine the subsequent steps of this polymerization, and elucidated the functional groups and interactions that are involved in the polymerization processes.
3.1 Proteolytic action of thrombin on fibrinogen
To initiate the clotting process, thrombin hydrolyzes specific Arg–Gly peptide bonds from the central nodule, near the amino-terminal portions of the Aα and Bβ chains of fibrinogen, releasing small fibrinopeptides FpA and FpB, respectively, from these chains. As a result, a polymerization site is exposed in the central nodule, ready to interact with the pre-existing sites in the two outer nodules of fibrinogen. Thus, the remaining three-nodular fibrinogen molecule, devoid of FpA and FpB, functions as a monomeric form, termed fibrin monomer f (Andreatta et al. Reference Andreatta, Liem and Scheraga1971; Scheraga, Reference Scheraga2004; Scheraga & Laskowski, Reference Scheraga and Laskowski1957). This reaction may be represented as
 $$F\buildrel {T} \over \longrightarrow f + 2FpA + 2FpB,$$
where F is the fibrinogen and T is the thrombin (which functions only in this initial step). Subsequent evidence was accumulated that Eq. (3) is actually a reversible reaction (Laskowski et al. Reference Laskowski, Rakowitz and Scheraga1952; Scheraga, Reference Scheraga2004; Scheraga & Laskowski, Reference Scheraga and Laskowski1957), as represented below.
 $$F\mathrel{\mathop{\kern0pt\rightleftharpoons}\limits^T} f + 2FpA + 2FpB.$$
Equation (4) implies that a proteolytic enzyme such as thrombin can catalyze not only peptide-bond hydrolysis but also peptide-bond synthesis (see Section 4.2 and Scheraga, Reference Scheraga2004).
3.2 Polymerization of fibrin monomer
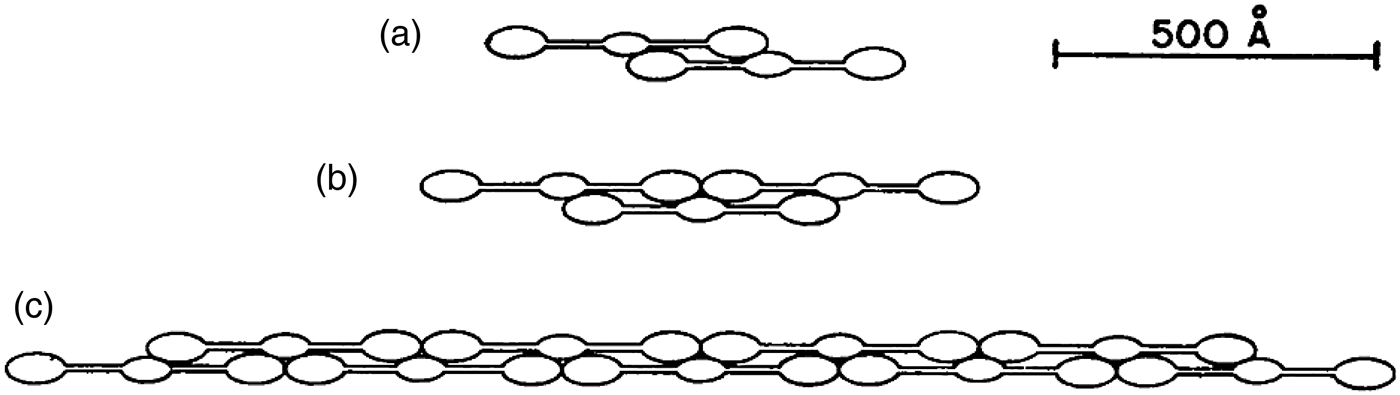
With the uncovering of a polymerization site by thrombin in the initial step, the new amino-termini of the Aα and Bβ chains, that remain in the central nodule of fibrinogen after thrombin cleavage, react in a reversible step with the C-terminal portions of the γ chains that are in each of the outer nodules of the fibrinogen molecule (Donnely et al. Reference Donnely, Laskowski, Notley and Scheraga1955; Scheraga & Backus, Reference Scheraga and Backus1952). As a result, double-stranded intermediate staggered–overlapped polymers, f n, illustrated in Figs 2 and 3 (Scheraga, Reference Scheraga2004), are formed, and undergo reversible association/dissociation, where n is an increasing number as polymerization proceeds.
 $$\displaystyle{nf \mathrel{\mathop{\kern0pt\rightleftharpoons}} f_n. }$$
Dimeric overlap of fibrin monomers at several stages of polymerization, based on hydrodynamic and light-scattering data. Note the triad of two terminal nodules with one central nodule, especially in part (c). (Donnely et al. Reference Donnely, Laskowski, Notley and Scheraga1955).
Electron micrographs of intermediate fibrin polymers, confirming the proposed structures in Fig. 2. (a) Fibrin dimer (left) and part of a higher intermediate polymer (right). (b) Fibrin tetramer (Krakow et al. Reference Krakow, Endres, Siegel and Scheraga1972).
Figure 2 illustrates the interaction of three nodules, two from the existing polymerization sites at the outer edges of the fibrinogen molecule, and a third (middle) nodule containing a polymerization site that is exposed in step 1 by the proteolytic action of thrombin.
Light-scattering (Donnely et al. Reference Donnely, Laskowski, Notley and Scheraga1955) and calorimetric (Sturtevant et al. Reference Sturtevant, Laskowski, Donnelly and Scheraga1955) measurements provided evidence that hydrogen bonds between ionizable side chains (accounting for the pH-dependence of reaction 5) are involved in the reversible formation of the various f n species, i.e., by protein–protein association. Further analysis of the light-scattering data provided the values of the weight-average degrees of polymerization of f n at various concentrations, from which it was possible to determine the successive equilibrium constants of Eq. (5) with increasing values of n.
Finally, sedimentation velocity experiments on a mixture of f n and soluble fibrin (Donnely et al. Reference Donnely, Laskowski, Notley and Scheraga1955) indicated the presence of a reversible equilibrium
 $$mf_n \mathrel{\mathop{\kern0pt\rightleftharpoons}} {\rm fibrin,}$$
where m is a variable number, and ‘fibrin’ represents a soluble form of a cross-linked aggregate characterized by Ferry & Morrison (Reference Ferry and Morrison1947). The experiments of Donnelly et al. and Sturtevant et al. indicated that hydrogen bonds are also involved in the reversible process represented by Eq. (6).
3.3 Mechanism of the thrombin-induced conversion of fibrinogen to fibrin
On the basis of the results presented in sections 3.1 and 3.2, the overall reaction between thrombin and fibrinogen may be represented by the following three reversible simultaneous equilibria:
Step 1.
 $F\mathrel{\mathop{\kern0pt\rightleftharpoons}}f + 2FpA + 2FpB.$
Step 2.
$\; nf \mathrel{\mathop{\kern0pt\rightleftharpoons}} f_n. $Step 3.
$mf_n \mathrel{\mathop{\kern0pt\rightleftharpoons}} {\rm \; fibrin}.$



The foregoing mechanism was deduced from experiments with purified fibrin and thrombin. However, in addition to fibrinogen and prothrombin, blood also contains a cross-linking enzyme, fibrin-stabilizing factor (Lorand, Reference Lorand1951), which converts fibrin from the soluble form represented in step 3 to an insoluble form, thereby driving all the forms in these equilibria, in the natural animal system, to an insoluble fibrin clot to stop the bleeding process.
3.4 Bleeding disorders
As pointed out at the beginning of Section 3, a cascade of proteolytic degradations is involved to convert prothrombin to thrombin. If any one of the enzymes leading to the intermediate degradation products, e.g., factor VIII, is missing (in a genetic disease), then thrombin cannot be produced, and therefore is not available to induce clotting of fibrinogen, leading to hemophilia. Since our work was not involved in the prothrombin–thrombin conversion, no further discussion of this process is presented here.
However, other bleeding disorders are produced by single-site mutations of fibrinogen. Several of these mutations lead to altered structure of the wild-type fibrinogen site where thrombin binds, thereby preventing thrombin binding and leading to a bleeding disorder, i.e., to a non-clottable fibrinogen. By use of transferred-NOE nuclear magnetic resonance experiments, the structure of the portion of wild-type fibrinogen (shown at the bottom of Fig. 4) that binds to thrombin was determined (Ni et al. Reference Ni, Konishi, Frazier, Scheraga and Lord1989a, Reference Ni, Meinwald, Vasquez and Scheragab). In a particular mutant, fibrinogen Rouen, Gly-12 is replaced by Val-12. This mutation converts the wild-type structure of the fibrinogen-binding site to an altered one shown at the top of Fig. 4 (Ni et al. Reference Ni, Konishi, Bullock, Rivetna and Scheraga1989c) which can no longer bind thrombin; hence, no formation of fibrin monomer occurs. This may be regarded as a molecular mechanism for a bleeding disorder (Ni et al. Reference Ni, Konishi, Bullock, Rivetna and Scheraga1989c).
Top. Structure near the N-terminus of the Aα chain of the fibrinogen Rouen mutant. Bottom. Structure of the same portion of wild-type fibrinogen, which contains glycine at position G12, but shown here with V12 of fibrinogen Rouen computationally replacing G12 of the wild-type protein (Ni et al. Reference Ni, Konishi, Frazier, Scheraga and Lord1989a, Reference Ni, Meinwald, Vasquez and Scheragab, Reference Ni, Konishi, Bullock, Rivetna and Scheragac).
4. Hydrogen bonds in proteins
The colloidal view of proteins gave way to a molecular view when Sumner demonstrated that an enzyme is a large protein molecule (Sumner, Reference Sumner1933; Sumner et al. Reference Sumner, Gralén and Eriksson-Quensel1938) and, in the early 1950s when Pauling & co-workers (Reference Pauling, Corey and Bransom1951) proposed the detailed α- and β-structures of proteins, and Sanger and co-workers (Ryle et al. Reference Ryle, Sanger, Smith and Kitai1955) determined the amino acid sequence and disulfide-bond connectivity of the two chains of insulin. Whereas Pauling and Corey had focused on the backbone hydrogen bonds in their work on the α- and β-structures, our work on the involvement of hydrogen bonds in the polymerization of fibrin monomer led to an in-depth treatment of the role of side chain–side chain hydrogen bonds.
4.1 Effect of hydrogen bonds on pKa's
Together with Michael Laskowski, Jr., we developed a model for the entropy, enthalpy, and equilibrium constant for formation of an internal side chain–side chain hydrogen bond in a protein (Laskowski & Scheraga, Reference Laskowski and Scheraga1954). In the gas phase and in non-aqueous solvents, it is possible for the following side-chain single and double-hydrogen-bond species to form
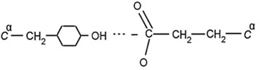
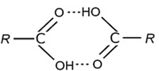
between, say, a tyrosyl donor and a glutamate acceptor (Eq. (7)) or a donor and acceptor pair between two glutamic acids (Eq. (8)). Equation (7) can participate in the following simultaneous equilibria involving a donor DH and an acceptor A −:
 $$DH + A^ - \mathrel{\mathop{\rightleftharpoons}} DH - A^ -, $$
 $$DH\mathrel{\mathop{\rightleftharpoons}} D^ - + H^ +, $$
 $$HA\mathrel{\mathop{\rightleftharpoons}} H^ + + A^ -. $$
The hydrogen bond in Eq. (9) will raise the pKa of DH in Eq. (10), and lower the pKa of HA in Eq. (11) by the free energy of formation of the hydrogen bond in Eq. (9). These shifts in pKa's of the donor and acceptor groups are diagnostic of the existence of such a hydrogen bond.
In aqueous solution, on the other hand, H2O can bind to the donors and acceptors and influence the effective strengths of the hydrogen bonds between donors and acceptors. However, the shifts in pKa described above can be maintained in aqueous solution by the associated participation of non-polar groups in nearby hydrophobic interactions (Némethy et al. Reference Némethy, Steinberg and Scheraga1963), as discussed in Section 6.
With this model, we were able to account for modified binding of hydrogen ions, i.e., modified pKa's, and binding of small molecules or ions to proteins. It was also possible to account for some of the abnormal dependence of binding constants on the amount of unbound material and for the phenomenon of ‘all or none’ binding without requiring unfolding of the protein molecule (Laskowski & Scheraga, Reference Laskowski and Scheraga1954).
4.2 Effect of hydrogen bonds on primary valence bonds
The foregoing thermodynamic treatment of internal hydrogen bonding in proteins was extended to include the modified reactivity of primary valence bonds, namely, peptide and disulfide bonds (Laskowski & Scheraga, Reference Laskowski and Scheraga1956). Two amino acids can be formally represented in the following equilibrium for formation of a peptide bond in the gas phase or in non-aqueous solvents:
with an equilibrium constant favoring the two species on the left-hand side of the equation. However, peptide bonds can be formed and stabilized in a protein by a variety of mechanisms, one of which involves formation of a hydrogen bond between the polar side-chain R groups of one or more of the amino acid residues of the reacting species and the side-chains of part of the reacting protein (Laskowski & Scheraga, Reference Laskowski and Scheraga1956). This accounts for the reversibility of Eq. (4) in the blood-clotting mechanism. The same phenomenon accounts for the different stabilities of the several disulfide bonds of a given protein.
In summary, a backbone peptide bond in a protein may be apparently more stable than the corresponding bond in a low molecular weight model compound, e.g., a dipeptide, because of a contribution from the free energy required to break the hydrogen bonds between a given peptide fragment and the remainder of the protein molecule (limited proteolysis). The equilibrium of Eq. (12) can be shifted to the right because of the free-energy contribution from formation of hydrogen bonds, and accounts for peptide bond synthesis in the reverse of step 1 in the thrombin–fibrinogen reaction.
4.3 Effect of hydrogen bonds on protein denaturation
The same model was used to develop a theory of the kinetics of protein denaturation (Laskowski & Scheraga, Reference Laskowski and Scheraga1961) (see Section 19 for kinetics of protein folding). The activation process involves the rupture of a critical number of side-chain hydrogen bonds, and the rate of denaturation depends on the concentration of the molecules in which these side-chain hydrogen bonds are ruptured. In passing from the activated to the denatured state, the system is assumed to pass through an intermediate state in which the backbone chains have acquired sufficient freedom to be able to move with respect to each other. Expressions were obtained (Laskowski & Scheraga, Reference Laskowski and Scheraga1961) for the rate constant and for the thermodynamic parameters for the activation process for thermal denaturation (under conditions where the rate is independent of pH), for pH-dependent denaturation, and for urea denaturation. Criteria were also developed for assessing the strengths of the side-chain hydrogen bonds, and for application of the theory to experimental data and, thereby, providing information about the hydrogen bonds which help maintain the native conformations of globular proteins.
5. Theory of hydrophobic interactions
Realizing that water plays an important role in hydrophobic interactions, it was felt essential to gain an understanding of the thermodynamic properties of aqueous solutions of hydrocarbons. Therefore, based on models for the thermodynamic properties of liquid water (Némethy & Scheraga, Reference Némethy and Scheraga1962a) and of aqueous solutions of hydrocarbons (Némethy & Scheraga, Reference Némethy and Scheraga1962b), a theory was developed for the hydrophobic interactions of non-polar side chains in water (Némethy & Scheraga, Reference Némethy and Scheraga1962c), with further improvements in the treatment by Griffith & Scheraga (Reference Griffith and Scheraga2004). Experimental studies (Schneider et al. Reference Schneider, Kresheck and Scheraga1965) verified the theoretically computed thermodynamic parameters for the interactions between all hydrophobic pairs of non-polar side chains in proteins.
5.1 A model for the thermodynamic properties of liquid water
A ‘flickering cluster’ model of liquid water structure (Némethy & Scheraga, Reference Némethy and Scheraga1962a) was based on the theory suggested by Frank & Wen (Reference Frank and Wen1957) and Frank (Reference Frank1958), and modified later by Griffith & Scheraga (Reference Griffith and Scheraga2004). Because of the cooperativity of hydrogen-bond formation, large clusters of water molecules are formed. In the original 1962 model, liquid water consists of short-lived, ice-like clusters of hydrogen-bonded water molecules embedded in and in equilibrium with ‘unbonded water.’ The clusters are near-spherical with a convex outer surface. The water molecules in the interior of a cluster are each involved in four hydrogen bonds, whereas those water molecules on the surface of a cluster participate in either three, two or one hydrogen bond. The water molecules in this mixture model are divided into five energy states depending on the number of hydrogen bonds in which they are participating. The four lowest levels are occupied by the molecules of a cluster, and pertain to the four- , three- , two- and one-bonded molecules. The fifth, highest, level pertains to the ‘unbonded’ water molecules which interact with their surroundings, so that the energy of this level is far below that of a non-bonded molecule in a dilute gas phase. The distribution of the populations among the energy levels of these five states is governed by the corresponding Boltzmann factor, exp (−E i/kT), and by the degrees of freedom allotted to the motions (vibrations, etc.) of each molecular species. A partition function based on considerations of the described model is evaluated to determine the populations of each energy level and the temperature-dependent thermodynamic parameters. At a given temperature, the total number of hydrogen bonds in the liquid and the equilibrium between clusters and unbonded water are determined by the requirement that the free energy of the system should be a minimum. Evaluation of the partition function leads to values of the temperature-dependence of the free energy, internal energy, constant-volume heat capacity and molar volume of liquid water in agreement with experimental data.
5.2 A model for the thermodynamic properties of aqueous solutions of hydrocarbons
A model for hydrocarbon solutions was based on the existence of crystalline hydrates (clathrate structures) of several nonpolar gases and liquids at various pressures and at temperatures above 0°C (von Stackelberg & coworkers, Reference Von Stackelberg and Müller1954, Reference Von Stackelberg and Meuthem1958). In these hydrates, the water molecules are interconnected by hydrogen bonds and are arranged so as to form networks of polyhedra enclosing cavities of various sizes with diameters ranging from 5.2 to 6.9 Å. The structure is stabilized by the inclusion of non-polar solute molecules of suitable sizes in these spherical cavities.
Based on the assumption that the probability of finding a water cluster is somewhat greater in the neighborhood of solute hydrocarbon molecules than at a point in the bulk of pure water, the solute molecule is partially surrounded by the hydrogen-bonded water network of a cluster. The main difference from pure liquid water is that the energy levels and hence the distribution of water molecules in the water layer next to the hydrocarbon are shifted due to different interactions between the water and hydrocarbon molecules. Instead of the water clusters being spherical, as in pure water, they adopt a concave surface with a hydrocarbon interacting at this concave surface, and the energy levels of the water molecules with broken hydrogen bonds in the first layer around the hydrocarbon solute are shifted upward. However, water molecules in this first layer of the cluster with four hydrogen bonds, in addition, can also have a solute neighbor, and effectively become penta-coordinated with its energy level shifted downward. As a result of these energy-level shifts, the population of four-hydrogen-bonded water will increase, i.e., as a result of formation of this partial clathrate cage, the degree of hydrogen bonding in the system will increase, with the hydrocarbon acting as a structure maker. With this increase in structure, both the enthalpy and the entropy will decrease in agreement with experimental data, but, because the system is entropy dominated, the free energy will increase, accounting for the insolubility of hydrocarbons in water and for the temperature-dependence of the thermodynamic parameters for aqueous solutions of aliphatic and aromatic hydrocarbons. The paper of Némethy & Scheraga (Reference Némethy and Scheraga1962b) was cited numerous times over the years, the most recent being the paper by Sun et al. (Reference Sun, Lin, Cambell, Allingham and Davies2014) in which their reference 15 cited the paper by Némethy & Scheraga (Reference Némethy and Scheraga1962b).
The model described here for aqueous solutions of hydrocarbons was based on physical insight but, many years later, when empirical potential-energy functions were used to simulate physical systems, the partial clathrate-type model was verified by many simulations of non-polar molecules in water, e.g. that of Owicki & Scheraga (Reference Owicki and Scheraga1977). For example, the pair correlation function for the O…O distance in liquid water is ~ 2.4–3.6 Å and contains ~ 4 water molecules. For an aqueous solution of methane, the pair correlation function for the C…O distance is ~ 3.1–6.0 Å and contains ~ 23 water molecules, which are characteristic of the hydrated clathrate structure of methane (Owicki & Scheraga, Reference Owicki and Scheraga1977).
The phenomenon discussed in Section 5.2 may be regarded as hydrophobic hydration. Section 5.3 will refer to hydrophobic interaction.
5.3 Thermodynamic properties of hydrophobic bonds in proteins
Although the terminology ‘hydrophobic bond’ was adopted in the 1960s, and will be retained here when discussing early work, the more appropriate term, in use now, is ‘hydrophobic interactions’.
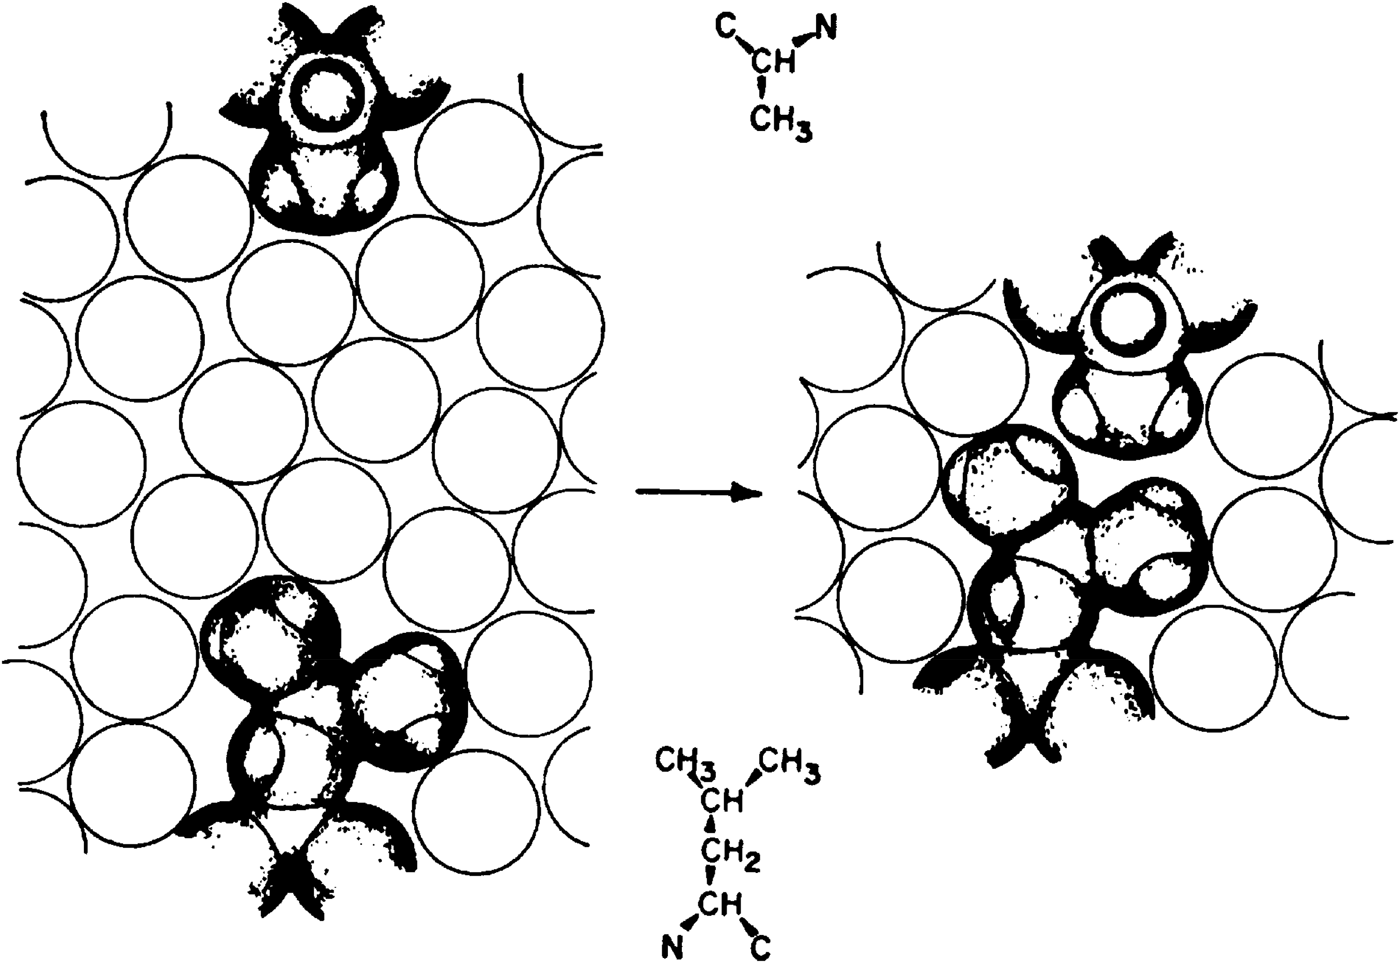
A model for hydrophobic interaction between alanine and leucine side chains in water is illustrated in Fig. 5, where the open circles are a schematic representation of the water solvent. When the two side chains, represented by their van der Waals radii, are separated, as on the left side of Fig. 5, they each interact with the solvent (hydrophobic hydration), as described by the model in Section 5.2. When these side chains come into contact, as shown on the right side of Fig. 5, there is less hydrocarbon surface in contact with the solvent than when these side chains are separated, as shown on the left side of Fig. 5. Physically, this is equivalent to removing a hydrocarbon from solution. Since the thermodynamic parameters for inserting the non-polar side chain into an aqueous solution, according to the temperature dependence to which reference was made in Section 5.2, are ΔH < 0, ΔS < 0, ΔG > 0, ΔV < 0, these values for removing a non-polar side chain from solution are ΔH > 0, ΔS > 0, ΔG < 0, ΔV > 0, (hydrophobic interaction), i.e., this interaction is thermodynamically favorable (ΔG < 0), and increases in strength with increasing temperature (ΔH > 0). The van der Waals contact between these two side-chains is only a small part of the total free energy of the hydrophobic interaction; the largest part comes from the decrease of hydrocarbon–water interactions when these two side-chains come into contact. Quantitative values for formation of such hydrophobic bonds in water for all possible pairs of interacting non-polar side chains in proteins have been presented by Némethy & Scheraga (Reference Némethy and Scheraga1962c).
Model for hydrophobic interaction between alanine and leucine side chains in water. Open circles are a schematic representation of the water solvent. Left, separated side chains; Right, two side chains in hydrophobic interaction (Némethy & Scheraga, Reference Némethy and Scheraga1962c).
In addition to their importance in proteins, hydrophobic interactions were also shown to account for the stability of detergent micelles in water (Kresheck et al. Reference Kresheck, Hamori, Davenport and Scheraga1966; Poland & Scheraga, Reference Poland and Scheraga1965b, Reference Poland and Scheraga1966a). In a similar manner, water-based hydrophobic interactions play a role in association reactions of proteins (Steinberg & Scheraga, Reference Steinberg and Scheraga1963; Matheson & Scheraga, Reference Matheson and Scheraga1978). The interplay of hydrogen-bond and hydrophobic interactions also accounts for the variation in dimerization free energy of a homologous series of carboxylic acids in water (Chen et al. Reference Chen, Brooks and Scheraga2008; Schrier et al. Reference Schrier, Pottle and Scheraga1964). See also Scheraga (Reference Scheraga1998).
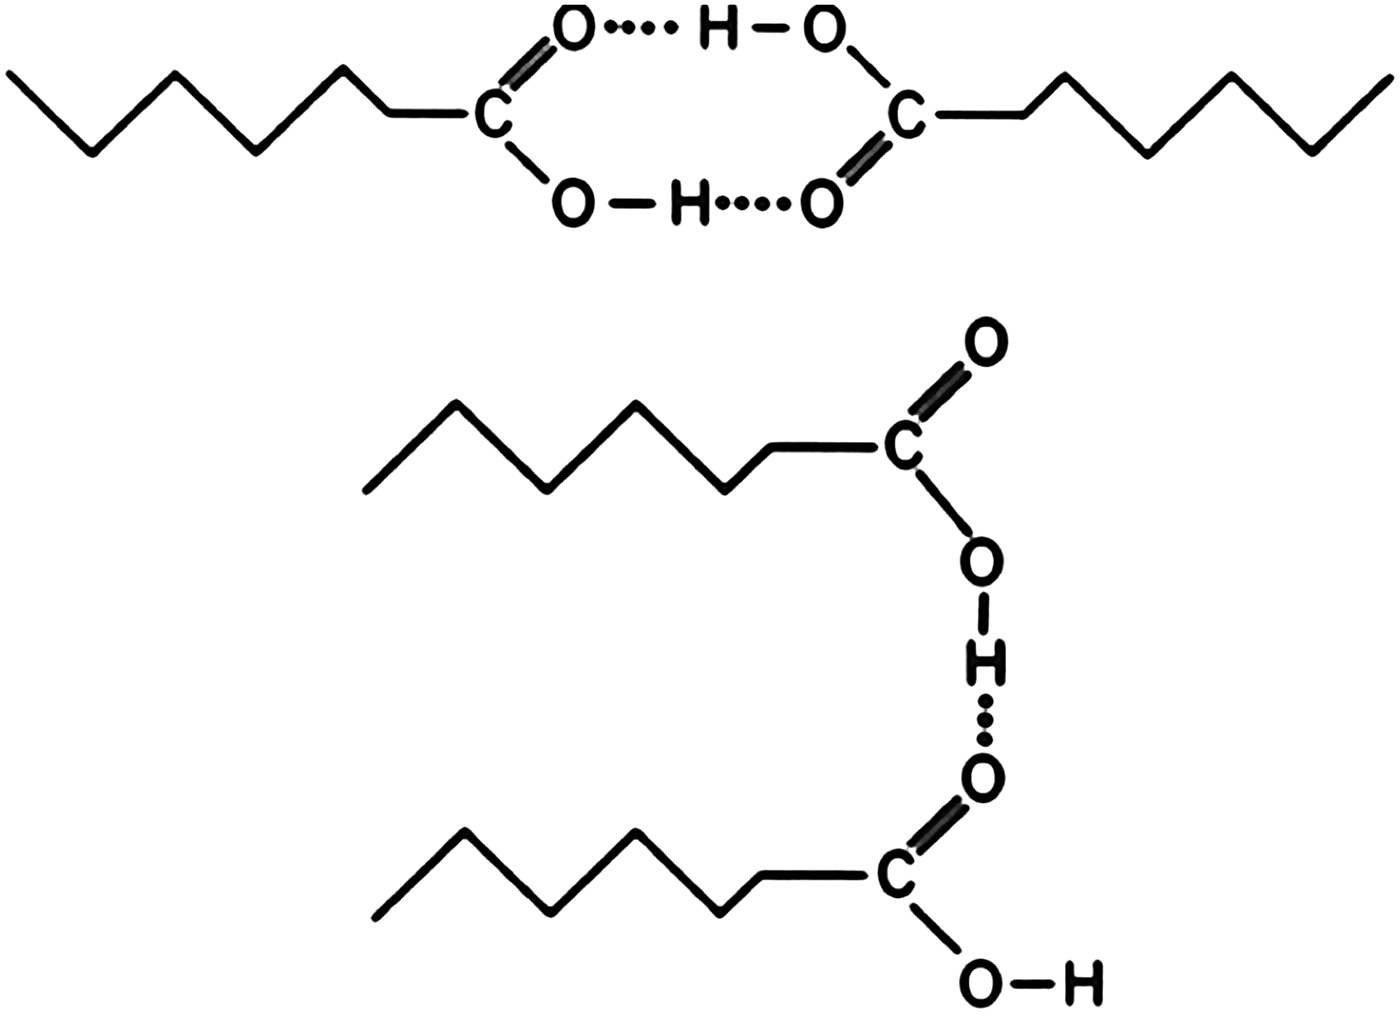
In the dimerization of carboxylic acids in the gas phase and in non-aqueous solution, shown in Eq. (8) and at the top of Fig. 6, the equilibrium constant is independent of the length of the attached hydrocarbon chain. However in aqueous solution, the equilibrium constant increases with the length of the attached hydrocarbon chain; Schrier et al. (Reference Schrier, Pottle and Scheraga1964) have accounted for this behavior in terms of increasing hydrophobic interaction between the non-polar chain, as shown in the dimer structure at the bottom of Fig. 6, as the side chain increases in length.
Models for dimerization of carboxylic acids in different solvents. Top, in the gas phase and in non-equeous solvents; Bottom in water. With increase in the size of the non-polar side chain of the carboxylic acid, the dimerization equilibrium constant in water increases (Schrier et al. Reference Schrier, Pottle and Scheraga1964).
6. Interplay between hydrogen-bond and hydrophobic interactions
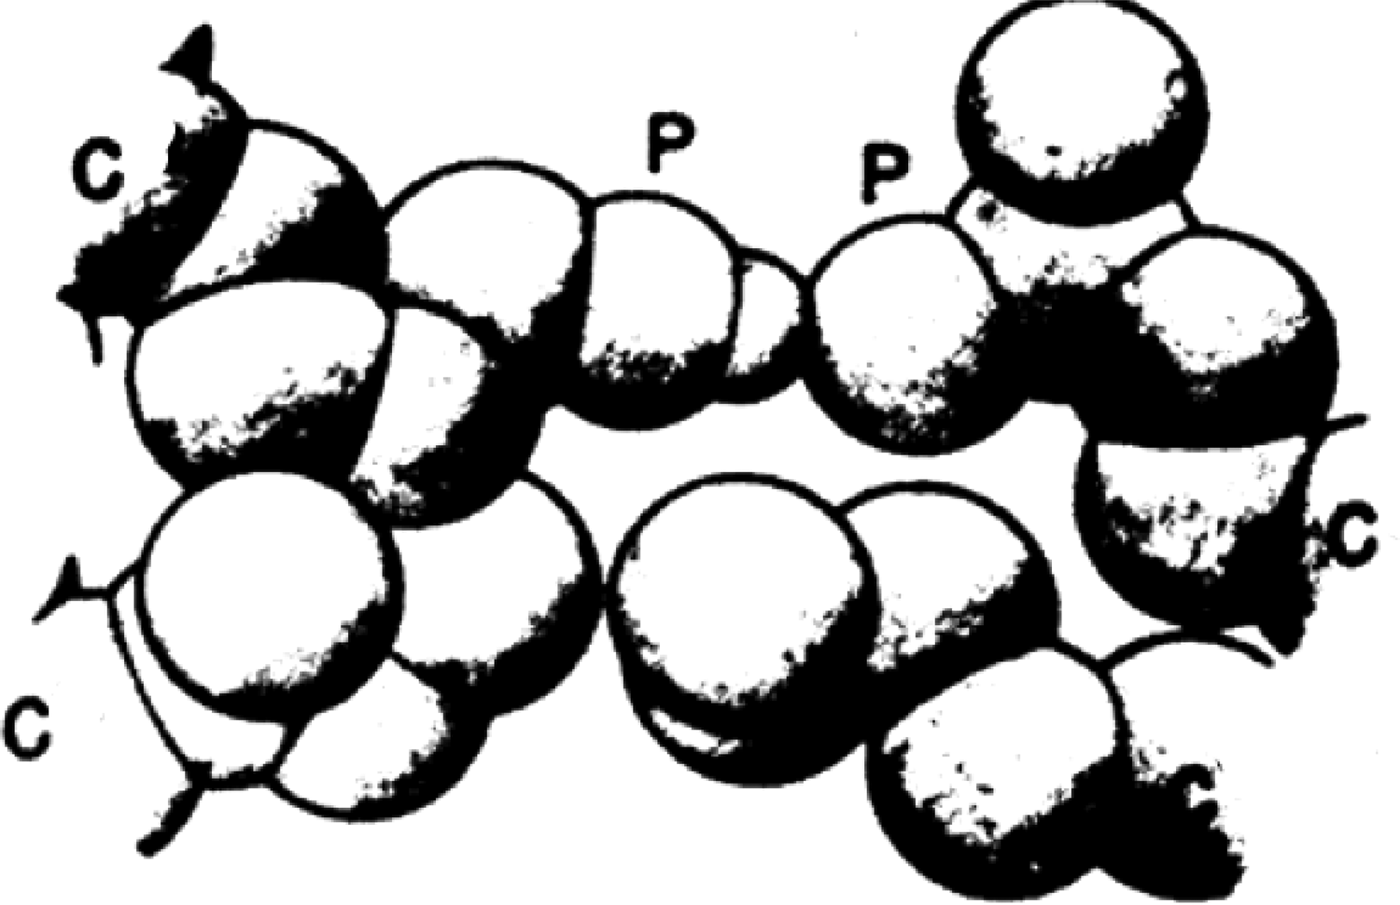
The above studies of hydrogen bonds and hydrophobic interactions led to an answer to the question of how hydrogen bonds between polar side chains of proteins, as in Eqs. (7) and (8), can provide any stabilization free energy if they must also form hydrogen bonds with water. The answer relies on the interplay between hydrogen bonds and hydrophobic interactions. The interaction of non-polar residues with the nearby non-polar portions of polar amino acids strengthens hydrogen bonds in which the polar side chains are involved (Némethy et al. Reference Némethy, Steinberg and Scheraga1963) as shown in Fig. 7; hence, the latter enhances our understanding of the contributions of such hydrogen bonds to protein stability (Némethy et al. Reference Némethy, Steinberg and Scheraga1963; Scheraga et al. Reference Scheraga, Némethy and Steinberg1962).
Increase of hydrogen-bond strength from hydrophobic interactions of nearby nonpolar side chains with the nonpolar segments of polar side chains (Némethy et al. Reference Némethy, Steinberg and Scheraga1963).
7. Helix–coil transitions
After Pauling and Corey had proposed the α-helix, much effort was expended to study the thermally induced helix–coil transition, first with homopolymers, and then with various types of copolymers, as a possible model for protein folding. However, it was later shown by Hao & Scheraga, (Reference Hao and Scheraga1998a) that the simple short-range-interaction Ising model cannot account for the cooperativity of protein folding; instead, long-range interactions are also required together with short-range interactions (Hao & Scheraga, Reference Hao and Scheraga1998b). Nevertheless, useful information has been extracted from experimental studies of helix–coil transitions, as shown in Sections 7.1, 7.2, and 8.
7.1 Some helix–coil transition theories
Early Ising-model-like theoretical treatments were carried out by Zimm & Bragg (Reference Zimm and Bragg1959) and Lifson & Roig (Reference Lifson and Roig1961), with a matrix formulation to evaluate the partition function, to characterize the thermal melting involved in the helix–coil transition in homopolyamino acids in terms of σ and s, which reflect the nucleation and growth, respectively, of an α-helix. For example, poly-L-alanine chains beyond a critical length exist as an α-helix in water at 5°C at neutral pH, stabilized by backbone NH…OC hydrogen bonds and hydrophobic interactions between the β-carbon of the ith residue and the α-carbon of the (i+3) residue (β 1–α 4 interaction, with the subscript numbers increasing toward the N-terminus) (Bixon et al. Reference Bixon, Scheraga and Lifson1963). Various forms and lengths of the α-helix and the coil in poly-L-alanine were treated theoretically by Poland & Scheraga, (Reference Poland and Scheraga1965a, Reference Poland and Scheraga1970), including the kinetics of the helix–coil transition in polyamino acids (Poland & Scheraga, Reference Poland and Scheraga1966d). The methodology was extended to the helix–coil transition in finite chains of DNA (Poland & Scheraga, Reference Poland and Scheraga1969).
Since every amino acid except glycine has a β carbon, the α-helical form of these amino acid residues will have a stabilizing β 1–α 4 hydrophobic interaction. However, not all amino acid residues form stabilized α-helices because the part of their side chain, beyond the β-carbon, interacts with the backbone of the polypeptide chain in an overcoming de-stabilizing manner (Scheraga, Reference Scheraga1973).
7.2 Experimental studies of helix–coil transitions
An experimental study of the thermal melting of poly-L-alanine in water was carried out by Ingwall et al. (Reference Ingwall, Scheraga, Lotan, Berger and Katchalski1968). In order to solubilize this polymer in water, triblock copolymers were prepared with a central block of poly-L-alanine of chain lengths of 10, 160, 450, and 1000 alanyl residues, respectively, surrounded on each side by blocks of solublizing poly-D,L-lysine. Melting experiments were carried out on the central poly-L-alanine block at neutral pH in the range of 5° to 80°C. No helicity was observed for the short poly-L-alanine block of ten residues, but the larger central blocks of poly-L-alanine exhibited chain-length-dependent melting which was analyzed by the theory of Lifson & Roig (Reference Lifson and Roig1961), with β 1–α 4 interactions being involved. In addition, with the aid of side chain–side chain hydrophobic interactions, longer α-helical segments can fold back on each other, as shown by Poland & Scheraga (Reference Poland and Scheraga1965a).
The characteristics of the helix–coil transition of α-helical polyamino acids (Poland & Scheraga, Reference Poland and Scheraga1966b) and of the double-helix form of polynucleotides (Poland & Scheraga, Reference Poland and Scheraga1966c) as order–disorder phase transitions were discussed by Poland & Scheraga (Reference Poland and Scheraga1966b, Reference Poland and Scheragac) and by Fisher (Reference Fisher1966).
A real-space renormalization group (RG) transformation was used to treat the Lifson-Roig model for the helix–coil transition in a homopolyamino acid (Li & Scheraga, Reference Li and Scheraga1984). By utilizing the matrix formalism, the eigenvalues of the Lifson–Roig statistical-weight matrix were obtained with the RG method, without having to solve the secular equation. The treatment provides a clear picture of the behavior of the system in the transition region.
8. Helix-forming tendency of the 20 naturally occurring amino acids
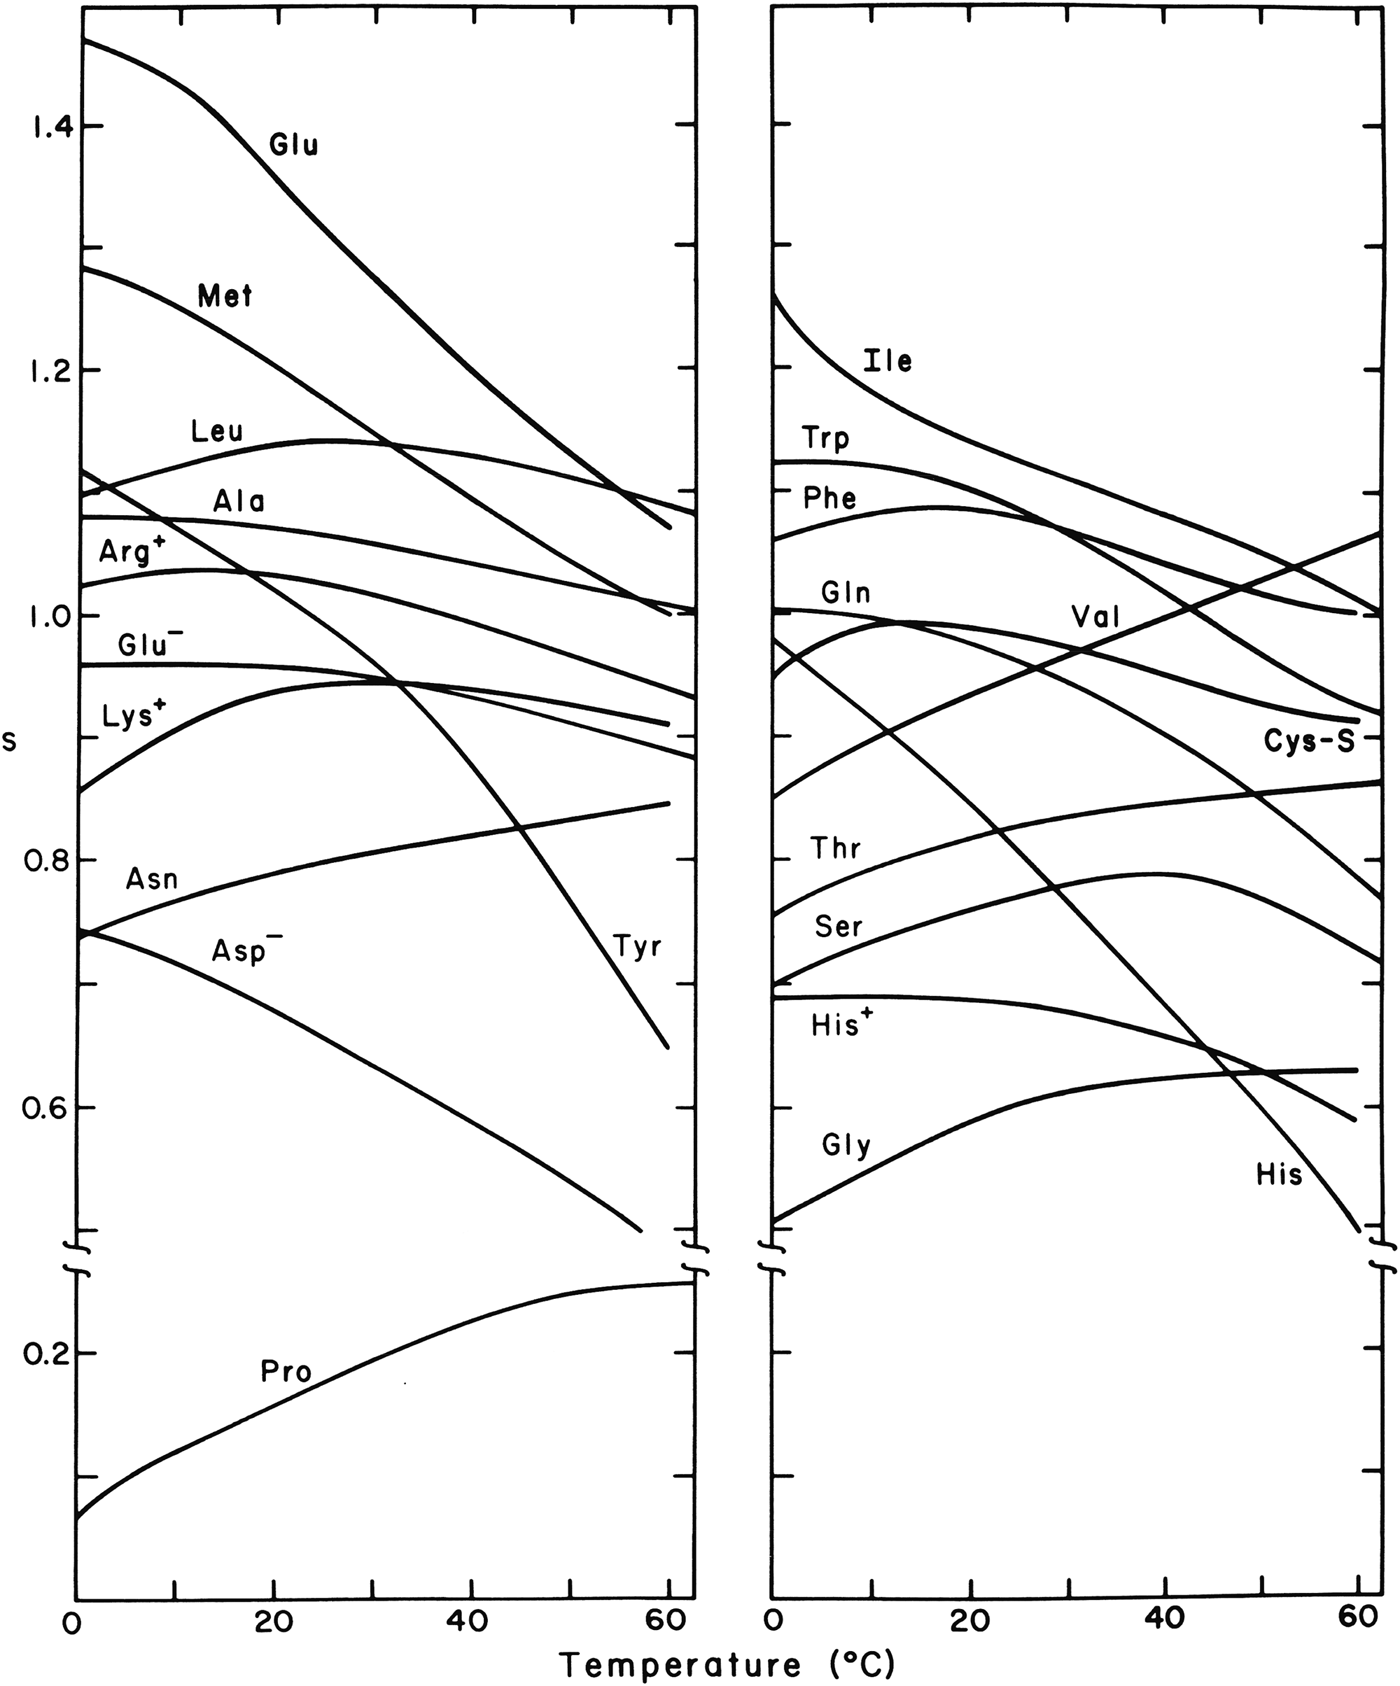
Experimental studies were carried out on host–guest random copolymers of a water-soluble polyamino acid host which, both as a host homopolymer and as a random copolymer with a guest residue, undergo a thermally induced helix–coil transition. The guest residue was one of each of the twenty naturally occurring amino acids, and the results were reported in a series of publications beginning with the theoretical formulation of the partition function for a random copolymer by Von Dreele et al. (Reference Von Dreele, Lotan, Ananthanarayanan, Andreatta, Poland and Scheraga1971a, Reference Von Dreele, Poland and Scheragab) and the experimental work of Ananthanarayanan et al. (Reference Ananthanarayanan, Andreatta, Poland and Scheraga1971) with glycine as the first guest residue, and ending with the work of Wojcik et al. (Reference Wojcik, Altmann and Scheraga1990) with cysteine as the last of the 20 guest residues. From the effect of the guest residues on the melting behavior of the host homopolyamino acid, like the effect of an impurity on the melting behavior of a solid, it was possible to determine the Zimm–Bragg thermodynamic parameters σ and s as a function of temperature for a helix–coil transition of a hypothetical homopolyamino acid guest, and hence the helix-forming tendency of the guest residue. The theory and experimental thermodynamic parameters are summarized by Wojcik et al. (Reference Wojcik, Altmann and Scheraga1990), and the experimental temperature dependence of the Zimm–Bragg stability constants, s, for the 20 naturally occurring amino acids are shown in Fig. 8. These values of s reflect the short-range interaction between a side chain of a given residue and its own backbone group (Scheraga, Reference Scheraga1973).
Dependence of the Zimm–Bragg stability constant s on temperature for the 20 naturally occurring amino acids, with each as a guest residue in a host–guest random copolymer (Wojcik et al. Reference Wojcik, Altmann and Scheraga1990).
8.1 Characteristics of the dependence of s for some of the amino acids on temperature
In general, the decrease of s with increasing temperature, shown in Fig. 8, reflects the melting behavior of the corresponding hypothetical homopolyamino acid. Some residues, such as valine, exhibit an increased helix constant as temperature increases because of side chain–side chain hydrophobic interactions which increase in strength with increasing temperature. The corresponding homopolymer would melt only at a temperature exceeding the temperature range shown in Fig. 8. Isoleucine and valine, whose side chains are both branched at their Cβ atoms, show very different temperature dependence. This phenomenon, as well as that of a related non-polar side chain, leucine, was investigated by M. Gō & Scheraga (Reference Gō and Scheraga1984), who computed theoretical values of s versus temperature from interatomic interaction energies, taking solvent (hydrophobic and hydrophilic) effects into account. The calculated s versus temperature curves for valine and isoleucine are consistent with the observed experimental behavior. The two homopolymers behave differently because of differences in the change in the number of hydration–shell water molecules accompanying their helix–coil transitions. The larger isoleucine side chains are more crowded together in both the α-helical and coil forms than are those of valine. Therefore, there is a smaller change in hydration of the isoleucine side chains compared with that of the valine side chains in the helix–coil transition. By analyzing the effects of hydration on the s versus temperature curves, it was possible to account also for the experimental curve for poly-L-leucine which exhibits an intermediate behavior between those for poly-L-valine and poly-L-isoleucine (M. Gō & Scheraga, Reference Gō and Scheraga1984).
8.2 Two different approaches for alanine helix–coil transitions
For alanine, similar thermodynamic parameters were obtained from two different types of copolymers, namely, the triblock copolymer containing poly-L-alanine as a central block (Ingwall et al. Reference Ingwall, Scheraga, Lotan, Berger and Katchalski1968) and also the random host–guest copolymer with alanine as a guest residue (Platzer et al. Reference Platzer, Ananthanarayanan, Andreatta and Scheraga1972a). This attests to the validity of the underlying assumptions, primarily the dominance of intrinsic (short-range) interactions (Scheraga, Reference Scheraga1973).
8.3 Application of helix-forming tendencies
By application of the partition function of the Zimm–Bragg theory for the one-dimensional Ising model, and the associated experimental parameters σ and s from curves for melting of the helix–coil transitions in random host–guest copolymers of amino acids to several denatured proteins, it was possible to compute helix-probability profiles of denatured proteins (Lewis et al. Reference Lewis, Gō, Gō, Kotelchuck and Scheraga1970). A correlation was found for the propensity of a residue to be helical in the denatured protein just above the denaturation temperature and its occurrence in a helical region in the globular structure of the corresponding native protein. Thus, these incipient helical regions in the denatured chain may serve to nucleate the folding to form the native protein. Short-range interactions appear to determine the tendency for a residue to be helical or not (Scheraga, Reference Scheraga1973), whereas long-range interactions may serve to carry out the nucleation and refolding processes (Hao & Scheraga, Reference Hao and Scheraga1998b; Scheraga et al. 2002b); also see Section 14.6.
Similar calculations of helix–probability profiles of the denatured forms of a large number of species of cytochrome c proteins were carried out. Despite differences in amino acid composition in these species, the computed helix–probability profiles are similar and correlate well with the helical regions of native horse and bonito ferricytochrome c (Lewis & Scheraga, Reference Lewis and Scheraga1971a). Similar calculations were also carried out for the denatured forms of bovine α-lactalbumin and hen egg white lysozyme, with the result that there is a one-to-one correspondence of the location of the helical regions predicted and found for lysozyme, and predicted for α-lactalbumin. These results support the idea that these two proteins, α-lactalbumin and lysozyme, are structurally homologous, and demonstrate the conservative nature of amino acid replacements as far as the helix-forming tendency in homologous proteins is concerned (Lewis & Scheraga, Reference Lewis and Scheraga1971b). These conclusions were later borne out by the calculations of Warme et al. (Reference Warme, Momany, Rumball, Tuttle and Scheraga1974) of the structure of α-lactalbumin from that of lysozyme, as discussed in Section 18.
9. Experimental studies of structure of RNase A
With the demonstration of the influence of hydrogen bonds on pKa's by Laskowski & Scheraga (Reference Laskowski and Scheraga1954), physical chemical and biochemical experiments were then used to identify hydrogen-bonded donors and acceptors, and the pairing thereof, in native bovine pancreatic RNase A before the x-ray structure of this protein was known (summarized by Scheraga, Reference Scheraga1967).
9.1 pKa's of tyrosyl and carboxyl groups
Tyrosyl groups have a normal pKa of ~10, and carboxyl groups have a normal pKa of ~4. Significant departures from these pKa values in a protein, in the directions described as abnormal for donors and acceptors, respectively, in Section 4.1, indicate the possibility that these groups might be involved in hydrogen bonds. Experimentally, three of the six tyrosyl groups (Tanford et al. Reference Tanford, Hauenstein and Rands1955) and three of the 11 carboxyl groups (Hermans & Scheraga, Reference Hermans and Scheraga1961b; Riehm et al. Reference Riehm, Broomfield and Scheraga1965) of RNase A have abnormal pKa's in that they are quite different from the values of these groups in model compounds. Differential ultraviolet spectrometry (Scheraga, Reference Scheraga1957) showed that this spectrum of tyrosine was perturbed at pH~2, far from pH10 where this residue normally ionizes, but close to the pH where an abnormal carboxyl group ionizes, suggesting the possible existence of tyrosyl…carboxylate hydrogen bonds. With the aid of appropriate derivatives of RNase A, the three abnormal tyrosines were identified by Woody et al. (Reference Woody, Friedman and Scheraga1966) as Tyr 25, 92, 97, and the three abnormal carboxyls were identified as Asp 14, 38, 83 (Riehm et al. Reference Riehm, Broomfield and Scheraga1965), which were subsequently paired as Tyr25…Asp 14, Tyr92…Asp38, and Tyr97…Asp83 (Li et al. Reference Li, Riehm and Scheraga1966) as one combination out of several thousand possible combinations. These three specific hydrogen bonds were later identified in the subsequent determination of the crystal structure of RNase A (Wlodawer & Sjölin, Reference Wlodawer and Sjölin1983).
9.2 Initial NMR experiments with RNase A
With a knowledge of the location of these three hydrogen bonds in the native structure of RNase A, and the availability of a 60MHZ NMR spectrometer, we made an initial attempt to determine what information could be gained from use of such a low-field NMR spectrometer (Bradbury & Scheraga, Reference Bradbury and Scheraga1966). RNase A contains four histidines at positions 12, 48, 105 and 119, whose C-2 protons exhibited peaks in the NMR spectrum. At this low field, the pH dependence of these four resonances appeared as three separate curves because of overlap of two of the four resonances. At a higher field of 100 MHZ, it was possible to resolve the C-2 resonances of all four histidines (Meadows et al. Reference Meadows, Markley, Cohen and Jardetzky1967, Reference Meadows, Jardetzky, Epand, Ruterjans and Scheraga1968).
9.3 Use of distance constraints in NMR determinations of protein structures
The three hydrogen bonds in RNase A (Li et al. Reference Li, Riehm and Scheraga1966), mentioned in Section 9.1, served as distance constraints in the formulation of a molecular mechanics procedure, ultimately leading to the Empirical Conformational Energy Program for Peptides (ECEPP) to compute protein structure (see Section 12). ECEPP was also incorporated into procedures to determine protein structure by NMR spectroscopy, as summarized in a book by Wüthrich (Reference Wüthrich1986). The field of NMR determination of the structures of biological macromolecules at higher fields was developed dramatically by Wüthrich (Reference Wüthrich1986) and others, with many applications to the determination of protein structure in solution, e.g., in the determination of the structure of murine epidermal growth factor (Montelione et al. Reference Montelione, Wüthrich, Burgess, Nice, Wagner, Gibson and Scheraga1992).
10. Folding pathways of RNase A with intact disulfide bonds
RNase A contains four disulfide bonds, and its unfolding/folding transitions, with its disulfide bonds intact, were examined either by heating at various pH's and then cooling, or by adding a denaturing agent such as guanidine hydrochloride and then by diluting the denaturing agent.
The pH- and temperature-dependence of the reversible transition were examined by following changes in either optical rotation or ultraviolet absorption (Hermans & Scheraga, Reference Hermans and Scheraga1961a). The transition curves obtained by both techniques could be superposed on each other, indicating that the alteration of backbone conformation and the changes of environment of the tyrosyl groups parallel each other in the denaturation. Data were extracted from these transition curves and from related calorimetric measurements (Kresheck & Scheraga, Reference Kresheck and Scheraga1966), and the behavior at low pH was attributed to tyrosyl … carboxylate interactions.
10.1 Thermal unfolding
The equilibrium pathway for the thermal unfolding of RNase A was probed by proteolysis whereby peptide bonds in only unfolded portions of the chain are hydrolyzed, and by other spectroscopic methods (Burgess & Scheraga, Reference Burgess and Scheraga1975). These experiments were interpreted in terms of a thermally induced folding/unfolding pathway with specific intermediates forming as the temperature increased (Burgess & Scheraga, Reference Burgess and Scheraga1975). The details of this pathway were refined by subsequent measurements (Matheson & Scheraga, Reference Matheson and Scheraga1979; Navon et al. Reference Navon, Ittah, Laity, Scheraga, Hass and Gussakovsky2001).
10.2 Denaturant-induced unfolding
In studying guanidine hydrochloride-induced denaturation of disulfide-intact RNase A., Kim & Baldwin (Reference Kim and Baldwin1982) and Schmid (Reference Schmid1986) described stopped-flow unfolding/folding experiments, which indicated that there are several refolding phases: a fast-folding phase (UF), a major slow-folding phase (USII), and a minor very-slow-folding phase (USI), accounting for 20, 65 and 15%, respectively, of the refolding amplitude. By varying the refolding conditions, new kinetic phases were identified by Houry et al. (Reference Houry, Rothwarf and Scheraga1994) in addition to the above three. At low pH, UF resolves into a very-fast-folding unfolded species, Uvf (with native proline isomers), plus a fast-folding species denoted UF (with the wrong Pro 114 isomer), that involves cis/trans proline isomerization, and a small medium-refolding phase Um. Uvf is always present in the equilibrium unfolded protein at low pH and constitutes 6% of the unfolded species. If the protein is allowed to unfold for a time sufficient for conformational unfolding but before the prolines have had time to isomerize, then Uvf is captured to the extent of ~100% (Houry et al. Reference Houry, Rothwarf and Scheraga1994). Therefore, folding studies of Uvf reveal conformational features without complications from cis/trans isomerization.
11. Folding pathways of reduced RNase A
The experimental work on identifying hydrogen bonds in native RNase A (Scheraga, Reference Scheraga1967, Reference Scheraga, Nicholson and Bujnicki2011b) was accompanied by an experimental approach to identify the pathways from the unfolded form of this protein (with its disulfide bonds reduced to sulfhydryl groups) to the oxidatively folded protein to form its four native disulfide bonds. These oxidative-folding experiments were carried out on RNase A, first, with oxidized-and-reduced glutathione (Scheraga, Reference Scheraga, Nicholson and Bujnicki2011b; Scheraga et al. Reference Scheraga, Konishi and Ooi1984, Reference Scheraga, Konishi, Rothwarf and Mui1987) but, later, to simplify the number of folding intermediates, with oxidized-and-reduced dithiothreitol (Rothwarf et al. Reference Rothwarf, Li and Scheraga1998; Scheraga, Reference Scheraga, Nicholson and Bujnicki2011b).
11.1 Oxidative folding
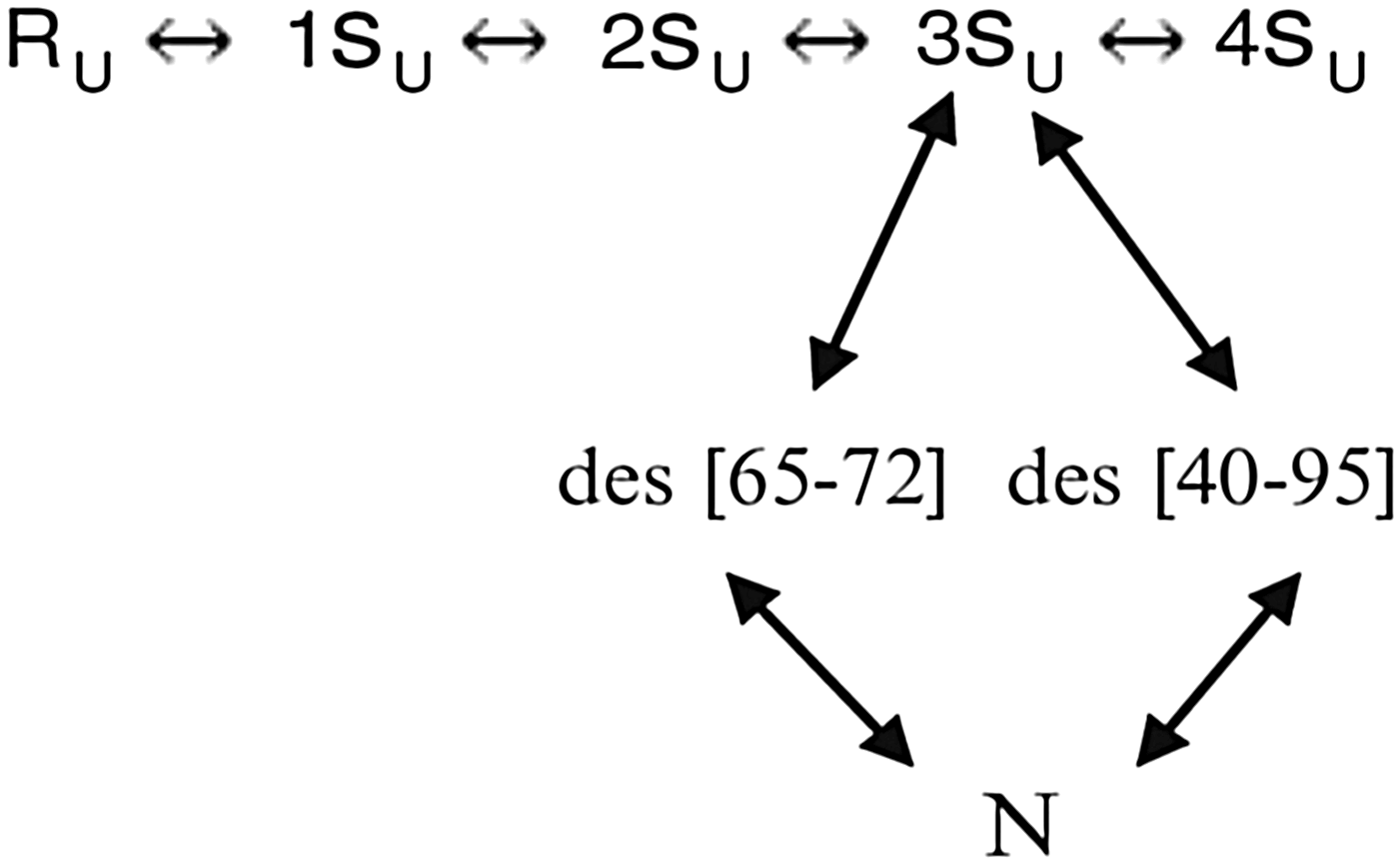
Two pathways, in the presence of dithiothreitol, in which the rate-determining step involved SH/S–S interchange to form the native-like three-disulfide-bonded species des [65–72] and des [40–95] from the large 3Su unfolded ensemble, were identified (Rothwarf et al. Reference Rothwarf, Li and Scheraga1998), as shown in Fig. 9.
Two major pathways for oxidative folding of RNase A in the presence of dithiothreitol.
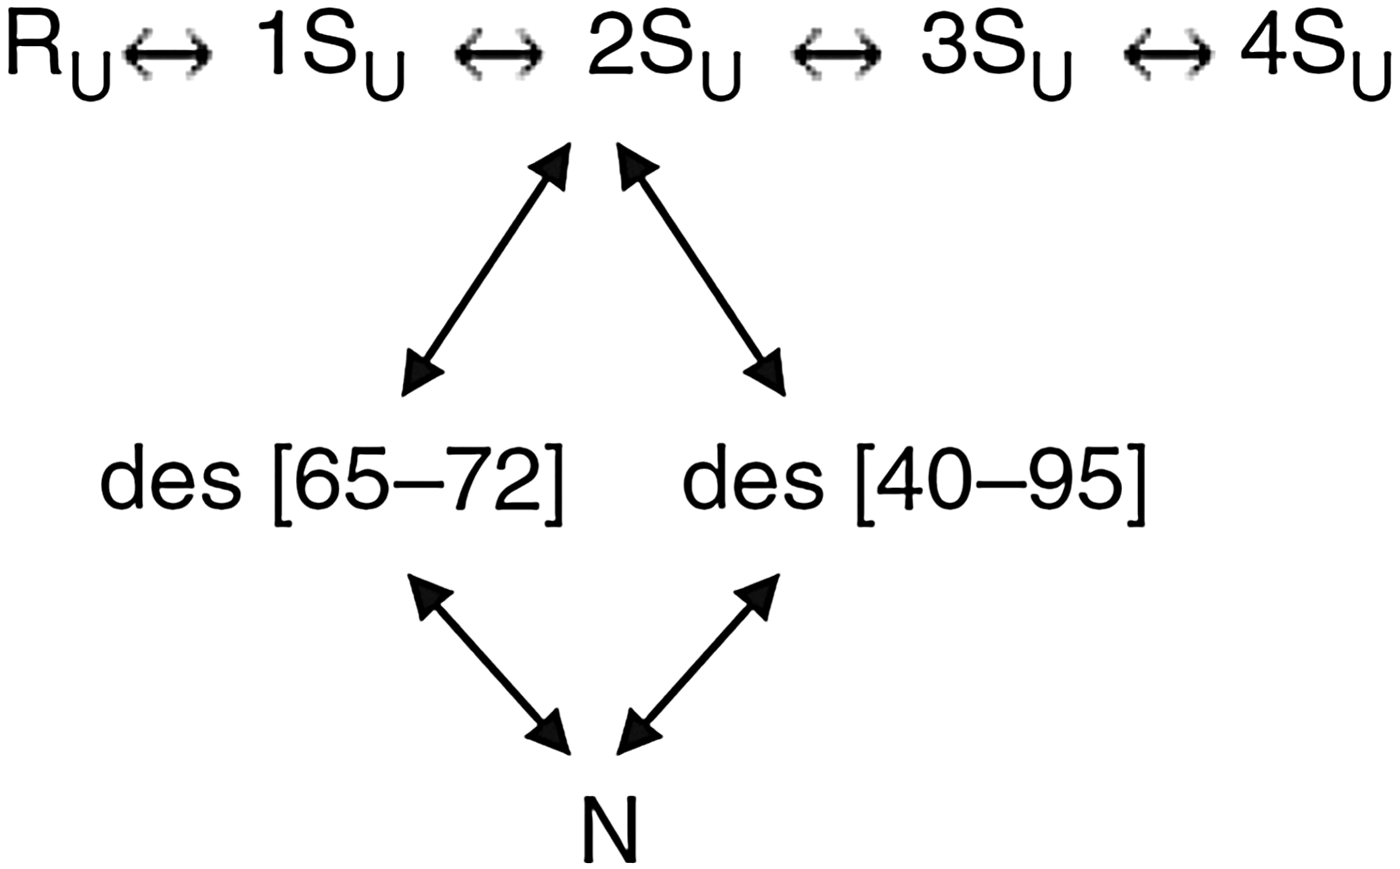
Two other pathways, in which these two disulfide-bonded species, des [65–72] and des [40–95], are formed by oxidation from the large 2Su unfolded ensemble, rather than by SH/S–S interchange of the 3Su ensemble, were also identified (Iwaoka et al. Reference Iwaoka, Juminaga and Scheraga1998, Xu & Scheraga, Reference Xu and Scheraga1998), as shown in Fig. 10.
Two minor pathways for oxidative folding of RNase in the presence of dithiothreitol.
In the initial folding stage, the unfolded one-disulfide ensemble 1SU is dominated by formation of the 65–72 disulfide bond. (Xu et al. Reference Xu, Rothwarf and Scheraga1996)
11.2 Oxidative folding of onconase
A ribonuclease homolog, onconase (ONC), also has four disulfide bonds and a three-dimensional structure similar to that of RNase A. Three of the disulfide bonds of ONC and RNase A are in homologous positions, but the fourth one in RNase A, between Cys 65 and Cys 72, which is the dominant disulfide bond to form in the initial folding pathways of RNase A (Xu et al. Reference Xu, Rothwarf and Scheraga1996), is in a different, non-homologous, position in ONC. This motivated an analogous study of the oxidative folding of ONC (Gahl & Scheraga, Reference Gahl and Scheraga2009) with dithiothreitol, which indeed led to different folding pathways than those observed in RNase A. Thus, these two homologous proteins fold by very different pathways.
12. Origin of theory to treat protein folding
The experimental work discussed in Sections 2–11 was preparatory to the theoretical approach to protein-folding computations, discussed from here on. Based on the distance constraints arising from hydrogen bonds that we had obtained in our experimental studies of the structure of RNase A in Section 9 (Scheraga, Reference Scheraga1967), in addition to the known locations of its four disulfide bonds, we began to develop a molecular mechanics treatment of protein structures (Némethy & Scheraga, Reference Némethy and Scheraga1965). The initial idea was to build a structure of RNase A based on the distance constraints together with a hard-sphere potential, and to discard those structures that violated the principles of the Ramachandran diagram (Némethy & Scheraga, Reference Némethy and Scheraga1965), and later to replace the hard-sphere potential by introducing other terms of a developing force field (Scheraga, Reference Scheraga1968). Subsequently, we examined the basic principles of molecular mechanics as applied to protein structure determination (N. Gō & Scheraga (Reference Gō and Scheraga1969, Reference Gō and Scheraga1976)}.
12.1 Use of fixed geometry
Since equilibrium conformations of macromolecules depend on contributions from internal vibrations, we analyzed such vibrations, in the absence and presence of solvent, from a quantum-statistical mechanical point of view (N. Gō & Scheraga, Reference Gō and Scheraga1969). The internal vibrations were divided into two classes: (1) bond stretching and bond angle bending, and (2) torsional rotations around single bonds. Later, the consequences of either fixing the bond lengths and the bond angles at the outset with constraints (the classical rigid model), or to conceptually allow them to vary under an infinitely strong potential (the classical flexible model) were examined (N. Gō & Scheraga, Reference Gō and Scheraga1976). A quantitative analysis of the approximations involved in each of the two models revealed that, of the two non-equivalent classical treatments; the classical flexible model is better than the classical rigid model. The results of this analysis do not imply that bond lengths and bond angles actually have to be varied for the classical flexible model. With the independent variables being torsional angles, the bond lengths and bond angles are varied only conceptually. Therefore, in actual calculations of the conformational properties of a polymer chain, we may use fixed geometry, i.e., fixed bond lengths and bond angles (N. Gō & Scheraga, Reference Gō and Scheraga1976), as is done in ECEPP (Momany et al. Reference Momany, Mcguire, Burgess and Scheraga1975, my most-cited paper). A comparison between the results of ECEPP, with fixed geometry, and CHARMM and AMBER, with flexible geometry, has been presented by Roterman et al. (Reference Roterman, Lambert, Gibson and Scheraga1989).
13. Protein folding accompanying the development of ECEPP
Our force field was developed from the initial work of Némethy & Scheraga (Reference Némethy and Scheraga1965) and Scheraga (Reference Scheraga1968) to the first version of ECEPP (Momany et al. Reference Momany, Mcguire, Burgess and Scheraga1975). The total ECEPP intra-molecular potential energy U between atoms was partitioned (Eq. (13)) into the non-bonded repulsion and dispersion attraction, electrostatic, hydrogen-bond, and several intrinsic torsional potential terms listed in the following equations (Momany et al. Reference Momany, Mcguire, Burgess and Scheraga1975):
 $$U = U_{{\rm NB}} (r_{ij} ) + U_{{\rm el}} (r_{ij} ) + U_{{\rm HB}} (r_{H \cdots x} ) + U_{{\rm TOR}} ({\rm \theta} ) + U{\rm (}\omega {\rm )} + U({\rm \chi} ),$$
 $$U_{{\rm NB}} (r_{ij} ) = FA^{k1} /r_{ij} ^{12} - C^{kl} /r_{ij} ^6, $$
 $$U_{{\rm el}} (r_{ij} ) = 332q_i q_j /Dr_{ij},$$
 $$U_{{\rm HB}} (r_{H \cdots X} ) = A{\rm ^{\prime}}_{H \cdots X} /r_{H \cdots X} ^{12} - B_{H \cdots X} /r_{H \cdots X} ^{10}, $$
 $$U_{{\rm TOR}} (\theta ) = (U_0 /{\rm 2})({\rm 1} \pm {\rm cos \, n}\theta ),{\rm where}\,\theta = {\varphi} \,{\rm or}\; \psi, {\rm the \,backbone \,torsional \,angles,}$$
 $$U(\omega ) = (U_\omega /2)\,(1 - \cos 2\omega )\,{\rm with}\,\omega \,{\rm pertaining}\,{\rm to}\,{\rm the}\,{\rm peptide}\,{\rm bond}\,{\rm torsional}\,{\rm angle},$$
 $$U(\chi ) = [U_0 (\chi )/2]\,[1 + \cos\,n\chi ]$$
for χ1, and similar equations for torsional angles of longer side chains.
See Momany et al. (Reference Momany, Mcguire, Burgess and Scheraga1975) and Arnautova et al. (2006) for discussion of these and later terms respectively, and related treatment of hydration (Arnautova et al. 2006).
13.1 Global optimization of ECEPP
Over the years, ECEPP was upgraded to ECEPP/2 (Némethy et al. Reference Némethy, Pottle and Scheraga1983), ECEPP/3 Némethy et al. Reference Némethy, Gibson, Palmer, Yoon, Paterlini, Zagari, Rumsey and Scheraga1992), and ECEPP-05 (Arnautova et al. Reference Arnautova, Jagielska and Scheraga2006). In addition to the development of the ECEPP force field, it was necessary to obtain an efficient procedure to search the multidimensional conformational energy space for the global minimum of the conformational energy, according to the thermodynamic hypothesis of Anfinsen (Reference Anfinsen1973). Consequently a menu of energy-minimization procedures was developed (Scheraga et al. Reference Scheraga, Pillardy, Liwo, Lee, Czaplewski, Ripoll, Wedemeyer and Arnautova2002a). Among the many effective search procedures were Monte Carlo with minimization (MCM) (Li & Scheraga, Reference Li and Scheraga1987, Reference Li and Scheraga1988; Wales & Scheraga, Reference Wales and Scheraga1999); Electrostatically driven Monte Carlo (EDMC) (Ripoll & Scheraga, Reference Ripoll and Scheraga1988, Reference Ripoll and Scheraga1989; Ripoll et al. Reference Ripoll, Liwo and Scheraga1998); diffusion equation method (DEM) (Piela et al. Reference Piela, Kostrowicki and Scheraga1989; Kostrowicki et al. Reference Kostrowicki, Piela, Cherayil and Scheraga1991; Kostrowicki & Scheraga, Reference Kostrowicki and Scheraga1992, Reference Kostrowicki and Scheraga1996); conformational space annealing (CSA) (Lee & Scheraga, Reference Lee and Scheraga1999; Lee et al. Reference Lee, Scheraga and Rackovsky1997, Reference Lee, Scheraga and Rackovsky1998); and conformational family Monte Carlo (CFMC) (Pillardy et al. Reference Pillardy, Czaplewski, Wedemeyer and Scheraga2000, Reference Pillardy, Czaplewski, Liwo, Lee, Ripoll, Kazmierkiewicz, Oldziej, Wedemeyer, Gibson, Arnautova, Saunders, Ye and Scheraga2001), which were the most efficient.
13.2 Applications of ECEPP to homopolymers
The preliminary versions of ECEPP were applied to the following processes. Initially, a conformational analysis was carried out on several homopolyamino acids to determine whether the left- or right-handed α-helical form of each was the energetically preferred one (Ooi et al. Reference Ooi, Scott, Vanderkooi and Scheraga1967; Yan et al. Reference Yan, Vanderkooi and Scheraga1968). In each case, the predicted helix sense agreed with experimental results. In the particular helical structures of the o-, m-, and p- chlorobenzyl esters of poly-L-aspartic acid, the ortho and meta isomers were found to form left-handed α-helices; the para isomer formed a right-handed one (Yan et al. Reference Yan, Momany and Scheraga1970). The predictions for the ortho, meta, and para isomers were subsequently verified by experiment (Erenrich et al. Reference Erenrich, Andreatta and Scheraga1970). An analysis revealed those energy contributions of ECEPP that influence the helix sense in these three polymers (Yan et al. Reference Yan, Momany and Scheraga1970).
13.3 Applications of ECEPP to Zimm–Bragg theory and linear and cyclic peptides
Other types of computations were applied to the molecular theory of the helix–coil transition (N. Gō et al. Reference Gō, Gō and Scheraga1968; M. Gō et al. Reference Gō, Gō and Scheraga1970, Reference Gō, Gō and Scheraga1971, Reference Gō, Hesselink, Gō and Scheraga1974; M. Gō & Scheraga, Reference Gō and Scheraga1984), and to compute the Zimm–Bragg parameters s and σ for several homopolyamino acids. An early calculation with ECEPP (Isogai et al. Reference Isogai, Némethy and Scheraga1977) produced a structure of the five-residue linear peptide Met-enkephalin. Also, consideration was given to the formation of exactly closed cyclic polyamino acids without symmetry restrictions (N. Gō & Scheraga, Reference Gō and Scheraga1970a, Reference Gō and Scheragab, Reference Gō and Scheraga1973b; N. Gō et al. Reference Gō, Gō and Scheraga1970; Niu et al. Reference Niu, Go and Scheraga1973) and those with symmetry (N. Gō & Scheraga, Reference Gō and Scheraga1973a). A particular structure of interest was gramicidin S, a cyclic decapeptide with C2 symmetry. The C2–symmetric structure computed with ECEPP had a β-pleated-sheet type conformation. Since there was no x-ray or NMR structure with which to compare the computed structure, the all-atom Cartesian coordinates were published (Dygert et al. Reference Dygert, Gō and Scheraga1975). Later, Mirau & Bovey (Reference Mirau and Bovey1990) carried out a 2D NMR study of gramicidin S and, instead of performing the usual NMR analysis to determine the structure, they used the published Cartesian coordinates of Dygert et al. to compute a two-dimensional (2D) NMR spectrum for comparison with their experimental one, and obtained good agreement for the α-carbon coordinates. A larger structure than gramicidin S was computed by homology modeling with the earlier force field, namely α-lactalbumin (Warme et al. Reference Warme, Momany, Rumball, Tuttle and Scheraga1974) from the structure of lysozyme (see Section 18).
13.4 Applications of ECEPP to enzyme–substrate complexes
With an early version of ECEPP to treat globular proteins, the algorithm was applied to enzymes, substrates, and enzyme–substrate complexes for systems consisting of α-chymotrypsin and four of its aromatic substrates (Platzer et al. Reference Platzer, Momany and Scheraga1972b, Reference Platzer, Momany and Scheragac). The low-energy conformations of these isolated substrates agreed with available experimental data for the corresponding side chains in proteins, and with NMR and x-ray data for these side chains in small peptides (Platzer et al. Reference Platzer, Momany and Scheraga1972c). The calculated binding energies of all four substrates correlated with experimental binding constants (Platzer et al. Reference Platzer, Momany and Scheraga1972c).
14. Protein folding with ECEPP
With the availability of a refined version of ECEPP (Momany et al. Reference Momany, Mcguire, Burgess and Scheraga1975), enzyme–substrate complexes were re-visited, in particular for hen egg white lysozyme with hexasaccharide substrates consisting of alternating copolymers of N-acetylglucosamine (GlcNAc) and N-acetylmuramic acid (MurNAc) (Pincus & Scheraga, Reference Pincus and Scheraga1979, Reference Pincus and Scheraga1981).
14.1 Application of the refined version of ECEPP to lysozyme–substrate complexes
These copolymer substrates bind to six sites, A–F, in the active-site cleft of lysozyme, and the enzyme cleaves the bond between the fourth and fifth saccharide units. An x-ray structure (Imoto et al. Reference Imoto, Johnson, North, Phillips, Rupley and Boyer1972) provided the binding configuration of four saccharide units in sites A–D, and it was postulated that the last two saccharide units of the hexasaccaharide would adopt a ‘right-sided’ binding arrangement with a kink between the fourth and fifth saccharide units. The calculations showed that both ‘right-sided’ and ‘left-sided’ binding arrangements were energetically possible but that the ‘left-sided’ arrangement was preferable (Pincus & Scheraga, Reference Pincus and Scheraga1979). Subsequently, Smith-Gill et al. (Reference Smith-Gill, Rupley, Pincus, Carty and Scheraga1984) provided experimental evidence for the ‘left-sided’ binding mode of (GlcNAc)6.
14.2 Application of ECEPP to collagen models and fibrous proteins
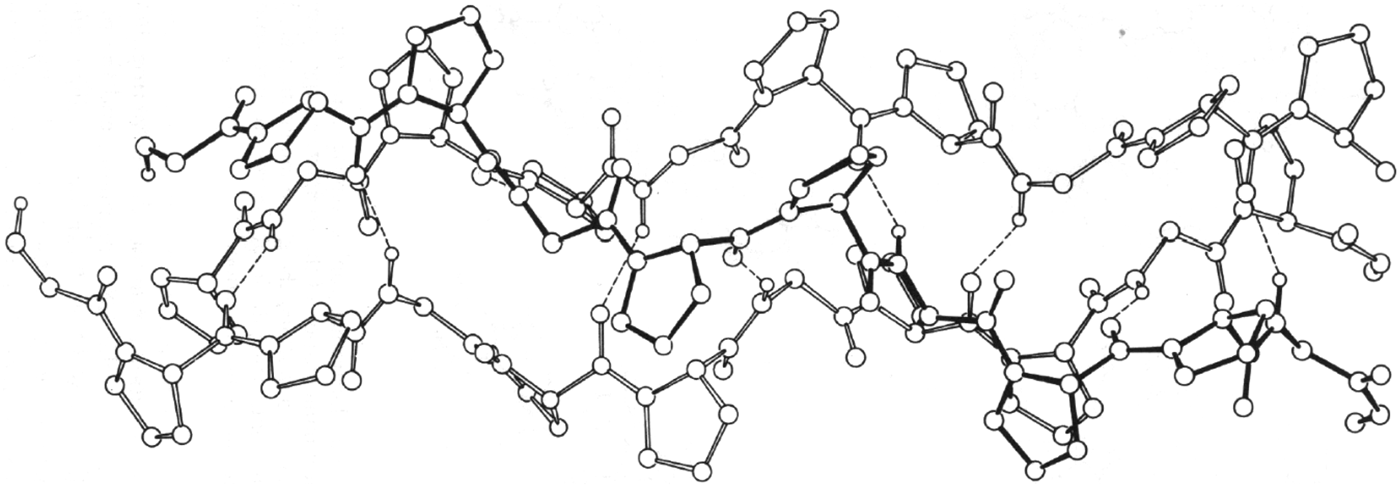
Simultaneously, ECEPP was applied to compute the structures of the three-stranded collagen model poly-(Gly–Pro–Pro) (Miller & Scheraga, Reference Miller and Scheraga1976) and other fibrous proteins (Fossey et al. Reference Fossy, Némethy, Gibson and Scheraga1991; Scheraga & Némethy, Reference Scheraga, Némethy, Maksic and Maksic1991). In the work of Miller and Scheraga, both intra-chain and inter-chain interactions were included, and both coiled coils with screw symmetry and parallel-chain complexes with either screw symmetry or rotational symmetry were considered. The lowest-energy coiled-coil structure (shown in Fig. 11) was in good agreement with experimental data. At the same time, geometrical criteria were elucidated for formation of single- and multiple-stranded coiled coils (Nishikawa & Scheraga, Reference Nishikawa and Scheraga1976).
Computed structure of poly-(Gly–Pro–Pro) with ECEPP (Miller & Scheraga, Reference Miller and Scheraga1976).
ECEPP was also used by Fossey et al. (Reference Fossy, Némethy, Gibson and Scheraga1991) to calculate the structures of the silk I form of the crystalline domains of Bombyx mori silk fibroin and the corresponding crystal form of poly (L–Ala–Gly). The sheet structure of silk I contains inter-strand hydrogen bonds but is composed of anti-parallel polypeptide chains whose conformation differs from that of the anti-parallel β-sheets that constitute the silk II structure. The main difference between the two structures is the orientation of the Ala side chains of neighboring strands in each sheet. In the Pauling-Corey β-sheet and in the silk II form, the Ala side chains of every strand point to the same side of a sheet. In the silk I structure, the side chains of Ala residues in adjacent strands point to opposite sides of the sheet. The computed energies for the two forms of poly (L–Ala–Gly) indicate that the silk–II-like form is more stable, by about 1.0 kcal mol−1 per residue.
14.3 Application of ECEPP to packing arrangements of fundamental structures of proteins
In the work of Chou et al. (Reference Chou, Némethy and Scheraga1990) and Scheraga & Némethy (Reference Scheraga, Némethy, Maksic and Maksic1991), the energetics of packing arrangements were computed for equivalent and non-equivalent α-helices, stabilization of the right-handed twist of β-sheets, effect of amino acid composition on the twist and relative stability of parallel and anti-parallel β-sheets, and the interaction between an α-helix and a β-sheet.
14.4 A related distance-constrained optimization approach
Wako & Scheraga (Reference Wako and Scheraga1982a, Reference Wako and Scheragab) provided a statistical analysis of protein conformation in terms of the distances between amino acid residues represented by their Cα atoms; with this distance-constraint approach, they examined the possibility to predict the three-dimensional structure of bovine pancreatic trypsin inhibitor (BPTI). By introducing additional information concerning the strong non-bonded interactions between the sulfur atoms of disulfide bonds and the side chains of aromatic amino acid residues of BPTI, mean-square deviation distances of predicted conformations of 2.2–3.2 Å were obtained from an optimized object function expressed in distances.
14.5 Application of ECEPP to fold globular proteins
The structure of the first globular protein computed with ECEPP, with inclusion of two different continuum hydration models, was the 46-residue triple-helical structure of protein A (Vila et al. Reference Vila, Ripoll and Scheraga2003). After an exhaustive search, starting from different random conformations with the EDMC global optimization method (Ripoll & Scheraga, Reference Ripoll and Scheraga1988, Reference Ripoll and Scheraga1989; Ripoll et al. Reference Ripoll, Liwo and Scheraga1998), with no knowledge-based information other than the amino acid sequence and the all-atom ECEPP force field, three of four runs led to native-like conformations (see Fig. 12). The fourth one led to a mirror-image conformation, the reason for which has now been proposed (Kachlishvili et al. Reference Kachlishvili, Maisuradze, Martin, Liwo, Vila and Scheraga2014). It was shown that the formation of the mirror-image conformation (see Fig. 13) may be caused by the presence of multiple local conformational states in the second loop and part of the third helix (Asp29–Asn35). Also, the ‘opening and closing’ of the first loop may assist protein A in overcoming the barrier, between the metastable mirror-image state and the native state, and fold to the native state. Because of the very small difference (a few kcal mol−1), between the total free energies of the mirror-image and the native conformation, it is impossible to identify only one particular type of interaction as being responsible for surmounting this kinetic trap during folding of protein A. Earlier (Lee et al. Reference Lee, Liwo and Scheraga1999b), two proteins, protein A and the 75-residue apo calbindin D9 K, had been folded with the coarse-grained force field UNRES, introduced later in Section 15.1. Both the native-like fold and its mirror image were found for these two proteins, but the explanation for formation of mirror images was not elucidated until the work of Kachlishvili et al. (Reference Kachlishvili, Maisuradze, Martin, Liwo, Vila and Scheraga2014).
Computed structure of the 46 – residue protein A with ECEPP. Upper left, a random starting conformation; upper right, native structure; lower left, computed structure with one hydration model; lower right, one of two computed structures with another hydration model (Vila et al. Reference Vila, Ripoll and Scheraga2003).
Proposed different folding pathways of protein A, without (a→c→f) and with (b→d→e→f) formation of a mirror-image conformation (Kachlishvili et al. Reference Kachlishvili, Maisuradze, Martin, Liwo, Vila and Scheraga2014).
14.6 Hydrophobic nucleation of protein folding
A model for nucleation sites in protein folding consists of local fluctuating hairpin-like structures formed from an extended chain in water (Matheson & Scheraga, Reference Matheson and Scheraga1978). The stability of such a local conformation is expressed as ΔG, the free energy of formation of such a local pocket from the extended form, with the residues within the pocket-forming hydrophobic bonds to overcome the entropy loss due to formation of the pocket. The complete amino acid sequence of a protein is searched for stable pockets in terms of the values of ΔG. The amount of entropy loss in pocket formation, to be compensated by the hydrophobic bonds within the pocket, determines the pocket size, i.e., the number of residues within the pocket. Pockets of various sizes, i.e., with various valves of ΔG, along the chain are identified; they reflect the local density of nonpolar residues along the chain.
According to Tanaka & Scheraga (Reference Tanaka and Scheraga1977), the several initial pockets along the chain acquire additional stabilization by interactions between nucleation sites in a second folding stage following the formation of the nucleation sites. In a third stage of folding, the groups of pockets formed in the second stage subsequently aggregate along a possible folding pathway. Such folding pathways can be represented on a triangle diagram both of whose axes are the residue numbers along the whole chain. In such a diagram, the nucleation sites, representing local interactions, appear on the diagonal of the triangle, and subsequent folding stages, i.e., formation of larger aggregates along a folding pathway, appear further and further from the diagonal, finally often bringing the N- and C- termini of the chain near to each other without having to pay the large entropy loss that would have occurred if the initial stage would have tried to bring the termini together as a first folding step.
As an example, Nemethy & Scheraga (Reference Némethy and Scheraga1979) proposed such a triangle diagram for a possible folding pathway for RNase A. Six nucleation sites appear on the diagonal with the most stable one appearing near the C-terminus of the chain which contains the highest concentration of non-polar residues. Thus, even though the chain emerges from the ribosome by adding residues from the N-terminus onward, productive folding does not occur until the residues near the C-terminus of RNase A have been added to the chain. According to Matheson & Scheraga (Reference Matheson and Scheraga1978), the most stable nucleation site among all possible ones can appear at any location along the chain, again reflecting the highest concentration of nonpolar residues. Nemethy & Scheraga (Reference Némethy and Scheraga1979) cited a variety of experimental results which confirm the identity of the strongest nucleation site predicted by Matheson & Scheraga (Reference Matheson and Scheraga1978) for RNase A. Among this experimental evidence is the observation that RNase A cannot fold if the C-terminus is truncated. Dyson et al. (Reference Dyson, Wright and Scheraga2006) provided further experimental evidence, from folding of mutant apomyoglobins, for models based on the hypothesis that folding initiation sites arise from hydrophobic interactions.
Work is now in progress to compute the folding pathway of the 124-residue RNase A with UNRES using the above information as constraints.
15. Protein folding with UNRES (coarse graining)
Recognizing that the all-atom approach could not be extended to proteins containing more than 46 residues, as in protein A, with the available computer power, we developed a coarse-grained model, and discussed the associated force field, referred to as UNRES by Liwo et al. (Reference Liwo, Czaplewski, Pillardy and Scheraga2001). UNRES was developed to investigate two aspects of research on large proteins: (1) prediction of protein structure from its primary sequence; (2) provide an understanding of the dynamics and thermodynamic of protein-folding processes.
15.1 The UNRES force field
UNRES is a physics-based force field derived as a restricted free energy (RFE) function of an all-atom polypeptide chain plus the surrounding solvent, which corresponds to averaging the energy over the degrees of freedom that are neglected in the united-residue model (Liwo et al. Reference Liwo, Oldziej, Pincus, Wawak, Rackovsky and Scheraga1997a, Reference Liwo, Pincus, Wawak, Rackovsky, Oldziej and Scheragab, Reference Liwo, Kaźmierkiewicz, Czaplewski, Groth, Oldziej, Wawak, Rackovsky, Pincus and Scheraga1998, Reference Liwo, Lee, Ripoll, Pillardy and Scheraga1999a, Reference Liwo, Pillardy, Kaźmierkiewicz, Wawak, Groth, Czaplewski, Oldziej and Scheragab, Reference Liwo, Pillardy, Czaplewski, Lee, Ripoll, Groth, Rodziewicz-Motowidlo, Kaźmierkiewicz, Wawak, Oldziej, Scheraga, Shamir, Miyano, Istrail, Pevzner and Waterman2000, Reference Liwo, Czaplewski, Pillardy and Scheraga2001, Reference Liwo, Khalili and Scheraga2005, Reference Liwo, Czaplewski, Oldziej, Rojas, Kaźmierkiewicz, Makowski, Murarka, Scheraga and Voth2008); the RFE is factored into one-, two-, and multibody terms, using the cluster-cumulant expansion of Kubo (Reference Kubo1962). New types of multibody or correlation terms were introduced by Liwo et al. (Reference Liwo, Czaplewski, Pillardy and Scheraga2001), Sieradzan et al. (Reference Sieradzan, Hansmann, Scheraga and Liwo2012a, Reference Sieradzan, Scheraga, Liwo, Carloni, Hansmann, Lippert, Meinke, Mohanty, Nadler and Zimmermannb), and Krupa et al. (Reference Krupa, Sieradzan, Rackovsky, Beranowski, Oldziej, Scheraga, Liwo and Czaplewski2013). The UNRES model is shown in Fig. 14, and the force field is given by Eq. (20). In this model, the polypeptide chain is represented by a sequence of α-carbon (Cα) atoms linked by virtual bonds with attached side chains (SC) and united peptide groups (p). Each united peptide group is located in the middle between the consecutive α-carbons. Only these united peptide groups and united side chains serve as interaction sites, the α-carbons serving only to define the chain geometry, as shown in Fig. 14.
$$\eqalign{U = & \sum\limits_j {\sum\limits_{i \lt j} {U_{SC_i SC_j}} +} w_{SCp} \sum\limits_j {\sum\limits_{i \ne j} {U_{SC_i p_j}} +} w_{\,pp}^{{\rm el}}\, f_2 (T)\sum\limits_j {\sum\limits_{i \lt j - 1} {U_{\,p_i p_j} ^{{\rm el}}} +} w_{\,pp}^{{\rm vdW}} \sum\limits_j {\sum\limits_{i \lt j - 1} {U_{\,p_i p_j} ^{{\rm vdW}}}} \cr & + w_{{\rm tor}} \,f_2 (T)\sum\limits_i {U_{{\rm tor}} (\gamma _i )} + w_{{\rm tor}d} \,f_3 (T)\sum\limits_i {U_{{\rm tor}d} (\gamma _i, \gamma _{i + 1} )} + w_{sc{\rm tor}} \,f_2 (T)\sum\limits_i {U_{sc{\rm tor};i,i + 1}} \cr & + w_b \sum\limits_i {U_b (\theta _i, \gamma _{i - 1}, \gamma _{i + 1} )} + w_{rot} \sum\limits_i {U_{{\rm rot},i}} + \sum\limits_{m = 2}^{N_{{\rm corr}}} {w_{{\rm corr}}^{(m)} \,f_m (T)U_{{\rm corr}}^{(m)}} + w_{{\rm turn}}^{(3)} \,f_3 (T)U_{{\rm turn}}^{(3)} \cr & + w_{{\rm turn}}^{(4)} \,f_4 (T)U_{{\rm turn}}^{(4)} + w_{{\rm turn}}^{(6)} \,f_6 (T)\,U_{{\rm turn}}^{(6)} + w_{{\rm bond}} U_{{\rm bond}} (d_i ) + w_{SS} \sum\limits_{\scriptstyle {\rm disulfide} \atop \scriptstyle {\rm bonds} } {U_{SS_i}} + n_{SS} E_{SS}} $$with
 $$f_n (T) = \displaystyle{{\ln [\exp (1) + \exp ( - 1)]} \over {\ln \{ \exp [(T/T_0 )^{n - 1} ] + \exp [ - (T/T_0 )^{n - 1} ]\}}}, $$
where T 0=300 K. The temperature-scaling multipliers f n (T) were introduced by Liwo et al. (Reference Liwo, Khalili, Czaplewski, Kalinowski, Oldziej, Wachucik and Scheraga2007); this paper should be consulted for a description of the terms in these equations. In particular, the solvent is included implicitly in the SCi-SCj terms (Makowski et al. Reference Makowski, Liwo and Scheraga2011) as an example.
Illustration of internal coordinates pertaining to the ith residue used in Eq. (20): backbone virtual-bond-valence angles (θ i), backbone virtual-bond-dihedral angle (γ i), side-chain virtual-bond length (bsc i), and the angles a, and βsc i defining the position of the ith side chain with respect to the local coordinate frame defined by  $C_{i - 1}^\alpha , \,C_i^\alpha , \,C_{i + 1}^\alpha $. All peptide groups are assumed to be in the planar trans configuration with an equilibrium virtual-bond length of 3.8 Å (Liwo et al. Reference Liwo, Czaplewski, Pillardy and Scheraga2001).
With extensive parallelization of the components of UNRES (Liwo et al. Reference Liwo, Oldziej, Czaplewski, Kleinerman, Blood and Scheraga2010), it became possible to simulate protein structures containing as many as 500 residues.
15.2 Global optimization of UNRES with CSA (conformational space annealing)
UNRES is used as the first step of a hierarchical model to simulate the folding of single-chain proteins to locate the region in which the global minimum of the UNRES function might lie. Global Optimization of UNRES is carried out using the CSA method (Lee et al. Reference Lee, Scheraga and Rackovsky1997, Reference Lee, Scheraga and Rackovsky1998, Reference Lee, Liwo, Ripoll, Pillardy and Scheraga1999a). This is the key stage of the algorithm. The lowest-energy structures obtained from this exercise are then converted to the all-atom representation (Kaźmierkiewicz et al. Reference Kaźmierkiewicz, Liwo and Scheraga2002, Reference Kaźmierkiewicz, Liwo and Scheraga2003), and these all-atom structures are globally optimized in the local region with ECEPP.
15.3 Parameterization of the UNRES force field
The optimization procedure (Liwo et al. Reference Liwo, Arlukowicz, Czaplewski, Oldziej, Pillardy and Scheraga2002, Reference Liwo, Arlukowicz, Oldziej, Czaplewski, Makowski and Scheraga2004; Oldziej et al. Reference Oldziej, Liwo, Czaplewski, Pillardy and Scheraga2004), namely hierarchical optimization of the protein energy landscape of the UNRES force field, includes several steps. The key one is the optimization of the energy gap and Z score between the native-like and non-native structures. This method requires prior knowledge of the structural aspects as well as the folding processes of training proteins to divide the protein folding processes into different levels, e.g., for the IgG-binding domain from streptococcal protein G., which has two β-strands and an α-helix (numbered from the N- to the C-terminus as β1, α2, β3). One of the possible options is to assign level 1 to structures with either β3 or α2, level 2 to structures with both β3 and α2, level 3 to structures with β3, α2, and the N-terminal strand packed against α2 (with β1 still not fully formed), and level 4 to structures with β1, α2, and β3, with β3 being packed to β1, which also implies the packing of β1 and β3 against α2. This optimization was successful and resulted in a reasonably transferable force field that led to well-foldable proteins. This corroborates the conclusion from our on-lattice model studies (Liwo et al. Reference Liwo, Arlukowicz, Oldziej, Czaplewski, Makowski and Scheraga2004) that a proper design of the structural hierarchy is of crucial importance for foldability with the resulting potential-energy function.
After the introduction of the new physics-based virtual-bond-angle bending and side-chain-rotamer potentials, an extensive search was carried out in the energy-parameter space of the coarse-grained UNRES force field for large-scale ab initio simulations of protein folding (He et al. Reference He, Xiao, Liwo and Scheraga2009) to obtain a new set of parameters, which was used in CASP9 and CASP10.
15.4 Results with UNRES
With the above procedure, we obtained a good predicted structure (Lee et al. Reference Lee, Liwo, Ripoll, Pillardy, Saunders, Gibson and Scheraga2000) in the CASP 3 exercise, shown in Fig. 15. Following this good prediction, we began to use Langevin dynamics to compute protein structure and folding pathways (Khalili et al. Reference Khalili, Liwo, Rakowski, Grochowski and Scheraga2005a, Reference Khalili, Liwo, Jagielska and Scheragab). Five structures of single-chain globular proteins with sizes ranging from 89 to 140 amino acid residues were predicted (Liwo et al. Reference Liwo, Lee, Ripoll, Pillardy and Scheraga1999a, Reference Liwo, Khalili and Scheraga2005); one of them is illustrated in Fig. 16.
Structure of protein HDEA in the CASP 3 exercise; superposition of the red (computed with UNRES and CSA) on the yellow (experimental) structures (Lee et al. Reference Lee, Liwo, Ripoll, Pillardy, Saunders, Gibson and Scheraga2000).
Folding pathway of 1E0 G obtained in Langevin dynamics simulations with UNRES, starting from a fully-extended structure (Liwo et al. Reference Liwo, Khalili and Scheraga2005).
Subsequently, the single-chain approach with UNRES/MD was generalized to treat the folding pathways of multiple-chain proteins (Rojas et al. Reference Rojas, Liwo and Scheraga2007) from an extended conformation without imposing symmetry constraints, (see Fig. 17). The extension to multiple-chain proteins facilitated the computations of Aβ (Rojas et al. Reference Rojas, Liwo, Browne and Scheraga2010, Reference Rojas, Liwo and Scheraga2011) (Fig. 18), protein interacting with C kinase 1 (PICK 1) (He et al. Reference He, Liwo, Weinstein and Scheraga2011) (Fig. 19), the chaperonin Hsp70 (Golas et al. Reference Golas, Maisuradze, Senet, Oldziej, Czaplewski, Scheraga and Liwo2012) (Fig. 20), and several targets from CASPI0 blind tests especially one with twofold symmetry, shown in Fig. 21 (He et al. Reference He, Mozelewska, Krupa, Sieradzan, Wirecki, Liwo, Kachlishvili, Rackovsky, Jagiela, Slusarz, Czaplewski, Oldziej and Scheraga2013b). (see Section 21 on biological models)
Folding pathway of the two-chain protein 1G6U, obtained in Langevin dynamics simulations with UNRES, starting from fully-extended structures (Rojas et al. Reference Rojas, Liwo and Scheraga2007).
Assembly of Aβ fibrils, showing an initially-fully-extended monomer structure binding to a fibril. A partial α-helix forms along the following pathway but this undergoes a transition to a hairpin – like structure (Rojas et al. Reference Rojas, Liwo, Browne and Scheraga2010).
(a) and (b) are the initial structures with the PDZ domain pulled away in two different directions from the BAR domains, selected for subsequent UNRES simulations of the PICK1 dual-BAR construct; (c) representative structure for the top cluster from the UNRES/MREMD simulations starting from (a); (d) representative structure for the top cluster from the UNRES/MREMD simulations starting from (b) (He et al. Reference He, Liwo, Weinstein and Scheraga2011).
Rotation of NBD-I with respect to NBD-II of Hsp70 (illustrated in different positions), which brings SBD-β close to the back side of NBD-II (Golas et al. Reference Golas, Maisuradze, Senet, Oldziej, Czaplewski, Scheraga and Liwo2012).
The experimental 4EXR structure of target T0663 with twofold symmetry is on the left; our model 1 is in the middle, and our model 4 is on the right (He et al. Reference He, Mozelewska, Krupa, Sieradzan, Wirecki, Liwo, Kachlishvili, Rackovsky, Jagiela, Slusarz, Czaplewski, Oldziej and Scheraga2013b).
15.5 Free energy versus potential energy
While molecular modeling procedures were being developed, emphasis was placed on minimizing potential energy. However, the minimum with the lowest potential energy corresponds to the most probable conformation at T = 0 K and neglects the conformational entropy. By introducing temperature dependence to the UNRES force field (Section 15.1) by varying β in the cumulant expansion (Liwo et al. Reference Liwo, Khalili, Czaplewski, Kalinowski, Oldziej, Wachucik and Scheraga2007), the resulting simulations were based on free energy instead of potential energy. Molecular dynamics, on the other hand, finds the basin with the lowest free energy at a given temperature, which might happen to, but does not have to, contain the conformation with the lowest potential energy. Prior to 2007 (Liwo et al. Reference Liwo, Lee, Ripoll, Pillardy and Scheraga1999a, Reference Liwo, Khalili and Scheraga2005), the UNRES force field was used for simulations at constant temperature but, with the introduction of temperature with Eq. (20), and the consequent inclusion of entropic effects, it became possible to compute not only structures of proteins but also their thermodynamic properties.
15.6 Proteins as ensembles
Because of the intrinsic mobility of protein structures, a protein should be regarded as an ensemble of conformations rather than as a single one. Consequently, NMR spectroscopists report protein ‘structure’ as an ensemble of, usually, 20 different conformations. Hence, any observed physical property should be thought of as an average over such an ensemble.
The same description should be applied to an x-ray determined ‘structure’, despite the practice that crystallogrophers generally report only one conformation. As Arnautova et al. (Reference Arnautova, Vila, Martin and Scheraga2009) have shown, it is possible to identify an ensemble of conformations that satisfies the electron density obtained in an x-ray study, as well as the usually reported single structures, and hence compute an ensemble-average of any physical property. In this way, the question of the relation of ensemble-averaged structures obtained by NMR and x-ray diffractions studies can be addressed.
An ensemble of structures of a native protein can be characterized by the dependence of the mean-square displacements of dihedral angles, defined by four successive Cα atoms (Senet et al. Reference Senet, Maisuradze, Foulie, Delarue and Scheraga2008) or by rotational motions of backbone N–H bonds (Cote et al. Reference Cote, Senet, Delarue, Maisuradze and Scheraga2010), on a power law of time, tα, with α between 0.1 and 0.4 at 300 K (α = 1 corresponds to Brownian diffusion). The value of α reflects the environment of a given residue. Residues with low values of α are located mainly in well-defined secondary elements and adopt one conformational substrate. Residues with high values of α are found in loops/turns and chain ends and exist in multiple conformational substates, i.e., they move on multiple-minima free-energy profiles (Senet et al. Reference Senet, Maisuradze, Foulie, Delarue and Scheraga2008). High correlations have been found between backbone and side-chain motions, but only in flexible regions of a protein for a few residues which contribute the most to the slowest collective modes of the molecule; these flexible regions may play a role in biological function and in protein folding (Cote et al. Reference Cote, Senet, Delarue, Maisuradze and Scheraga2012).
15.7 Validation of experimental structures with computed carbon chemical shifts
In order to validate experimental NMR and x-ray structures of proteins, Vila et al. (Reference Vila, Villegas, Baldoni and Scheraga2007) began an investigation to provide a large set of conformationally dependent 13Cα, and later 13Cβ, chemical shifts computed by density-functional theory (DFT), to compare them with experimental values of chemical shifts. This procedure offers a criterion for an accurate assessment of the quality of NMR-derived conformations, examines whether x-ray or NMR-solved structures are better representations of the observed 13Cα and 13Cβ chemical shifts in solution, provides evidence indicating that the proposed methodology is more accurate than automated predictors for validation of protein structures, sheds light as to whether the agreement between computed and observed 13Cα and 13Cβ chemical shifts is influenced by the identity of amino acid residues or by their location in the sequence, and provides evidence confirming the presence of dynamics of proteins in solution, hence showing that an ensemble of conformations is a better representation of the structure in solution than any single conformation, as pointed out in Section 15.6. Vila & Scheraga (Reference Vila and Scheraga2009), Vila et al. (Reference Vila, Arnautova, Martin and Scheraga2009a, Reference Vila, Baldoni and Scheragab), and Martin et al. (Reference Martin, Vila and Scheraga2012, Reference Martin, Arnautova, Icazatti, Scheraga and Vila2013) provided additional details for these validation procedures, including an internet server to enable experimentalists to validate their own NMR or x-ray structures.
An example of this validation procedure is its application to the determination of the fraction of the tautomeric forms of the imidazole ring of histidine in a protein as a function of pH, provided that the observed 13Cγ and 13Cδ2 chemical shifts and the protein structure, or the fraction of the H+ form, are known (Vila et al. Reference Vila, Arnautova, Vorobjev and Scheraga2011). The method is based on the use of DFT calculations of the 13C NMR shieldings of all the imidazole ring carbons (13Cγ, 13Cδ2, and 13Cε1) for each of the two tautomers Nε1–H and Nδ2–H and the protonated form, H+, of histidine. This method was applied to estimate the fraction of the tautomeric forms of the imidazole ring among different histidines in the same protein (Vila et al. Reference Vila, Arnautova, Vorobjev and Scheraga2011) reflecting the importance of the environment of the histidines in determining the relative population of the tautomeric forms.
16. Protein–protein interactions
As cited in Section 3, experimental studies of the polymerization of fibrin monomer led to staggered overlap rod-like polymers (Fig. 2). Calorimetric measurements of the polymerizing process led to the conclusion (Sturtevant et al. Reference Sturtevant, Laskowski, Donnelly and Scheraga1955; Scheraga, Reference Scheraga2004) that side chain–side chain hydrogen bonds were involved in the polymerization.
Theoretical studies were also carried out to compute the structures of protein complexes based on protein–protein interactions. These include the hydrogen-bonds and hydrophobic interactions in systems such as Aβ, cited in Section 21.1.
In general, to calculate the structures of protein–protein complexes, it is necessary to start with an ensemble of structures of the two or more partners involved in the complex. Frequently, the structures of the isolated partners are obtained by homology modeling; the problems in homology modeling and their possible solution, are discussed in Section 18.
17. Physical properties of amino acids
In using the amino-acid sequences of a protein to simulate its folding pathway, it is common practice to use the names assigned to each amino acid. However, these names convey no information about the physical properties of these amino acids. Kidera et al. (Reference Kidera, Konishi, Oka, Ooi and Scheraga1985a, Reference Kidera, Konishi, Ooi and Scheragab) have rectified this situation by carrying out multivariate statistical analyses of 188 conformational and physical properties of the 20 naturally occurring amino acids, and have produced ten orthogonal properties (factors) without losing the information contained in the original physical properties (Kidera et al. Reference Kidera, Konishi, Oka, Ooi and Scheraga1985a). These factors have been used in a variety of analyses of proteins, e.g., in a series of many papers by S. Rackovsky, whose recent paper described the application of the ten so-called Kidera factors to provide a structural encoding of protein sequences (Scheraga & Rackovsky, Reference Scheraga and Rackovsky2014).
17.1 Nature of the Kidera factors
Since 72 of the 188 physical properties did not follow a normal distribution, these 72 were eliminated from further consideration (Kidera et al. Reference Kidera, Konishi, Oka, Ooi and Scheraga1985a). The remaining 116 were classified by a cluster analysis to eliminate duplications of highly correlated physical properties. This led to nine clusters, each of which was characterized by an average characteristic property. The physical properties within a given cluster were highly correlated with each other, but the correlations between clusters were low. Then a factor analysis was applied to the nine average properties and 16 additional physical properties to obtain a small number of orthogonal properties (ten factors). Four of these factors arise from the nine characteristic properties, and the remaining six factors were obtained from the 16 physical properties not included in the nine characteristic properties.
The first four factors pertain to the following properties:
Factor 1. α-Helix or bend-structure preference (Factor 1 expresses the highly positive correlation for bend-structure preference and the highly negative correlation for α-helix preference).
Factor 2. Bulk-related.
Factor 3. β-structure preference-related.
Factor 4. Hydrophobicity-related.
The last six factors are more or less mixtures of several physical properties, described by Kidera et al. (Reference Kidera, Konishi, Oka, Ooi and Scheraga1985a).
The numerical values of the ten factors, for each of the 20 naturally occurring amino acids are given in Table V of Kidera et al. (Reference Kidera, Konishi, Oka, Ooi and Scheraga1985a). Finally, 86% of the original 188 physical properties could be expressed as a sum of the ten orthogonal factors with appropriate weighting factors.
17.2 Applications of the Kidera factors
These factors contain information relating almost all properties of all 20 amino acids over the whole sequence. Consequently, interesting phenomena result from this information content. As an example, consider two 20-residue sequences, one from human hemoglobin α chain and the other from apo-liver alcohol dehydrogenase, as shown in the diagram of Table 1.
Comparison of two 20-residue sequences
a These two different 20-residue sequences have similar properties. (Kidera et al. (Reference Kidera, Konishi, Ooi and Scheraga1985b).
b These are the experimental backbone structures as identified by Kabsch & Sander (Reference Kabsch and Sander1983): H, α-helix; G, 310-helix; S, bend; T, bend with hydrogen bond; B, bridge region; E, extended; C, coil.
From this diagram, it can be seen that these two amino-acid sequences have no residues in common, in terms of the traditional names of the amino acids, except for the YG doublet near the C-terminus. However, the 20 residues of these two structures are very similar when the amino-acid sequences are expressed in terms of their Kidera factors (Kidera et al. Reference Kidera, Konishi, Ooi and Scheraga1985b), and account for the similar structures of the two 20-residue fragments. This behavior has been exploited very frequently by Rackovsky, most recently to detect homologs between protein sequences when the sequences are expressed in terms of Kidera factors (Scheraga & Rackovsky, Reference Scheraga and Rackovsky2014).
18. Homology modeling
An additional procedure to compute protein structure, with a substantial reduction in computational cost, involves homology modeling. For example, Warme et al. (Reference Warme, Momany, Rumball, Tuttle and Scheraga1974) computed the structure of α-lactalbumin from that of lysozyme. However, as pointed out by Scheraga & Rackovsky (Reference Scheraga and Rackovsky2014), although homology modeling has led to many encouraging successes, this method cannot yet be regarded as a solved problem because of two problems and several assumptions related to sequence alignment. Therefore, in order to circumvent these assumptions, these authors addressed the initial step in homology modeling using a Fourier analysis to detect structural homologs of a target sequence of interest. This was accomplished by demonstrating a high correlation between the intermolecular distances in the sequence and structure spaces. To achieve this result, the 20 naturally occurring amino acids were represented by parameters from a factor analysis of their physical properties, analyzed by Kidera et al. (Reference Kidera, Konishi, Oka, Ooi and Scheraga1985a, Reference Kidera, Konishi, Ooi and Scheragab), and the sequences represented in terms of these parameters were Fourier transformed. A sequence distance was constructed based on the Fourier coefficients which contain information from the entire sequence. Scheraga & Rackovsky (Reference Scheraga and Rackovsky2014) demonstrated that two sequences which are close in sequence space are also close in structure space defined by using a general bond matrix method (see Fig. 1 of Scheraga & Rackovsky, Reference Scheraga and Rackovsky2014). Therefore, for any target protein sequence, 30 closest protein sequences in a CATH database are identified based on the sequence distance function constructed earlier. Psipred secondary prediction results (Jones, Reference Jones1999; Buchan et al. Reference Buchan, Minneci, Nugent, Bryson and Jones2013) are used to identify five final candidates out of this total of 30 candidates). A structure of each target protein is built, based on the structure of each candidate obtained above. All these structures are then optimized with the UNRES force field using a short multiplex version of replica exchange molecular dynamics (MREMD) runs. Then, a cluster analysis is carried out for the MREMD simulations, and the top five clusters are selected as the possible structure of the target protein.
An example from CASP8, namely target T0476–D1, is shown in Fig. 22. The native structure of this protein is shown in panel (b) on the right, and the selected candidate structure obtained by the Fourier analysis and the following Psipred treatment is shown in panel (a) on the left. This structure was then simulated with UNRES, and the lowest root-mean-square deviation (RMSD) structure from the MREMD run is overlapped with the native structure in Fig. 23a. For comparison, the GTD–TS plots of the candidate structures submitted by all groups for this target are illustrated in Fig. 23b; and the quality of the submitted structures increases as the curves are illustrated to the right. The calculated GDT–TS plot of our computed candidate is shown in Fig. 23c, and would appear to the right of all other submitted structures at a 10 Å cut off in Fig. 23b. CASP rules prevent our superposition of the curve in panel (c) on the plots in panel (b). Our procedures are still undergoing refinement.
Initial structures of the CASP8 target T0476–D1. (a) Candidate structure obtained with the Fourier approach, based on a search of the CATH database. (b) Native structure (Scheraga & Rackovsky, Reference Scheraga and Rackovsky2014).
(a) Overlap view of structure of T0476–D1 after UNRES simulation. The native structure is in red and the UNRES MD-resulting structure is in blue. (b) The GTD–TS plots of all the candidates submitted by all groups for Target T0476–D1 from the CASP website. The GDT–TS plots have been reproduced with permission from the CASP8 website. http://www.predictioncenter.org/casp8/results.cgi. (c) The GDT–TS plot, of our computed candidate. The GDT–TS scores were calculated using the GDT–TS server: http://proteinmodel.org/AS2TS/LGA/lga.html. 96.6%; of the whole protein can be fitted into the 10 Å cut-off: when compared with panel (b) the curve of panel (c) would appear on the right-most side of panel (b) at the 10 Å cut-off.
19. Kinetics of protein folding
For a direct simulation of the kinetics of protein folding, based on the introduction of UNRES and improving on the analysis in Section 4.3, the Lagrange formalism was first implemented to derive the equations of motion for the UNRES force field (Khalili et al. Reference Khalili, Liwo, Rakowski, Grochowski and Scheraga2005a).
19.1 Formalism of Langevin dynamics
The Cα…Cα and Cα…SC virtual bond vectors (SC denoting a side-chain center) were chosen as variables. This formalism was then extended to Langevin dynamics (Khalili et al. Reference Khalili, Liwo, Jagielska and Scheraga2005b). The equations of motion were integrated by using a simplified stochastic velocity Verlet algorithm, and temperature was maintained constant by introduction of friction and random forces in a Berendsen thermostat. The UNRES time scale was found to be extended four times longer than that of all-atom molecular dynamics simulations because the degrees of freedom corresponding to the fastest motions in UNRES are averaged out. When the reduction of the computational cost for evaluation of the UNRES energy function is also taken into account, UNRES (with hydration included implicitly in the side chain–side chain interaction potential) offers about at least a 4000-fold speed up of computations relative to all-atom simulations with implicit solvent and at least a 65-fold speed up relative to all-atom simulations with explicit solvent. The average CPU time for folding protein A by UNRES molecular dynamics was 30 min with a single α processor, compared with about 152 h for all-atom simulations with explicit solvent. Khalili et al. (Reference Khalili, Liwo, Jagielska and Scheraga2005b) concluded that the UNRES/MD approach will facilitate microsecond and, possibly, millisecond simulations of protein folding and, consequently, folding of proteins in real time.
19.2 Application of Langevin dynamics to fold protein A
An example of the applications of Langevin dynamics is its use with UNRES to study the kinetics of the folding of the B-domain of staphylococcal protein A (Khalili et al. Reference Khalili, Liwo and Scheraga2006). To gain meaningful statistics, 400 trajectories of protein A were started from the extended state, and simulated for more than 35 ns each, and 380 of them folded to the native structure. The simulations were carried out at the optimal folding temperature of protein A, which is 500 K with the UNRES force field developed in 2004. The fraction of native-likeness of each of the three helices of protein A were measured every 0.5 ps, and these fractions were averaged over the 400 trajectories, and the curve for this average versus time was fitted to a two-state kinetic equation to determine the folding rate.
In all the simulations, the C-terminal α-helix formed first. The ensemble of the native basin had an average RMSD value of 4 Å from the native structure. A stable intermediate was observed along the folding pathway, in which the N-terminal α-helix was unfolded; this intermediate appeared on the way to the native structure in less than one-fourth of the folding pathways, while the remaining ones proceeded directly to the native state. The α-helix content, without considering the interactions between helices, grew quickly with time, and its variation fit well to a single-exponential term, suggesting fast two-state kinetics. On the other hand, the fraction of folded structures, taking the interactions between helices into account, changed more slowly with time and fitted to a sum of two exponentials, in agreement with the appearance of the intermediate found when analyzing the folding pathways. This observation demonstrates that different qualitative and quantitative conclusions about folding kinetics can be drawn depending on which observable is monitored.
20. Multiplexed-replica exchange molecular dynamics
The most effective sampling methods, to improve canonical molecular dynamics or Metropolis Monte Carlo, are the generalized-ensemble algorithms such as parallel tempering (Hansmann, Reference Hansmann1997) or REMD. The REMD method combines the idea of simulated annealing and Monte Carlo to perform a random walk in energy space due to a free random walk in temperature space. It starts by simulating n replica systems, each in a canonical ensemble, and each at a different temperature. At given intervals, exchanges of the configurational variables between systems are accepted with the Metropolis criterion. An extension of this procedure is a multiplex version of REMD (MREMD) (Rhee & Pande, Reference Rhee and Pande2003). MREMD enhances sampling by multiplexing the replicas with a number of independent molecular dynamics runs at each temperature. Each set of temperatures run at a different temperature constitutes a layer. Exchanges are attempted not only within a single layer but also between layers. The multiplexed procedure increases the power of replica exchange MD considerably, and convergence of the thermodynamic quantities is achieved much faster (Czaplewski et al. Reference Czaplewski, Kalinowski, Liwo and Scheraga2009).
The densities of states obtained from the multi-histogram analysis of MREMD trajectories are used to calculate free-energy profiles (Nanias et al. Reference Nanias, Czaplewski and Scheraga2006).
21. Application of UNRES to biological problems
21.1 Application to Aβ
Alzheimer's disease is a neurodegenerative disorder characterized by the accumulation of plaque deposits in the human brain. The main component of these plaques consists of highly ordered structures called amyloid fibrils, formed by the amyloid β-peptide (Aβ), consisting of 40 or 42 amino-acid residues. The aggregation of Aβ has been studied by solid-state NMR spectroscopy (Tycko, Reference Tycko2006; Petkova et al. Reference Petkova, Yau and Tycko2006).
With the UNRES force field and molecular dynamics simulations, we have modeled the growth mechanism of Aβ amyloid fibrils. In the initial formation of the fibril, a partial α-helix appears in part of a monomer but later undergoes an α- to β-transition (Rojas et al. Reference Rojas, Liwo and Scheraga2011). Fibril elongation follows a mechanism in which monomers attach in two distinct stages, docking and then locking, with hydrogen-bond and hydrophobic interactions contributing to the stability of the fibril (Rojas et al. Reference Rojas, Liwo, Browne and Scheraga2010). The structure of the fibrils (see Fig. 18) appears to be a stacked array of hairpin-like dimers involving hydrogen-bonding and hydrophobic interactions (Rojas et al. Reference Rojas, Liwo, Browne and Scheraga2010). The proposed mechanism of fibril elongation is supported by simulated 2D ultraviolet spectroscopy (Lam et al. Reference Lam, Rodriguez, Rojas, Scheraga and Mukamel2013).
21.2 Application to PICK1
PICK1 is a multi-domain mammalian membrane protein (Staudinger et al. Reference Staudinger, Zhou, Burgess, Elledge and Olson1995). Its monomeric form contains one post-synaptic density (PDZ-95/Discs large/Zonula occludens-1) domain (Sheng & Sala, Reference Sheng and Sala2001; Hung & Sheng, Reference Hung and Sheng2002) and one Bin/Ampiphysin/Rvs. (BAR) domain (Takei et al. Reference Takei, Slepnev, Haucke and De Camilli1999). Although many known proteins contain one or more PDZ or BAR domains, only PICK1 contains both of these. The current lack of a complete PICK1 structure determined at atomic resolution hinders the elucidation of its functional mechanisms. A model of the PICK1 dimer was proposed by Han & Weinstein (Reference Han and Weinstein2008) based on the experimental work described below. UNRES, which can be used to investigate large protein folding/binding processes, has provided some structural information for PICK1. Both MREMD and canonical MD procedures were performed to determine the binding mode of the PICK1–PDZ domain on the BAR dimer surface as well as the possible binding structure of the biological functional form of PICK1, i.e., the dimer form of the BAR plus the PDZ domains (He et al. Reference He, Liwo, Weinstein and Scheraga2011). As shown in Fig. 19a and b, the simulation was started with the PDZ domain on either side of the BAR domain. In both simulations, the MREMD results indicated that the preferred binding site for the single PDZ domain is the concave cavity of the BAR dimer as shown in Fig. 19c and d. Subsequent short canonical molecular dynamics simulations, used to determine how the PICK1–PDZ domain moves to the preferred binding site on the BAR domain of PICK1 (not shown here), revealed that initial hydrophobic interactions drive the progress of the simulated binding. Thus, the concave face of the BAR domain accommodates the PDZ domain by weak hydrophobic interactions, and then the PDZ domain slides to the center of the concave face, where more favorable hydrophobic interactions take over.
The model of the PICK1 dimer structure illustrates the main hypothesis for the regulation of the PICK1 protein by auto-inhibition/disinhibition (Lu & Ziff, Reference Lu and Ziff2005). The occlusion of the concave face of the BAR dimer by PDZ is considered to prevent interaction of BAR with membranes. The PDZ domains of PICK1 have been proposed as providing the regulatory mechanism for BAR domain function, in which the auto-inhibited complex is activated by the dissociation of the PDZ domains from the BAR surface following their own interaction with the C-termini of specific membrane proteins. If the PICK1 PDZ–BAR domain interaction inhibits the BAR domain, then breaking the PDZ–BAR binding would be expected to enhance the function of PICK1 and its association to a membrane. Lu & Ziff, (Reference Lu and Ziff2005) first tested this on a complex of PICK1 with a membrane protein, i.e., PICK1–ABP/GRIP, and showed that PDZ is removed from the PICK1 PDZ–BAR domain to facilitate the association of PICK1 with the Br region of ABP/GRIP.
21.3 Application to Hsp70
Hsp70 is a heat-shock protein that facilitates folding of an unfolded polypeptide chain (substrate). It consists of two domains, the substrate-binding domain (SBD) and the nucleotide-binding domain (NBD) which acts as an ATP-ase. With MREMD and canonical MD with UNRES, we simulated, for the first time, the complete spontaneous transition from a closed to an open conformation of the SBD with respect to the NBD of the Hsp70 chaperone form Escherichia coli (DnaK) (Golas et al. Reference Golas, Maisuradze, Senet, Oldziej, Czaplewski, Scheraga and Liwo2012). The proposed mechanism of action of Hsp70, obtained from this simulation, was based on an ATP-induced scissor-like motion of the two sub-domains of the NBD, and confirmed by recent experiments (Kityk, et al. Reference Kityk, Kopp, Sinning and Mayer2013). The open structure simulated with UNRES, when starting from the closed NMR structure of DnaK, is topologically identical to the crystal structure of ATP-bound (open) DnaK (Kityk et al. Reference Kityk, Kopp, Sinning and Mayer2013). The experimental structure was solved after we had performed our computational work. The canonical UNRES/MD simulations revealed three binding modes of the SBD to the NBD, shown in Fig. 20 (Golas et al. Reference Golas, Maisuradze, Senet, Oldziej, Czaplewski, Scheraga and Liwo2012). One of these modes entails binding of the closed SBD to the NBD, and the remaining two entail the opening of the α- and β- subdomain constituents of the SBD prior to its binding to the NBD. One of the open-binding modes is mirrored in the experimentally determined open structure of the ATP-bound DnaK structure (Kityk et al. Reference Kityk, Kopp, Sinning and Mayer2013).
22. Solitons and protein folding
Protein folding can also be considered from a relatively new point of view, in which, instead of analyzing individual interactions that contribute to the formation of folded structure, symmetry-based model-independent principles are proposed. In particular, all the physical forces, no matter how strong or weak they are, combine together to give rise to a particular type of protein dynamics, that can be described by a generalization of the discrete non-linear Schrödinger equation (DNLSE) (Kevrekidis, Reference Kevrekidis2009), solutions of which are solitons. Solitons, plus their formation and dynamics, can provide a conceptual advantage to address the formation of structure in protein collapse. Compared with Principle Component Analysis, which is a post-processing method, i.e., requiring actual MD simulations, solitons on the other hand can provide a simulation-free prediction of local collective motions and, therefore, can be used to describe protein dynamics. This could provide a new approach to the understanding of intrinsically disordered proteins.
The DNLSE has a long history in protein research. It was originally introduced by Davydov (Reference Davydov1973) to describe bending and twisting oscillations in an α-helix. Davydov also observed that the non-linear Schrödinger equation supports solitons, which are a collective phenomenon and observed when all, even the smallest contributions, come together in a concerted fashion. However, unlike the Davydov soliton that, by construction, does not describe phenomena in which the hydrogen bonds along the α-helical structure become broken, in the approach described here the entire folding process of a protein chain, including rupture of hydrogen bonds, is described in terms of a (multi)-soliton solution. It has been demonstrated (Krokhotin et al. Reference Krokhotin, Niemi and Peng2011) that dark solitons describe very diverse local protein structures, including complicated loops. Moreover, soliton-based analysis of protein-folding and conformational-transition trajectories facilitate the identification and interpretation of those physical phenomena that exhibit patterns of collective long-range order in terms of soliton dynamics (Krokhotin et al. Reference Krokhotin, Niemi and Peng2011).
While investigating protein-folding processes, we showed that it is possible to interpret conformational changes in proteins (simulated with UNRES) in terms of soliton solutions of a variant of the DNLSE (Krokhotin et al. Reference Krokhotin, Liwo, Niemi and Scheraga2012). As an example, we investigated the crystallographic structure of an isoform of the intra-cellular domain of the Alzheimer-disease-related amyloid precursor protein AICD in a complex with a nuclear multi-domain protein in the Fe65 family. We found that the structure of AICD can be analyzed in terms of solitons and can provide a direction to MD simulations (which we carried out with UNRES). Our further work showed how the results of UNRES simulations of the conformational transition of protein A from a single long α-helix into the native three-helix bundle can be interpreted in terms of soliton–soliton pair formation (Krokhotin et al. Reference Krokhotin, Liwo, Maisuradze, Niemi and Scheraga2014). Solitons, plus their formation and dynamics, can provide a conceptual advantage to address the formation of structure in protein collapse. We also described how UNRES relates soliton formation to other collective modes, i.e., the principal modes, obtained by Principal Component Analysis, to provide further insight into the physical effects that drive protein folding (Krokhotin et al. Reference Krokhotin, Liwo, Maisuradze, Niemi and Scheraga2014). As shown above, we found that solitons provide an innovative approach to organize and guide simulations and analyze the results. We have learned that solitons can also provide an innovative approach in addressing the properties of intrinsically disordered proteins. As a proof of concept, we have already demonstrated how new structures are identified in AICD (PDB code 3DXC) when analyzed in terms of solitons with the aid of coarse-grained simulations with UNRES (Krokhotin et al. Reference Krokhotin, Liwo, Niemi and Scheraga2012). We have identified the loop in the 38-residue AICD component of 3DXC as a configuration with two nearby solitons; we have described this configuration within a 0.6 Å RMSD from the crystallographic structure in terms of a two-soliton solution to a variant of the DNLS equation. In unpublished, preliminary dynamical simulations, we have observed that, when AICD is in isolation, i.e., separated from Fe 65, the first soliton can oscillate quite freely back and forth along the backbone, between the second soliton and the proline at site 669. This propagation of the first soliton affects the shape of the protein, which could easily cause the protein to appear disordered. In the 3DXC binary complex dimer of AICD with Fe65, however, the first soliton is held in place because of interactions with Fe65. Current work is involved to develop and apply our approach to analyze and understand conformational transitions in proteins, in particular amyloid formation, as in AICD (Das et al. Reference Das, Ghosh, Dasgupta, Sen and Mukhopadhyay2012), Fe65 and Aβ42.
With UNRES, we were able to simulate (Golas et al. Reference Golas, Maisuradze, Senet, Oldziej, Czaplewski, Scheraga and Liwo2012) the opening of the SBD of Hsp70 and binding of its α-helical subdomain (SBD-α) to the NBD of the chaperone (see Section 21.3). We also found (Golas et al. Reference Golas, Maisuradze, Senet, Oldziej, Czaplewski, Scheraga and Liwo2012) that the chaperone cycle is initiated by ATP-induced scissor-like movement of the NBD, which results in the binding of the β-sheet subdomain of the SBD (SBD-β) to the NBD. Once SBD-β connects to NBD, the energy kick resulting from this collision can be relayed to SBD-α, creating a soliton, which would then travel along the helix to straighten it. Similarly, when ATP is hydrolyzed, SBD-β dissociates from the NBD, also resulting in an energy kick because the hydrophobic and hydrogen-bonding contacts are disrupted. Ultimate simulation and analyses, in terms of solitons of the opening of the SBD in the complete DnaK chaperone can serve as a model of Hsp70 with the NBD conformation as in the ATP-bound chaperone.
23. Nucleic acids
In our early work on helix–coil transitions in poly-amino acids (Section 7), we also examined the transitions between the unfolded and organized forms of single-stranded polynucleotides, and discussed the influence of local interactions on cooperativity and anti-cooperativity (Epand & Scheraga, Reference Epand and Scheraga1967; Poland et al. Reference Poland, Vournakis and Scheraga1966; Vournakis et al. Reference Vournakis, Scheraga, Rushizky and Sober1966, Reference Vournakis, Poland and Scheraga1967). More recently, we began to produce a coarse-grained model of nucleic acids. Initially, we represented each of the nucleic acid bases by 3–5 interaction centers (Maciejczyk et al. Reference Maciejczyk, Spasic, Liwo and Scheraga2010). Lennard–Jones spheres with a 12–6 potential energy function were used to model van der Waals interactions. The charge distribution was modeled by a set of electric dipole moments located at the centers of the Lennard–Jones spheres. The model with three-center cytosine, four-center guanine, four-center thymine, and five-center adenine satisfactorily reproduces the canonical Watson–Crick hydrogen bonding and stacking interaction energies of the all-atom AMBER model. The computation time with this coarse-grained model is seven times lower than that with the all-atom model.
23.1 Formulation of NARES–2P
After producing the model of Maciejczyk et al. (Reference Maciejczyk, Spasic, Liwo and Scheraga2010), it was clear that an even more simplified coarse-grained model is needed in order to simulate such a large system as DNA. Furthermore, in order to create an ultimate coarse-grained model of a protein plus a nucleic acid, NARES–2P was developed by He et al. (Reference He, Maciejczyk, Oldziej, Scheraga and Liwo2013a), based on the same philosophy as UNRES, to simulate DNA molecules.
In the NARES–2P model, shown in Fig. 24, a polynucleotide chain is represented by a sequence of virtual sugar (S) atoms (colored red), located at the geometric center of the sugar ring, linked by virtual bonds with attached united sugar-base (B, colored green) and united phosphate groups (P, colored white). The united phosphate group is located at the center of each virtual bond which connects two virtual sugar (S) atoms. It should be noted that the position of the united phosphate group is not the actual position of the phosphate atom in the all-atom representation as shown in Fig. 24. These united sugar-bases (B's) and the united phosphate groups (P's) serve as interaction sites. As in UNRES, the NARES–2P effective energy function originates from the RFE function or potential of mean force of an all-atom nucleic acid chain plus the surrounding solvent and counter-ions, with the all-atom energy function being averaged over the degrees of freedom that are lost when passing from the all-atom to the simplified system. The energy of the virtual-bond chain in the present NARES–2P model is expressed by Eq. (22).
 $$\eqalign{U = & w_{BB}^{GB} \sum\limits_i {\sum\limits_{\,j \lt i} {U_{B_i B_j} ^{GB}} +} \,w_{BB}^{dip}\, f_2 (T)\sum\limits_i {\sum\limits_{\,j \lt i} {U_{B_i B_j} ^{dip}} +} w_{\,pp} \sum\limits_i {\sum\limits_{\,j \lt i} {U_{P_i P_j}}} \cr & + w_{PB} \sum\limits_i {\sum\limits_j {U_{P_i B_j}} +} \,w_{{\,\rm bond}} \sum\limits_i {U_{{\rm bond}} (d_i )} + w_{{\rm ang}} \sum\limits_i {U_{{\rm ang}} (\theta _i )} \cr & + w_{{\rm tor}}\, f_2 (T)\sum\limits_i {U_{{\rm tor}} (\gamma _i ) + w_{{\rm rot}}} \sum\limits_i {U_{{\rm rot}} (\alpha _i, \beta _i ) + U_{{\rm restr}}}} $$
with Eq. (21) for f n(T). More details about each energy term can be found in our earlier publication by He et al. (Reference He, Maciejczyk, Oldziej, Scheraga and Liwo2013a)
The NARES–2P model of the nucleotide chain. Solid red circles represent the united sugar groups (S) which serve as geometric points, and open white circles represent the united phosphate groups (P). Ellipsoids represent bases, with their geometric centers at the B's (solid green circles). The P's are located halfway between two consecutive sugar atoms. The all-atom representation is superposed on the coarse-grained representation, and dipoles (in red arrows) are located on the bases to represent their electrostatic interaction. The electrostatic part of the base–base interactions is represented by the mean-field interactions of the base dipoles computed by integrating the Boltzmann factor over the rotation of the dipoles about the base axes (dotted lines). The backbone virtual-bond angles, θ, and the virtual-bond dihedral angles, γ, are indicated. The base orientation angles α and torsional angles β, which define the location of a base with respect to the backbone, are also indicated (He et al. Reference He, Maciejczyk, Oldziej, Scheraga and Liwo2013a).
.
The NARES–2P model was built into the UNRES/MD platform (Khalili et al. Reference Khalili, Liwo, Rakowski, Grochowski and Scheraga2005a, Reference Khalili, Liwo, Jagielska and Scheragab; Liwo et al. Reference Liwo, Khalili and Scheraga2005) which enables canonical and replica-exchange simulations of nucleic acids to be carried out. Two test systems, the Dickerson–Drew dodecamer (DNA; 2 × 12 residues; PDB: 9BNA) and 2JYK (DNA; 2 × 21 residues), were used to probe the capability of NARES – 2P to produce double-helix formation. An overlap view of the simulation results with NARES–2P and the experimental structure is shown in Fig. 25.
Calculated ensemble-averaged structures at T = 300 K obtained in NARES-2P MREMD simulations of the molecules studied (blue sticks) compared with the respective experimental structures (light and dark brown sticks). Sticks correspond to the S…S and S…B virtual bonds. Calculated structures of 9BNA and 2JYK, are superposed on the corresponding experimental structures and shown as side views in panels (a) and (c), respectively. Top views of 9BNA (from the C5’ ends) is shown in panels (b), with calculated structures above and the experimental structures below. The rmsd's over the S centers of the calculated structures averaged over all native-like clusters are 4.7 Å, 10.7 Å, for 9BNA, 2JYK, respectively, with respect to each experimental structure. The lowest RMSD values obtained in the respective MREMD runs are 2.6 Å and 4.2 Å for 9BNA and 2JYK, respectively (He et al. Reference He, Maciejczyk, Oldziej, Scheraga and Liwo2013a).
23.2 Application of NARES–2P
As proof of concept, we first demonstrated that the potentials for dipoles and excluded volume (Gay & Berne, Reference Gay and Berne1981) for bases, and Lennard–Jones for the phosphate group, together with chain connectivity terms, were sufficient to form the double-stranded helical structure of DNA. To assess how well NARES–2P reproduces the thermodynamic properties of DNA hybridization, we ran calculations for small DNA molecules. A direct comparison was made between the melting temperatures, standard enthalpies and entropies determined by differential-scanning calorimetry (DSC) by Hughesman et al. (Reference Hughesman, Turner and Haynes2011a, Reference Hughesman, Turner and Haynesb) and these properties calculated from NARES–2P MREMD simulations. The calculated enthalpies and entropies of melting were generally smaller than the experimental values for 18 systems investigated. The calculated heat capacity curves were flatter compared with the experimental ones (He et al. Reference He, Mozelewska, Krupa, Sieradzan, Wirecki, Liwo, Kachlishvili, Rackovsky, Jagiela, Slusarz, Czaplewski, Oldziej and Scheraga2013b). This feature of the present NARES–2P force field suggests that correlation terms must be introduced to sharpen the melting transition curves.
NARES–2P was also used to investigate the internal-loop formation in the AT-rich fragments in the DNA duplex. This is an important feature of the melting of DNA duplexes that contain substantial amounts of AT-rich fragments that lead to a pre-melting transition, which causes the disruption of the A–T pairs (which are more weakly bonded than the C–G pairs) at temperatures lower than those of duplex dissociation. This transition is manifested as the difference between the fraction of paired bases and the fraction of paired chains (Zeng et al. Reference Zeng, Montrichok and Zocchi2004) or the disruption of the C–G pairs that are about ten nucleotides away from an AT-rich fragment (Cuesta-López et al. Reference Cuesta-López, Menoni, Angelov and Peyrard2011). For two test systems (L33B9 and L19AS), simulated by NARES–2P, the fraction of paired chains (f) exceeds that of paired bases (p). The difference between the fraction of paired strands and that of paired bases (f–p) has a maximum close to but prior to the melting temperature. For the L33B9 system, the p(T) and f(T) curves are diffuse which is indicative of non-two-state behavior. The two first dominant families of conformations of L19AS (41% of the ensemble at T = 300 K) and the second dominant family of conformations of L33B9 (13% of the ensemble at T = 290 K) clearly shows the bubble (internal loop) in the nine A…T-pair wide segment. The bubbles (internal loops) occur at a lower temperature relative to the melting-transition temperature than that observed experimentally (Zeng et al. Reference Zeng, Montrichok and Zocchi2004) and the temperature profile of melting (measured as the fraction of unpaired bases) is more diffuse, probably resulting from lack of cooperative terms in the force field. By comparing the fractions of paired bases and paired chains calculated with NARES–2P for the sequences studied experimentally (Cuesta-López et al. Reference Cuesta-López, Menoni, Angelov and Peyrard2011; Zeng et al. Reference Zeng, Montrichok and Zocchi2004), He et al. (Reference He, Maciejczyk, Oldziej, Scheraga and Liwo2013a) demonstrated that the NARES–2P force field can reproduce the pre-melting transition qualitatively.
23.3 Use of maximum-likelihood algorithm
To improve the precision as well as the thermodynamics of the NARES–2P force field further, an optimization procedure is under development based on a maximum-likelihood plus multi-variant minimization algorithm (Levenberg, Reference Levenberg1944). The normalized density function of the maximum-likelihood algorithm was based on the combined RMSD distribution of DNAs used for training, and heat capacities together with other experimental properties, e. g., fraction of paired bases in the double-stranded forms, included as other variants in the multi-variant minimization algorithm. Preliminary results show that this optimization procedure can improve the performance of the dynamics and thermodynamic of the NARES–2P force field.
24. Protein–DNA interactions
With the availability of force fields for UNRES + NARES–2P, work has been started to produce a force field to build a bridge between UNRES and NARES–2P interactions to simulate protein–DNA interactions. This initially involved determination of the interaction parameters between the 20 amino acid side chains and the four DNA bases (Yin et al. 2015).
24.1 Coarse-grained model for Protein–DNA interactions
The Interaction sites of proteins in UNRES (Liwo et al. Reference Liwo, Czaplewski, Oldziej, Rojas, Kaźmierkiewicz, Makowski, Murarka, Scheraga and Voth2008) are peptide groups and side chains (see Fig. 14), and the interaction sites of DNA in NARES–2P (see Fig. 24) are phosphate groups and nucleic-acid bases (for which the word ‘base’ is used as a shorthand in the following context) (He et al. Reference He, Mozelewska, Krupa, Sieradzan, Wirecki, Liwo, Kachlishvili, Rackovsky, Jagiela, Slusarz, Czaplewski, Oldziej and Scheraga2013b). Consequently, the protein–DNA interactions in UNRES+NARES–2p consist of a peptide group–phosphate group interaction potential, a peptide group–base interaction potential, a side chain–phosphate group interaction potential, and a side chain–base interaction potential, as shown in Fig. 26.
Illustration of the coarse-grained models of polypeptide and nucleotide chains, UNRES and NARES–2P, respectively. In UNRES, the interacting sites are peptide groups (shaded sphere labeled p) and side chain (shaded ellipsoid labeled SC). The white spheres represent α-carbon atoms (labeled Cα), which define the geometry of the backbone. In NARES–2P, the interacting sites are phosphate groups (blue spheres labeled P) and nucleic-acid bases (blue ellipsoids labeled B). The white sphere represents the sugar ring (labeled S); P and S are used to define the geometry of the backbone. The components of the protein–nucleic acid mean-field interaction in the UNRES+NARES–2P representation are also shown as red dashed lines (Yin et al. Reference Yin, Sieradzan, Liwo, He and Scheraga2015).
The complete coarse-grained energy function for protein–DNA systems is given by Eq. (23).
 $$U = U_{\rm p} + U_{\rm N} + U_{{\rm PN}}, $$
where U P is the effective energy function of the protein, U N is the effective energy function of the nucleic acid, and U PN is the effective energy function of the protein–nucleic acid system, expressed by Eq. (24).
 $$U_{{\rm PN}} = w_{{\rm p} - {\rm P}} \sum\limits_i {\sum\limits_j {U_{{\rm p} - {\rm P}} +} w_{{\rm p} - {\rm B}}} \sum\limits_i {\sum\limits_j {U_{{\rm p} - {\rm B}} +} w_{{\rm SC} - {\rm P}} \sum\limits_i {\sum\limits_j {U_{{\rm SC} - {\rm P}} +} w_{{\rm SC} - {\rm B}} \sum\limits_i {\sum\limits_j {U_{{\rm SC} - {\rm B}}}}}} $$
(see Yin et al. 2015 for a brief discussion of these terms), where U p–P is the peptide group – phosphate group interaction potential, U p–B is the peptide group–base interaction potential, U SC–P is the side chain–phosphate group interaction potential, and U SC–B is the side chain–base interaction potential. The terms U SC–B, U p–P, U p–B, and U SC–P are discussed in detail by Yin et al. (Reference Yin, Sieradzan, Liwo, He and Scheraga2015).
24.2 Parameterization
The PMFs of the interaction parameters were determined by umbrella-sampling MD simulations in TIP3P water using the AMBER force field, and designed analytical expressions for the mean-field interaction free energy of each pair of interacting molecules were then fitted to the PMF's calculated from the AMBER simulations with an analytical fitting function.
All these analytical potential expressions designed to simulate protein–DNA interactions (Yin et al. Reference Yin, Sieradzan, Liwo, He and Scheraga2015), are physics-based mean-field potentials of side chain–base interactions in the UNRES + NARES–2P force field.
With all these energy terms now available, UNRES + NARES–2P can be used to study protein–DNA interactions in biological systems, e.g., those involved in the complexes that lead to gene expression. This is the only coarse-grained model at the present time that can provide not only thermodynamic data, but also reliable kinetics of protein–DNA processes.
25. Future prospects
The forgoing discussion has indicated the progress in protein chemistry in the second half of the 20th century and beyond. In that period, we have gained an understanding as to how intermolecular energies determine how proteins fold and interact with one another and with nucleic acids. These interactions have also provided a physical understanding as to how energy considerations account for biological processes.
Future research in the physical aspects of protein chemistry can be expected to be more specialized. For higher precision, there will be models based on different design ideas to provide information for experimentalists, e.g., all-atom or coarse-grained models based on quantum-mechanics or classic-mechanics should lead to higher precision in intermolecular energies to enhance the realization of rational drug design and the refinement of computations of the biological processes underlying cellular function and inter-cellular interaction at the quantum-mechanical level. Unified models that can simulate biological processes in real time in complex biological environments will become useful tools for future research. It is not unreasonable to begin to understand brain function, the genetic origins of disease, and the aging process, and thereby be able to provide cures for such diseases, and improve human health.
26. Acknowledgements
Over the years, this research could not have been carried out without the continuous grant support by NIH and NSF. I am also indebted to Dr. Yi He for helpful critique of this manuscript, and to the co-authors cited here for their expertly performed research.