Introduction
There is a growing interest in the competitive effects of different types of firms that provide similar services.Footnote 1 In the health care sector, the majority of this focus has been on how competition from ambulatory surgical centers impact hospitals (Courtemanche and Plotzke, Reference Courtemanche and Plotzke2010; Carey et al., Reference Carey, Burgess and Young2011). One understudied area of potential competition among firms of different types is between the long-term care providers of assisted living facilities and nursing homes.Footnote 2 Both types of firms provide long-term care services, with nursing home residents needing greater assistance and supervision than assisted living facility residents. For most consumers of long-term care, assisted living facilities and nursing homes are not substitutes. However, there is a false notion that nursing homes and assisted living facilities provide services to a disjoint set of consumers. Many assisted living facilities are admitting persons with greater levels of physical need, and allowing residents to ‘age in place’ longer before discharge to a nursing home (Spillman et al., Reference Spillman, Liu and McGilliard2002). Furthermore, multiple states have initiated efforts to increase the amount of long-term care that is provided outside of nursing homes, including Medicaid 1915(c) waiver programs, which allows states to use Medicaid funds to pay for home health and assisted living facility care. These efforts and the willingness of assisted living facilities to provide services to residents with more needs has delayed entry into a nursing home, and in the short run, reduced demand for nursing home services (Bishop, Reference Bishop1999).
Since the entry of an assisted living facility into a nursing home's market can impact the demand for nursing home care and given that markets can only support a fixed number of firms profitability (Gabszewicz and Thisse, Reference Gabszewicz and Thisse1980), it is important to understand how nursing homes are affected by the expansion of the assisted living industry. Currently, there are few studies that look at the interaction between assisted living facilities and nursing home outcomes. This paper is the first to study the effect of assisted living industry expansion on nursing home market structure and the private pay prices that nursing homes charge. Since there are currently no national data sets that contain information on nursing home prices and assisted living facilities, this paper employs a unique data set that contains information for the State of Ohio for the years of 1999 and 2005. The results suggest that the expansion of the assisted living industry has affected nursing home market structure, but had no statistically significant effect on nursing home prices.
Conceptual framework and background
The vast majority of the literature on the effects of competition assumes that firms of the same type only compete with each other, and ignores competition from firms of different types that produce products or services that may be substitutes (i.e. Nyman, Reference Nyman1994; Abraham et al., Reference Abraham, Gaynor and Vogt2007). However, many firms of different types that provide similar services can impact the behavior of each other. For example, nursing homes provide long-term care for persons that require around-the-clock care that have significant deficiencies in activities of daily living. In contrast, assisted living facilities provide long-term care in the form of hotel and limited medical services depending on the regulations within a state.Footnote 3 Assisted living residents tend to have fewer limitations in their activities of daily living and may not need around-the-clock care that is required of nursing home residents. At face value, this would imply that nursing homes and assisted living facilities provide care to a different subset of persons with long-term care needs.
There has been significant growth in the number of assisted living facilities that can affect nursing home demand. From 1990 to 2002, the number of assisted living facility beds in the United States increased from 519,905 to 1,026,397 beds, an almost 100% increase (Harrington et al., Reference Harrington, Chapman, Miller, Miller and Newcomer2005). This compares with a 6.8% increase in the number of nursing home beds, from 1,659,651 to 1,771,758 beds. Increased competition among assisted living facilities has caused assisted living facilities to go after fewer consumers relative to the supply of beds. As a result, assisted living facilities are admitting persons with greater physical needs and allowing persons to stay in the assisted living for longer periods before discharge to nursing homes. In addition, assisted living facilities have expanded to provide a more complex array of services, such as special care units for dementia. All of these factors delay when an individual is admitted to a nursing home (Miller et al., Reference Miller, Prohaska, Furner, Freels, Brody and Levy1998) and lowers demand for private pay nursing home services (Grabowski et al., Reference Grabowski, Stevenson and Cornell2012). The end result is that expansion of and competition among assisted living facilities could indirectly affect the nursing home industry.
Until recently, the nursing home literature has primarily focused on the effect of nursing home competition on nursing home outcomes. Nyman (Reference Nyman1994) used cross-sectional data from Wisconsin and found that 100% increase in market concentration [i.e. Herfindahl–Hirschmann Index (HHI)] is associated with an increase in private pay skilled nursing rates of 3.4% and had no statistically significant effect on intermediate care facility private pay prices. Similarly, a series of papers have found that nursing home market concentration has mixed effects on the quality of care provided by nursing homes (see Zinn Reference Zinn1994) and Grabowski (Reference Grabowski2001) for examples). There are a few papers that study how assisted living facilities affect nursing homes study case-mix, investment in dementia special care units and quality. Newcomer et al. (Reference Newcomer, Swan, Karon, Bigelow, Harrington and Zimmerman2001) found assisted living bed supply had no statistically significant affect on nursing home case-mix, except for in one case.Footnote 4 Similarly, Grunier et al. (Reference Grunier, Lapane, Miller and Mor2007) found that nursing homes do not invest in dementia special care units in response to assisted living facilities opening these types of units, but do react to other nursing homes in the market opening dementia special care units. Finally, Grabowski et al. (Reference Grabowski, Stevenson and Cornell2012) found the expansion of the assisted living industry is associated with increased levels of nursing home resident acuity, while Bowblis (Reference Bowblis2012) found assisted living facility market structure has mixed effects on nursing home quality.
In the health care sector, recent work has found that entry of ambulatory surgical centers put downward pressure on hospital revenues, costs and profits (Carey et al., Reference Carey, Burgess and Young2011) and reduced outpatient surgical volumes preformed at hospitals (Courtemanche and Plotzke, Reference Courtemanche and Plotzke2010). Like ambulatory surgical centers, if assisted living facilities ‘cream-skim’ the healthiest persons that are eligible for nursing home care and delay entry into a nursing home, this can lead to reduced nursing home demand and increase the relative cost of care of existing residents. Absent the assisted living industry, the price charged by nursing homes and number of nursing homes in a market will be determined by nursing home supply and demand. However, the reduced demand associated with the expansion of the assisted living industry could force nursing homes to lower private pay prices to attract more residents. If a nursing home is unable to attract enough residents or is forced to lower prices to the point that costs cannot be covered, then there is a chance a nursing home may exit the market or reduce the number of beds in the facility, increasing nursing home market concentration.
In this paper, data from multiple sources are merged in order to construct a panel of nursing homes in the State of Ohio for the years of 1999 and 2005. Data from Ohio is used because there is currently no national data set on assisted living facilities over multiple years that can be merged with nursing home data that contains private pay prices. In addition to the availability of a rich data set, Ohio has the advantage of having many urban and rural areas, making it geographically representative of the United States. One disadvantage of studying Ohio is the existence of a moratorium on new nursing home beds instituted in 1993. This moratorium set the maximum number of nursing home beds in a county based on county demographics over 20 years ago. Beds are allowed to be transferred among nursing homes within a county or taken offline, but could not be transferred across county lines until 2010. This implies entry into the Ohio nursing home market is generally harder than other states, and this issue needs to be considered in how nursing home market structure variables are constructed. Ohio does not have a certificate of need law or moratorium on assisted living facilities.
Empirical model
Empirical model
The objective of the paper is to answer the following two questions: does expansion of the assisted living industry affect nursing home market structure and does this expansion have an effect on the price that nursing homes charge? To answer both questions, data from 1999 and 2005 are used to construct a two-period panel of nursing homes in order to estimate two separate sets of regressions. Given how the market is constructed, which is discussed later, each nursing home is considered a separate market, making the unit of observation a market year.
In the first set of regressions, the dependent variable of nursing home market structure ( $$)(--><$>S_{{mt}}^{{NH}} <$><!--$$
) is regressed against assisted living market structure (
 $$)(--><$>S_{{mt}}^{{RCF}} <$><!--$$
), market demographic characteristics (Dmt), an indicator for observation year (τt), and market fixed effects (am), where the subscript m denotes each nursing home market. Specifically, the equation to be estimated is
 $$S_{{mt}}^{{NH}} \, = \,\beta S_{{mt}}^{{RCF}} \, + \,\theta {{D}_{mt}}\, + \,{{\alpha }_m}\, + \,{{\tau }_t}\, + \,{{{\epsilon}}_{mt }}$$
In the second set of regressions, the dependent variable is average daily private pay price charged by nursing homes ( $$)(--><$>P_{{mt}}^{{NH}} <$><!--$$
). Along with variables in equation (1), this set of regressions also controls for nursing home market structure and a vector of facility characteristics (Fmt). Formally, the regression models to be estimated are
 $$P_{{mt}}^{{NH}} \, = \,{{\beta }_{\rm{1}}}S_{{mt}}^{{RCF}} \, + \,{{\beta }_{\rm{2}}}S_{{mt}}^{{NH}} \, + \,\gamma {{F}_{mt}}\, + \,\theta D_{{mt}}^{{}} \, + \,{{\alpha }_m}\, + \,{{\tau }_t}\, + \,{{{\epsilon}}_{mt }}$$
There are few econometric issues that need to be addressed in estimating both equations. The error term is found to have a non-constant variance and shocks in a market that affect one year are likely to be correlated with shocks in the other year. Therefore, standard errors are estimated to allow for heteroscedasticity and clustering within market. Additionally, unobserved demand and cost shocks can lead to an evolutionary process that causes market structure to be endogenous. To address this issue, equations (1) and (2) include market-specific fixed effects, which captures a time-invariant demand or cost shock that affect market structure or price (Evans et al., Reference Evans, Froeb and Werden1993; Moriya et al., Reference Moriya, Vogt and Gaynor2010). For reference, the tables also report results that do not include market-specific fixed effects [i.e. pooled ordinary least squares (OLS)].
Data sources
The empirical analysis utilizes data from three main sources on long-term care providers in the State of Ohio for the years of 1999 and 2005 to construct a panel of nursing homes: the Online Survey Certification and Reporting (OSCAR) System, the 1999 and 2005 Biennial Survey of Long-Term Care Facilities, and the Area Resource File.Footnote 5 OSCAR is a uniform database that contains state surveys of all federally certified nursing homes every 9–15 months and contains information about the nursing home characteristics and location. The Biennial Survey of Long-Term Care Facilities is a survey of Ohio nursing homes and assisted living facilities collected by the Ohio Department of Aging in conjunction with the Scripps Gerontology Center with the purpose of providing the state information on the supply of long-term care beds. The nursing home component of the survey provides the average daily private pay price that nursing homes charge residents, whereas the assisted living component provides information on the location of assisted living facilities. Finally, the Area Resource File provides demographic information at the county level.
To construct the analytical data set, all nursing homes surveyed in OSCAR in the calendar years of 1999 and 2005 are merged with price data from the Biennial Survey of Long-Term Care Facilities using the nursing home's provider identification number. County demographic characteristics from the Area Resource File are merged into the data based on county the nursing home is located. The assisted living facility component of the Biennial Survey of Long-Term Care Facilities is used to identify the number of assisted living facilities in each market. Given the time between surveys in the OSCAR data, some nursing homes may not have surveys in 1999 or 2005. Therefore, data from 1998 to 2006 is used to identify nursing homes that are in the market in 1999 and 2005. Nursing homes and assisted living facilities are assigned markets based on their zip code. This assignment process is discussed below. The resulting analytical data file contains 1902 market-year observations across the two years.
Market definition and market structure variables
The definition of the relevant geographic market is important in obtaining accurate measures of market structure. While prior research has used the county to define the market, this market definition can over- or underestimate the true level of market concentration (Zwanziger et al., Reference Zwanziger, Mukamel and Indridason2002). Therefore, one of the common approaches is to use a fixed circular distance around each facility.Footnote 6 One of the first to use this approach in the nursing home industry is Grabowski and Stevenson (Reference Grabowski and Stevenson2008), which used a fixed radius of 25 km. However, as pointed out by Bowblis and North (Reference Bowblis and North2011), the size of radius can be different based on the population density in the local area. Therefore, markets are defined using a fixed radius around each nursing home based on population density. Specifically, the radius for nursing homes in the population density ranges of 0–99, 100–249, 250–599, and over 600 are 16.35, 13.73, 13.01 and 9.91 miles, respectively.Footnote 7
Using a fixed radius implies that each nursing home is in a separate market, resulting in 1902 market-year observations in 1039 markets.Footnote 8 To determine the nursing homes and assisted living facilities that compete within each market, the latitude and longitude of each facility is identified from zip codes and the distances between facilities are then computed using the ‘great circle’ distance formula. Any nursing home or assisted living facility that has a distance smaller than the fixed radius is considered within the market.
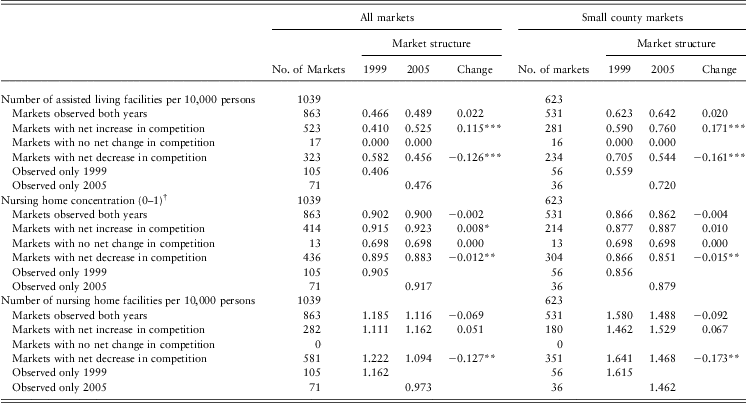
As discussed earlier, Ohio had a moratorium on new nursing home beds during the study period. The moratorium allowed nursing homes to trade beds within a county but not across county lines. This implies the number of nursing homes and distribution of beds among nursing homes within a county could change, but not the maximum number of beds. To account for this, two measures of nursing home market structure are used. The first is a measure of nursing home market concentration that accounts for the distribution of beds among nursing homes within a geographic area. The market concentration is measured as 1 minus the HHI.Footnote 9 The second measure is the number of nursing home facilities per 10,000 people. Assisted living market structure is measured as the number of assisted living facilities per 10,000 people. For all three measures, higher values imply more competitive markets and summary statistics for these measures are reported in Table 1.
Variation in market structure

†The concentration measure is defined as 1 minus the Herfindahl–Hirschmann Index. Higher values imply less market concentration.
***p < 0.01; **p < 0.05; *p < 0.1.
Since the regressions are based on regression to the mean, areas of Ohio with a greater population and hence more nursing homes will get a larger weight in the analysis. Variation in market structure is likely to be small in larger markets. For example, the largest three counties in Ohio (Cuyahoga, Franklin and Hamilton) have about 25% of all nursing homes in state in 1999 and combined with the next four largest in terms of number of nursing homes (Lucas, Montgomery, Stark and Summit), the seven largest counties represent about 40% of all nursing homes. Therefore, results are also reported for regressions in ‘small’ markets. A small market is defined as any nursing home not located in these seven counties.
Nursing home price variable
The nursing home price variable is the average daily private pay price charged by nursing homes in the calendar year. To account for inflation, private pay prices in 1999 are adjusted to 2005 dollars using the Consumer Price Index. Of the 1902 market-year observations, 211 observations are excluded from the analysis because private pay price is not reported, reported as zero, or is three standard deviations from the average price. This implies that equation (2) uses data from 1691 market-year observations.
Other controls
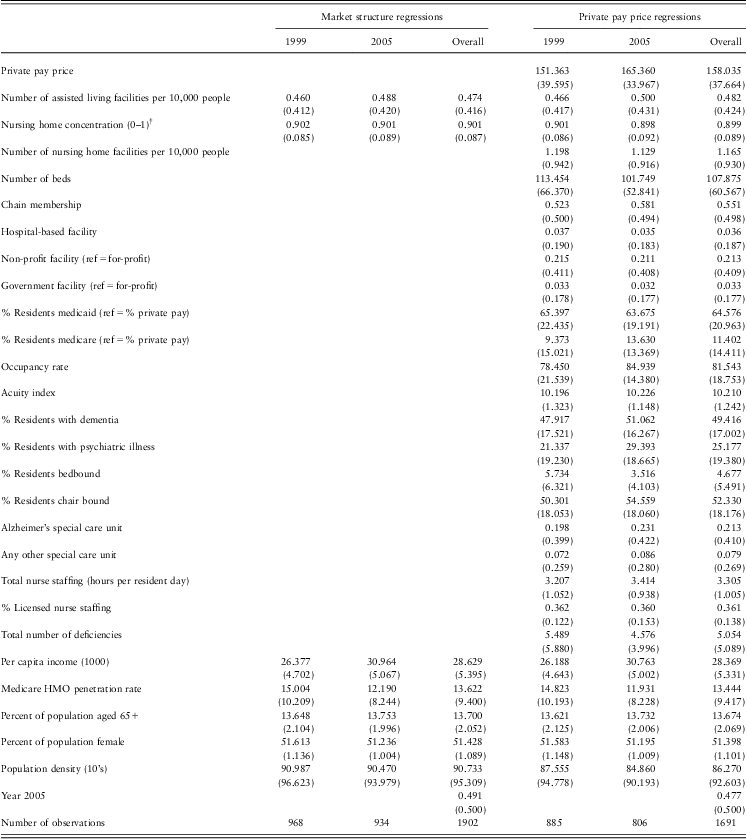
Equations (1) and (2) contain additional controls for market demographic characteristics. As pointed out by Stevenson and Grabowski (Reference Stevenson and Grabowski2010), assisted living facilities are more likely to locate in more affluent areas. Failure to control for market demographics could bias the effect of market structure. Market characteristics include per capita income, Medicare HMO penetration rates, percent of population aged 65+, percent of population that is female and population density. Equation (2) also controls for nursing home facility characteristics that can influence private pay price and can be broadly characterized as facility structure, case-mix and quality. Summary statistics for all control variables used in equations (1) and (2) are reported in Table 2.
Summary statistics for market structure and private pay price regressions
Notes: The table reports summary statistics for the nursing home market structure and nursing home private pay price regressions. Standard deviations for summary statistics are reported in parentheses.
†The concentration measure is defined as 1 minus the Herfindahl-Hirschmann Index. Higher values imply less market concentration.
Facility structure includes ownership status (i.e. for-profit, not-for-profit and government), number of beds, chain membership, hospital-based facility, payer-mix, occupancy rate and the presence of special care units. Each ownership status may be able to charge different prices, whereas nursing homes that are part of a chain or are hospital based have different cost-structures that are reflected in prices. The number of beds, together with occupancy rate, captures economies of scale in the regression equations. Finally, special care units, which include indicator variables of Alzheimer's and any other form of special care unit, can reflect price premiums consumers are willing to pay for specialized care.
Case-mix needs to be controlled for to capture the amount of care the average resident in each nursing home requires. Nursing homes that have residents that are more heavily dependent on nurse staff increase the cost of care, and this cost could be passed on to residents in the form of higher private pay prices. Physical case-mix is measured using the Acuindex (Cowles, Reference Cowles2002), and the percentage of residents that are chair bound and bedbound. Mental case-mix is captured by the percentage of residents with dementia and psychiatric illnesses.
The final set of nursing home facility characteristics included in the private pay price regressions are nursing home quality measures. There are multiple measures of nursing home quality and the quality measures used are reported in nursing home quality report cards available in Ohio before the federal implementation of national quality reporting in 2002. These quality measures include the total hours per resident day of nurse staffing, the percentage of nurse staffing that is licensed (i.e. registered nurses or licensed practical nurses), and the total number of regulatory deficiencies. Occasionally, nurse staffing variables are inaccurate and these observations are identified as nurse staffing levels three standard deviations above and below the sample mean. Inaccurate staffing observations are identified with an indicator variable for inaccurate staffing level and the total staff nurse staffing hours and percentage of licensed staff are recoded as zero.
Results
Variation in the change in market structure
Table 1 reports the summary statistics on market structure for assisted living facilities and nursing homes. Of the 863 nursing home markets and 531 small nursing home markets that have observations in both 1999 and 2005, the majority of nursing home markets experienced an expansion of the assisted living industry. The average expansion is 0.02 facilities per 10,000 persons. The overall rate of assisted living expansion between 1999 and 2005 is not statistically significant. However, for markets that experienced changes in the number of assisted living facilities in the market, these changes are found to be statistically significant at the 1% level with a magnitude that is larger in small markets.
Nursing home markets in Ohio are found to be more concentrated in 2005 than in 1999, though this masks the true variation in the change in market structure across the state. In terms of concentration ratios, slightly more than half of all markets experienced an increase in concentration, whereas three in five small markets experienced an increase in concentration. For those markets that experienced increased market concentration, these changes correspond to about a 1% to 2% increase in the market concentration. In comparison, when market structure is measured in terms of the number of nursing homes, a larger number of markets experienced a decrease in competition. For those markets that had fewer nursing homes per 10,000 persons in 2005, the average decrease in the entire market and small markets is 10.4% and 10.5%, respectively. These results are consistent with the fact that about 80 nursing homes closed in Ohio between 2000 and 2004. Overall, Table 1 suggests there is significant variation in market structure.
Nursing home market structure
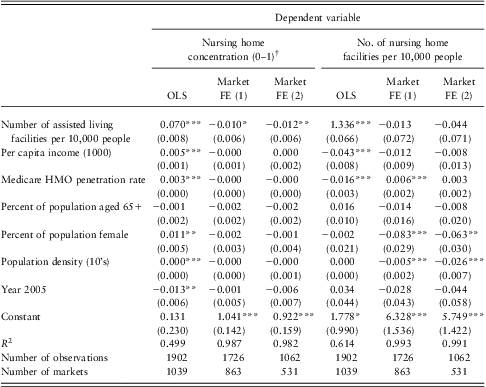
The regression coefficients for the market structure regressions of equation (1) are reported in Table 3. Six regressions are performed. The first set of three regressions use the dependent variable of nursing home market structure, whereas the second set of three regressions use the number of nursing home facilities per 10,000 persons. For both sets of regressions, pooled OLS estimates are reported first and then two regressions that include market fixed effects. The first of the fixed effects regression uses all market-year observations that are observed in both years, whereas the second fixed effects regression is restricted to small markets. It should be noted that the sample sizes for the fixed effects regressions are smaller than the pooled OLS because an observation is required for both 1999 and 2005.
Nursing home market structure regression results
OLS = ordinary least squares; HMO = health maintenance organization.
The table reports regression results for market-level regressions with a dependent variable that is one of two nursing home measures of market structure. The regressions are estimated using pooled OLS or linear fixed effects panel regression. Market FE (1) refers to regressions that include market fixed effects in all markets that have market-year observations in 1999 and 2005, whereas Market FE (2) refers to market-year observations in both years in small markets. Standard errors for the regression results are reported in parentheses and are robust to heteroscedasticity and clustering within market.
†The concentration measure is defined as 1 minus the Herfindahl–Hirschmann Index. Higher values imply less market concentration.
***p < 0.01, **p < 0.05, *p < 0.1.
An increase in the number of assisted living facilities per 10,000 persons is found to statistically increase the level of competition among nursing homes in the pooled OLS regressions regardless of how nursing home market structure is measured. This result would be consistent with nursing homes and assisted livings entering into larger more competitive markets. However, once market fixed effects are included, assisted living facility market structure has the opposite effect. For each 0.10 additional assisted living facilities per 10,000 persons, the nursing home market concentration ratio declines by 0.01 points and the number of nursing homes per 10,000 persons decline by 0.01 facilities. In small markets, a similar change in assisted living facility market structure is found. Interestingly, only the effect on the nursing home concentration ratio is statistically significant. These results suggest that a few nursing homes may close, but that nursing homes are more likely to reduce the number of beds they operate in response to assisted living expansion.
Impact of market structure on nursing home prices
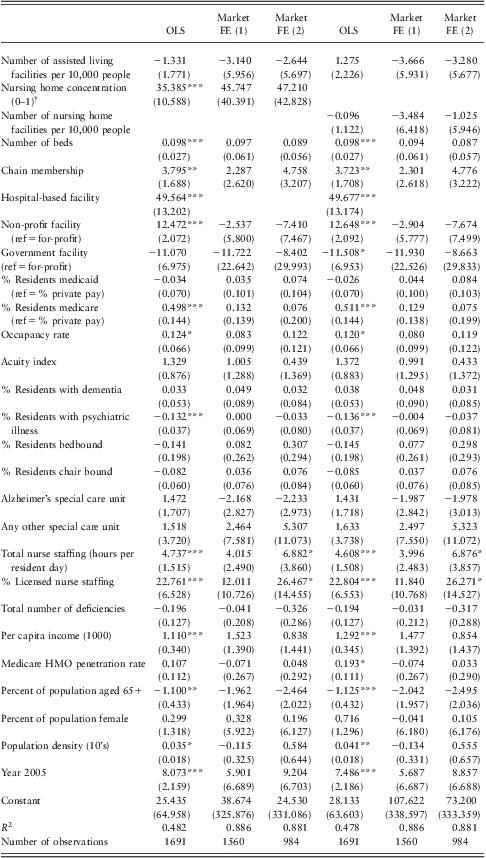
The second objective of the study is to determine how assisted living expansion affects nursing home private pay prices. The regression results are reported in Table 4. The first three regressions measure nursing home market structure as the concentration ratio and the second set of regressions use the number of nursing homes per 10,000 people. Similar to Table 3, the regressions are reported that use pooled OLS, market fixed effects for all markets, and market fixed effects for small markets. Since nursing home quality is included in both of these regressions, the dependent variable can be thought of quality-adjusted private pay price.
Nursing home private pay price regression results
OLS = ordinary least squares; HMO = health maintenance organization.
The table reports regression results for market-level regressions with a dependent variable of the average private pay price per day. The regressions are estimated using pooled OLS or linear fixed effects panel regression and include a variable for unreliable staffing levels. Market FE (1) refers to regressions that include market fixed effects in all markets that have market-years observations in 1999 and 2005, whereas Market FE (2) refers to market-years observations in both years in small markets. Standard errors for the regression results are reported in parentheses and are robust to heteroscedasticity and clustering within market.
†The concentration measure is defined as 1 minus the Herfindahl–Hirschmann Index. Higher values imply less market concentration.
***p < 0.01, **p < 0.05, *p < 0.1.
Between 1999 and 2005, the average daily private pay price increased from $151.36 to $165.36 (Table 2). Assisted living market structure is found to not have a statistically significant effect on private pay price, although the coefficient estimates are generally negative in magnitude and closer to zero in smaller markets. Similarly, once fixed effects are controlled for in the model, nursing home market structure is not found to affect private pay prices in all regressions. Finally, as one would expect, many of the control variables that are statistically significant in the pooled OLS regressions are not statistically significant in the fixed effects regression because these variables only vary slightly across time.
Additional robustness checks
A series of robustness checks are performed to verify the results are robust to alternative specifications. First, regressions that used the county to define the geographic market, rather than using a fixed radius, found results that are consistent with the regressions reported in the tables. Second, the pooled OLS regressions include market-year observations that are only observed once, whereas the fixed effects regressions are restricted to market-year observations that are in 1999 and 2005. Pooled OLS regressions that were restricted to only market-year observations that exist in both years have coefficient estimates that are statistically indistinguishable from the regression reported in Tables 3 and 4. Third, in addition to market demographic characteristics, the nursing home market structure regressions [equation (1)] can also control for the facility characteristics included in equation (2). The inclusion of these controls did not significantly change the coefficient estimates for the assisted living market structure variable. Finally, even though equation (2) contains market fixed effects, there is a chance that nursing home and assisted living market structure are endogenous. In one robustness check, nursing home market structure is excluded from the model, and the coefficient estimate for assisted living market structure is found to be robust. In another set of robustness checks, a series of exclusion restrictions, including the number of board and care facilities 13 years prior to each year, are used to estimate instrumental variable regressions. Valid exclusion restrictions are only found for the nursing home market structure variables. Instrumental variable regressions that treated nursing home market structure as endogenous still had coefficient estimates for assisted living and nursing home market structure that did not change the general conclusion of the findings.
Conclusion
The economics literature suggests that there is a fixed number of firms that can profitability enter a market (Gabszewicz and Thisse, Reference Gabszewicz and Thisse1980), but by differentiating products more firms of different types may profitability enter a market than only one type of firm (Cohen and Mazzeo, Reference Cohen and Mazzeo2007). This paper contributes to the understanding of how firms of different type affect one another by being the first to study how the expansion of the assisted living industry affected nursing home market structure and private pay prices. Empirical evidence supports the belief that recent growth in the number of assisted living facilities affected the nursing home industry. Assisted living facilities and nursing homes provide long-term care services, and by allowing more residents to delay entry into a nursing home, assisted living facilities reduce the number of days a person would demand nursing home care over their lifetime.
This decrease in demand is consistent with nursing homes reducing the number of beds available to consumers, and hence increasing market concentration. If these bed reductions are associated with the closure of nursing home wings, this allows the nursing home to reduce the fixed costs of heating and maintaining an underutilized section of the facility. Although nursing homes may reduce the number of beds, there is no evidence that they change the price charged to private-pay residents. These two results would be consistent with the expansion of assisted living industry inducing a negative demand shock to nursing homes, but a lack of competition between assisted livings and nursing homes. That is, if nursing homes are a viable alternative to care at an assisted living facility, nursing homes would reduce prices in order to increase demand. This is consistent with nursing homes and assisted living facilities being in different ‘product’ markets.
An important caveat of this study is that it only uses data from the State of Ohio. Since there is significant variation in assisted living regulation across the states, these results may not be generalizable to situations in other states. Additionally, the fixed effects regressions controls for unobserved heterogeneity that is fixed over time and local market demographics; however, there may still be other time-varying changes that are unobserved, such as the general improvement in the health of the elderly. For nursing home market structure, instrumental variable regressions confirm the presented results, but there is currently no identifiable exclusion restriction for assisted living market structure. However, a series of sensitivity checks suggest that the results are robust and any potential bias due to the endogeneity of assisted living market structure is likely to be small.
Although assisted living facilities provide care that is more preferred by the elderly, nursing homes are a necessary part of long-term care. The assisted living industry is not heavily regulated (Polzer, Reference Polzer2011) and entry into the market is significantly easier than entering the nursing home market. Since assisted livings do not have the capability to address the needs of the most severely dependent elderly, the delayed entry of the elderly into nursing homes due to aging in place at assisted livings is likely to be a short-run phenomena and unfettered entry of assisted livings into the market may hurt the ability of the nursing home industry to supply enough beds as the baby boomers age. States regulators that are considering or changing assisted living facility regulation should consider this balance when allowing new assisted living facilities to enter the market.
Acknowledgements
The author thanks Chuck Moul and Christopher Brunt for helpful comments. The author also want to thanks Robert Applebaum and Shahla Mehdizadeh for helpful discussions about the data. Financial support for this project was provided by the Ohio Long-Term Care Research Project.