1. Introduction
When conducting scientific experiments within the experiment cabinet of the space station, it is imperative to decontaminate the internal environment. However, manual disinfestation is inefficient. The adoption of the robot manipulator instead of manual operations has emerged as a prevalent trend. To ensure the efficient and safe completion of the experimental cabinet’s disinfection task, it is imperative to devise a movement trajectory for the robot manipulator. This trajectory should aim to minimize time, energy consumption, and jerk of the movement of the robot manipulator along the trajectory [Reference Shrivastava and Dalla1–Reference Ye, Hao and Cheng5].
The process of trajectory planning for a robotic manipulator constitutes a segment of motion planning. This motion planning can be bifurcated into two categories: path planning and trajectory planning. The primary function of trajectory planning is to append temporal information to the trajectory derived from path planning, thereby elucidating the manner in which the robotic arm should move along the path determined by path planning [Reference Gasparetto, Boscariol, Lanzutti and Vidoni6, Reference Tamizi, Yaghoubi and Najjaran7]. The trajectory planning of the robot manipulator can be primarily categorized into two types: joint space trajectory planning and Cartesian space trajectory planning [Reference Dai, Xiang, Zhang, Jiang, Qu and Zhang8]. Given that the control system manipulates the robot manipulator’s motion by managing its joints, trajectory planning is typically executed in the joint space. The planning of robot manipulator trajectories normally employs a variety of curve functions to construct the motion trajectory. Commonly used curve functions include cubic polynomial curves, quintic polynomial curves, seventh-degree polynomial curves, S curves, Bézier curves, B-spline curves, NURBS curves, etc [Reference Ekrem and Aksoy9, Reference Han, Song and Rim10]. The B-spline curve is extensively employed in trajectory planning due to its local support and the provision of continuous higher-order derivatives.
In the realm of trajectory planning, it is frequently necessary to optimize the robot manipulator’s trajectory for multiple objectives [Reference Wang, Li, Sun, Luo, Chen and Zhu11]. The robot manipulator’s trajectory optimization objectives primarily encompass time, energy consumption, and jerk [Reference Cao, Yan, Huang, Ai, Xu, Fu and Zou12]. Within the realm of robot manipulator trajectory planning, the time interval separating adjacent path points is frequently employed as a decision variable within the optimization method to optimize the objective. Conventional multi-objective optimization techniques typically employ weighted summation to convert a multi-objective challenge into a single-objective problem. Liu et al. [Reference Liu, Yi, Feng, Yao and Zhao13]. developed a novel objective function by integrating the motion time objective function with the joint acceleration objective function. Utilizing this, they identified the optimal motion trajectory by NSGA-II for the robot. Zhao et al. [Reference Zhao, Zhu and Song14]. introduced a trajectory optimization technique that integrates the hybrid whale algorithm with the particle swarm algorithm. This method transforms a multi-objective optimization challenge into a single-objective problem by employing the weighted coefficient approach. The optimization objectives focus on the robotic arm’s running time and jerk. Given the highly subjective nature of weight selection, this methodology may result in optimization outcomes that are either overly emphasized or overlooked for particular objectives. Consequently, these solutions may exhibit reduced diversity and lack the adaptability to accommodate dynamic scenario alterations. An alternative solution involves the direct optimization of multiple objectives via a multi-objective optimization algorithm [Reference Chettibi15, Reference Wang, Lin, Cao, Wu and Sun16]. The outcome of this method typically yields a series of non-dominated solutions, also known as Pareto optimal solutions. From the Pareto optimal solutions, the researcher can choose a solution that either aligns with one of the optimization objectives or offers a synergistic benefit across multiple objectives, contingent upon specific requirements [Reference Sun, Tao, Qin, Dong, Xu, Zhuang and Liu17]. Li et al. [Reference Li, Gu, Wu, Sun and Song18]. proposed a time and energy-based optimal joint trajectory planning model for multi-objective optimization using the fifth-degree B-spline curves and improved NSGA-II. Mathias et al. [Reference Halinga, Nyobuya and Uchiyama19]. achieved the minimum motion time and energy consumption for industrial robots with improved S-curve and NSGA-II. However, these studies predominantly concentrate on enhancing the performance of the robotic arm joints, often overlooking the path conditions of the end effector.
Based on the research presented above, this article conducts multi-objective trajectory planning for a robotic manipulator. The path planning for the experimental cabinet robotic manipulator has been completed. Within the joint space of the robotic arm, a primary trajectory function is established by interpolating path points utilizing the seventh-degree B-spline curve. From this foundational trajectory function, a constrained multi-objective optimization model is developed, emphasizing time efficiency, energy consumption, and jerk minimization. An innovative multi-objective optimization algorithm is then proposed to tackle this model. This algorithm incorporates an enhanced population initialization technique, leveraging the improved Tent chaotic mapping combined with opposition-based learning. This integration ensures a uniformly distributed and diverse initial population at the commencement of the algorithm. Subsequently, an adaptive differential evolution algorithm, rooted in a specific indicator, is introduced. This indicator guides the populations toward the most promising regions within the objective space, thereby elevating the quality of the solutions. The adaptive mechanism skillfully balances the global and local optimization capabilities of the differential algorithm, mitigating the risk of entrapment in local optima and ensuring successful convergence. In the final step, a trajectory selection method, founded on the concept of Fréchet distance, is formulated. This method assists in selecting trajectories that adhere to the geometric path constraints of the end-effector from the Pareto optimal solutions produced by the optimization algorithm.
The remainder of this paper is structured as follows: Section 2 introduces a constrained multi-objective optimization model specifically designed for robotic arm trajectory planning. The principle and operational process of the proposed trajectory planning algorithm are detailed in Section 3. Subsequently, Section 4 conducts pertinent experiments and provides an analysis of the results. The conclusions of this paper are summarized in Section 5.
2. The mathematical model of the trajectory planning problem
During sterilization procedures, it is critical to develop an optimized trajectory that ensures rapid and consistent positioning of the robotic manipulator’s end-effector within the target sterilization zone. Therefore, path planning in this plane was done in the Cartesian space before trajectory planning. Inverse kinematics allows for the transformation of a series of points, derived from path planning, into via-points in the joint space of the robot manipulator for trajectory planning. These via-points in joint space can be represented as
 \begin{equation} ^{m}p = \{ ^{m}p_{i} \} = \{ (t_{i}, ^{m}\theta _{i}) \} \quad i = 1,2,\ldots, N; \,m = 1,2,\ldots, M \end{equation}
where
 $^{m}p_{i}$
is the angle and time of the m-th joint at the i-th via-point;
 $t_{i}$
is the time at the i-th via-point; and
 $^{m}\theta _{i}$
is the angle of the m-th joint at
 $t_{i}$
.
To enhance the efficiency of the robot manipulator, it is imperative to minimize its movement time during trajectory planning. The cumulative movement duration of the robot manipulator along a given trajectory can be represented as [Reference Li, Lv, Zeng and Zhang20]
 \begin{equation} f_{1} = \sum _{i=0}^{N-1}\Delta t_{i} = \sum _{i=0}^{N-1} t_{i+1} - t_{i} = T \end{equation}
where
 $\Delta t_{i}$
represents the time interval between two adjacent points; T represents the cumulative time required for the robot manipulator to traverse from the initial trajectory point to its terminal point.
To minimize energy consumption during the robot manipulator’s movement, the root mean square (RMS) of acceleration can serve as the optimization objective. It can be denoted as [Reference He, Zhang, Sun and Shi21]
 \begin{equation} f_{2} = \sum _{m=1}^{M} \sqrt {\frac {1}{T}\int _{0}^{T}a_{m}^{2}(t)dt} \end{equation}
where
 $a_{m}(t)$
is the acceleration of the m-th joint.
To mitigate the impact of mechanical vibrations produced during robot manipulator movement and enhance its smoothness, the RMS of jerk can serve as the optimization objective. It can be denoted as [Reference Dai, Lefebvre, Yu, Geraedts and Wang22]
 \begin{equation} f_{3} = \sum _{m=1}^{M} \sqrt {\frac {1}{T}\int _{0}^{T}j_{m}^{2}(t)dt} \end{equation}
where
 $j_{m}(t)$
is the jerk of the m-th joint.
To ensure the reliability and safety of the robot manipulator, it is imperative to impose suitable constraints on its joint velocity, acceleration, and jerk. The constraints can be defined as
 \begin{equation} \left \{ \begin{array}{lr} |v_{m}(t)| \leq ^{m}V_{\max} & \\ |a_{m}(t)| \leq ^{m}A_{\max} & \\ |J_{m}(t)| \leq ^{m}J_{\max} & \\ \end{array} \right. \end{equation}
where
 $v_{m}(t)$
represents the velocity of the m-th joint at time t;
 $a_{m}(t)$
is the acceleration of the m-th joint at time t; and
 $j_{m}(t)$
is the jerk of the m-th joint at time t.
 $^{m}V_{max}$
,
 $^{m}A_{max}$
, and
 $^{m}J_{max}$
represent the upper bound of kinematic constraints, respectively.
Consequently, the task of trajectory planning for the robot manipulator can be conceptualized as a constrained multi-objective optimization problem. The mathematical model can be defined as
 \begin{equation} \begin{aligned} &{\min f_{1} = \sum _{i=0}^{N-1}\Delta t_{i} = \sum _{i=0}^{N-1} t_{i+1} - t_{i}} \\ &{\min f_{2} = \sum _{m=1}^{M} \sqrt {\frac {1}{T}\int _{0}^{T}a_{m}^{2}(t)dt}} \\ &{\min f_{3} = \sum _{m=1}^{M} \sqrt {\frac {1}{T}\int _{0}^{T}j_{m}^{2}(t)dt}} \\ &st. \left \{ \begin{array}{lc} |v_{m}(t)| \leq ^{m}V_{\max} \\ |a_{m}(t)| \leq ^{m}A_{\max} \\ |j_{m}(t)| \leq ^{m}J_{\max} \\ \end{array} \right. \end{aligned} \end{equation}
3. Proposed trajectory planning method
In this section, the seventh-degree B-spline curve is employed to construct the trajectory of the experimental cabinet robot manipulator in joint space. In the realm of trajectory planning, two superior interpolation curves are the fifth-degree and seventh-degree B-spline curves. the seventh-degree B-spline curve exhibits higher-order derivative continuity compared to its fifth-degree counterpart. This attribute ensures a smoother operation of the robotic arm and allows for the accommodation of more complex curve shapes. Moreover, the seventh-degree B-spline curve permits specification of boundary conditions for velocity, acceleration, and jerk, offering a more comprehensive set of constraints for the robot arm’s motion. Subsequently, this study proposes an adaptive differential evolution algorithm that utilizes a specific indicator to address the trajectory optimization problem associated with the robot manipulator. This approach yields the corresponding Pareto optimal solutions. Ultimately, the optimal trajectory that most closely aligns with the desired trajectory in Cartesian space is identified from the set of Pareto optimal solutions by employing the Fréchet distance calculation.
3.1. Construction of the B-spline
The B-spline curve, derived from the Bézier curve, not only retains all of the characteristics inherent to the Bézier curve but also introduces local control ability and derivative continuity [Reference Li, Huang and Chetwynd23]. These attributes make it particularly suitable for application in robot manipulator trajectory planning. In this research, the seventh-degree B-spline curve is employed to interpolate the via-point in joint space, ensuring continuity between the acceleration of the joint space and its derivatives. In this research, the B-spline curve is defined as
 \begin{equation} ^{m}p(u) = \sum _{i=0}^{N}{^{m}D_{i}N_{i,k}(u)} \end{equation}
where u denotes the normalized knot variable; k is the degree of the B-spline curve;
 $^{m}D_{i}$
denotes the i-th control point of the B-spline curve at the m-th joint; and
 $N_{i,k}(u)$
is the basis function of the B-spline curve.
To ensure the B-spline curve traverses both the initial and terminal points of the trajectory, the multiplicity of the knot points at both ends is set to k + 1. Thus, the knot vector of the seventh-degree B-spline curve can be defined as
 \begin{equation} U = [u_{0},\ldots, u_{k},u_{k+1},\ldots, u_{N+k-1},u_{N+k},\ldots, u_{N+2k}] \end{equation}
The knot vector is calculated as follows:
 \begin{equation} u_{l}=\left \{ \begin{array}{cc} 0 & l = 0,1,\ldots, k \\ u_{l-1} + \frac {t_{l-k}-t_{l-k-1}}{t_{N}-t_{0}} & l = k+1,\ldots, N+k-1 \\ 1 & l = N+k,\ldots, N+2k \\ \end{array} \right. \end{equation}
A seventh-degree B-spline curve for interpolating N + 1 trajectory points can be defined as
 \begin{equation} ^{m}p(u_{i+k}) = \sum _{j=i}^{i+k} {^{m}D_{j}N_{j,k}(u_{i+k})} =\ ^{m}p_{i} \quad j = 0,1,\ldots, N+k-1 \end{equation}
where j = 0, 1, 2,…, N + k - 1 represents N + k control points are prepared to be calculated;
 $N_{j,k}(u_{i+k})$
can be calculated by Cox-de Boor recursion formula [Reference R and de Boor24].
From Eq. (10), there are N + 1 known equations that can be used to solve N + k control points. The subsequent k - 1 equations can be derived from the s-th order derivative
 $^{m}p^{s}(u)$
of the curve. It can be defined as
 \begin{equation} ^{m}p^{s}(u) = \frac {d^{s}}{du^{s}}\sum _{j=0}^{N+k-1}{^{m}D_{j}N_{j,k}(u)}=\sum _{j=c-k+s}^{c}{^{m}D^{s}_{j}N_{j,k-s}(u)} \end{equation}
From Eq. (11), the s-th order derivative
 $^{m}p^{s}(u)$
is also the B-spline form.
 $^{m}D^{s}_{j}$
is the control point of
 $^{m}p^{s}(u)$
.
 $^{m}D^{s}_{j}$
can be formulated as
 \begin{equation} ^{m}D^{s}_{j}=\left \{ \begin{array}{cc} ^{m}D_{j} & s = 0 \\ \frac {(k-s+1)^{m}D_{j}^{s-1}-^{m}D_{j-1}^{s-1}}{u_{j+k-s+1}-u_{j}} & s \in N_{+} \\ j = c - k + s, c - k + s + 1, \ldots, c \\ \end{array} \right. \end{equation}
The 1-th order derivative, 2-th order derivative, and 3-th order derivative are the velocity, acceleration, and jerk of the robot manipulator, respectively. Due to the B-spline curve above, the control points of both ends still coincide with the starting point and ending point of the velocity, acceleration, and jerk. Therefore, the boundary conditions of the kinematic parameters can be defined as
 \begin{align} v_{m}(t_{0}) &= \sum _{j=1}^{k}{^{m}D^{1}_{j}N_{j,k-1}(u_{k})}=\ ^{m}D^{1}_{1} \end{align}
 \begin{align} v_{m}(t_{N}) &= \sum _{j=N}^{N+k-1}{^{m}D^{1}_{j}N_{j,k-1}(u_{N+k})}=\ ^{m}D^{1}_{N+k-1} \end{align}
 \begin{align} a_{m}(t_{0}) &= \sum _{j=2}^{k}{^{m}D^{2}_{j}N_{j,k-2}(u_{k})}=\ ^{m}D^{2}_{2} \end{align}
 \begin{align} a_{m}(t_{N}) &= \sum _{j=N+1}^{N+k-1}{^{m}D^{2}_{j}N_{j,k-2}(u_{N+k})}=\ ^{m}D^{2}_{N+k-1} \end{align}
 \begin{align} j_{m}(t_{0}) &= \sum _{j=3}^{k}{^{m}D^{3}_{j}N_{j,k-3}(u_{k})}=\ ^{m}D^{3}_{3} \end{align}
 \begin{align} j_{m}(t_{N}) &= \sum _{j=N+2}^{N+k-1}{^{m}D^{3}_{j}N_{j,k-3}(u_{N+k})}=\ ^{m}D^{3}_{N+k-1} \end{align}
where
 $v_{m}(t_{0})$
,
 $v_{m}(t_{N})$
,
 $a_{m}(t_{0})$
,
 $a_{m}(t_{N})$
,
 $j_{m}(t_{0})$
, and
 $j_{m}(t_{N})$
represent the velocity, acceleration, and jerk of the robot manipulator at start time
 $t_{0}$
and end time
 $t_{N}$
in joint space. B-spline trajectory has the option to choose k - 1 equations from Eqs. (13)–(18), which will be used to solve N + k control points. When k = 7, the trajectory can select the Eqs. (13)–(18) as the boundary conditions. The boundary conditions of the kinematic parameters at the start and end time could be defined flexibly according to the requirements. In this research, the values of the boundary conditions, include velocity, acceleration, and jerk, will be assigned to zero to promote the smooth movement of joints.
3.2. The proposed method for constrained multi-objective optimization
Upon obtaining the trajectory expression through B-spline curve fitting, an optimization model can be constructed. Subsequently, the optimal trajectory can be determined using a multi-objective optimization algorithm. In the optimization process, the time interval
 $\Delta t_{i}$
between two adjacent via-points serves as the decision variable for the algorithm. By altering the decision vector, which comprises a series of decision variables, the knot vector U of each joint’s B-spline trajectory can be modified. Consequently, this allows for adjustments to the B-spline trajectory of each joint, facilitating the attainment of joint space trajectories with varying objective values. The algorithm operates on a population, where each individual, denoted as
 $x_{n}$
, represents a trajectory
 $^{m}p(u)$
derived from a specific decision vector. The optimization algorithm, by modulating the decision vectors of each entity within the population, effectively directs the population’s evolution toward the global optimum. This process consequently yields a series of optimal solutions for trajectory planning.
3.2.1. Population initialization
To augment the diversity and randomness of the initial population, thereby enhancing the algorithm’s global optimization capability during its preliminary stages, it is imperative to devise a suitable population initialization strategy [Reference Pervaiz, Bangyal, Ashraf, Nisar, Haque, Ibrahim, Chowdhry, Rasheed, Rodrigues, Etengu and Rawat25]. The Tent chaotic mapping, a nonlinear mapping function, is capable of a generating initial population that exhibits a more uniform distribution and superior diversity compared to conventional strategies. The proposed optimization algorithm utilizes a refined Tent chaotic mapping function for the initialization of the population. It can be defined as
 \begin{equation} z_{n+1} = \left \{ \begin{array}{cc} \frac {z_{n}}{\alpha } + \frac {rand(0,1)}{num} & z_{n} \in [0,\alpha ) \\[0.5cm] \frac {1-z_{n}}{1-\alpha } + \frac {rand(0,1)}{num} & z_{n} \in [\alpha, 1] \\ \end{array} \right. \end{equation}
where
 $\alpha$
is the parameter of Tent chaotic mapping; num is the number of the individuals in the initial population; rand(0,1) signifies a random number; and
 $z_{n}$
is the generated sequence of chaotic random numbers in
 $[0, 1]$
, falling within the interval [0,1]. In contrast to the conventional Tent chaotic mapping function, this enhanced function incorporates a random term, denoted as
 $\frac {rand(0,1)}{num}$
. This addition serves to deter the chaotic sequence from settling into minor and unstable periodic points throughout the iterative process. Utilizing a sequence of random numbers, denoted as
 $z_{n}$
, one can randomly generate a series of decision variables. These variables are derived from the upper and lower bounds specific to the decision variables, thereby obtaining the corresponding individuals that constitute a chaotic population, represented as
 $P_{c}$
.
Following the generation of the initial population via the enhanced Tent mapping, the opposition-based learning strategy is employed to further initialize this population [Reference Chou and Truong26]. This approach serves to broaden the search range of the population and augment its global optimization capability. The opposition-based learning is represented as
 \begin{equation} {D^{v}_{P_{o}} = D^{v}_{P_{up}} + D^{v}_{P_{low}} - D^{v}_{P_{c}}} \end{equation}
where
 $D^{v}_{P}$
is the vector consisting of the decision vectors of all individuals in the population P;
 $P_{o}$
is the opposition population generated;
 $P_{up}$
represents the population in which the decision vector for each individual reaches the upper bound;
 $P_{low}$
represents the population in which the decision vector for each individual reaches the lower bound; and
 $P_{c}$
is the population generated by Tent chaotic mapping. The number of individuals in
 $P_{up}$
,
 $P_{low}$
,
 $P_{c}$
is equal. Initially, the decision vectors for individuals within populations
 $P_{up}$
,
 $P_{low}$
, and
 $P_{c}$
are used by Eq. (20). This allows us to derive the decision vectors for individuals in population
 $P_{o}$
, thereby establishing population
 $P_{o}$
. And then,
 $P_{o}$
is combined with
 $P_{c}$
to obtain a new population
 $P_{com}$
. The individuals within
 $P_{com}$
are then organized in a non-dominated sorting. The selection of individuals from this sorted order forms the final initialized population
 $P_{i}$
.
3.2.2. Improved adaptive differential evolutionary algorithm
The Differential Evolution operator, initially proposed by Price and Storn, is characterized by its simple structure, ease of implementation, robustness, and superior global search capability [Reference Slowik and Kwasnicka27]. The operator can be defined as
 \begin{equation} v_{i} = \left \{ \begin{array}{cc} x^{r1}_{i} + F \cdot (x^{r2}_{i} - x^{r3}_{i}) & CR_{i} \\[0.3cm] x^{r1}_{i} & 1-CR_{i} \\ \end{array} \right. \end{equation}
where
 $v_{i}$
is the difference vector,
 $x^{r1}_{i}$
,
 $x^{r2}_{i}$
, and
 $x^{r3}_{i}$
represent the i-th individuals from each of the three parent populations, and F is the scaling factor;
 $CR_{i}$
is the crossover probability of the i-th individual. In Eq. (21), the influence of the scaling factor F on the search capability of the differential evolution operator is significant. An increased value of F augments the algorithm’s capacity to escape from a local optimum solution, thereby mitigating the risk of it becoming trapped in such a state. However, an excessively large F may result in the algorithm failing to converge to the optimal solution. A smaller F ensures that the population converges to the optimal solution at a later stage of the algorithm. To strike a balance between the algorithm’s global and local optimization capabilities, an adaptive parameter-tuning strategy is designed. The adaptive tuning of the parameter F can be expressed as
 \begin{equation} F(time) = e^{-(\frac {time}{maxtime})^{q}} \end{equation}
where time represents the current number of iterations executed by the algorithm; maxTime signifies the maximum allowable number of iterations for the algorithm; q denotes the rate of change adjustment parameter.
 $CR_{i}$
regulates the amount of information that is transmitted from parents to offspring during recombination.
 $CR_{i}$
adheres to a normal distribution, characterized by a mean value denoted as CRm and a standard deviation of 0.1, which is formulated as
 \begin{equation} CR_{i} = Normal(CRm, 0.1) \end{equation}
where
 $Normal(CRm, 0.1)$
is a random real number generated from a normal distribution with expectation CRm and the standard deviation of 0.1. is a real number in the interval [0,1]. CRm can be updated using Eq. (24). It can be formulated as
 \begin{equation} CRm_{i+1} = w_{cr} \cdot CRm_{i} + (1 - w_{cr}) \cdot meanCRS \end{equation}
where
 $w_{cr}$
is the weight factor randomly generated in [0.9,1.0]; meanCRS refers to the Hölder mean of the probability associated with the successful completion of the crossover operation. It is formulated as
 \begin{equation} { meanCRS = (\frac {1}{numCRS}\sum _{x =x_{1}}^{x_{numCRS}} {x^{n}})^{\frac {1}{n}} } \end{equation}
where numCRS is the number of the probability associated with the successful completion of the crossover operation; CRSuccess is the set of the probability associated with the successful completion of the crossover operation.
In this study, the offspring population is generated by the neighbor pairing strategy, proposed adaptive differential evolutionary operator, and polynomial mutation. This amalgamation yields superior performance in comparison to conventional methods in many tests.
3.2.3. Indicator-based constraint handling technique
Existing constraint handling techniques tend to overemphasize the feasibility of solutions, often viewing optimization constraints as a more critical task than the optimization objective itself. This approach can potentially lead to the population becoming easily ensnared in local feasible regions. Consequently, it may restrict the global exploration of the objective space and predispose the algorithm to fall into a local optimum. To solve this problem, the research employs an indicator-based constraint handling technique proposed in [Reference Yuan, Liu, Ong and He28]. It can be defined as
 \begin{equation} I(x|\chi ) = \min _{y \in \chi \backslash x}{I(x|y)} \end{equation}
where x and y denote any two solutions, while
 $\chi$
signifies the set of solutions; the
 $I(x|y)$
can be defined as
 \begin{equation} I(x|y) = \left \{ \begin{array}{lc} \log {CV(F(x)|F(y))} & \varphi (x) = 0, \varphi (y) = 0 \\ \infty & \varphi (x) = 0, \varphi (y) \neq 0\\ \log {CV(F(x)|F(y))} & \varphi (x) \neq 0, \varphi (y) = 0 \\ \max \!{(d^{CV}(F(x),F(y)), \log {\frac {\varphi (y)}{\varphi (x)}})} & {otherwise} \\ \end{array} \right. \end{equation}
where
 $\varphi$
is the overall constraint violation calculated as Eq. (28);
 $CV(F(x)|F(y))$
is the cost value base distance calculated as Eq. (29); and
 $d^{CV}(F(x),F(y))$
can be formulated as Eq. (30).
 \begin{align} \varphi (x) &= \sum _{i=1}^{k}{\max \!(0, h_{i}(x))} \end{align}
 \begin{align} CV(F(x)|F(y)) &= \left \{ \begin{array}{cc} \mathop {\min }_{\alpha \in {1,2,3}} \frac {f_{\alpha }(y)}{f_{\alpha }(x)} & \exists {f_{\alpha }(y) \gt f_{\alpha }(x)} \\[0.5cm] \mathop {\max }_{\alpha \in {1,2,3}}{\frac {f_{\alpha }(y)}{f_{\alpha }(x)}} & {otherwise} \\ \end{array} \right.\\[-8pt]\nonumber \end{align}
 \begin{align} d^{CV}(F(x),F(y)) &= \log {\max \!(CV(F(x)|F(y)), CV(F(y)|F(x)))} \end{align}
In Eq. (28),
 $h_{i}(x)$
represents the disparity between the actual value, derived by solution x in the i-th constraint, and the boundary of said constraint. In Eq. (29)–(30),
 $F(x)$
is the set of the objective values of solution x, which can be formulated as
 $F(x) = \{f_{1}(x), f_{2}(x), f_{3}(x)\}$
.
The proposed indicator can measure the quality of individuals in the population. For an individual x in the population
 $\chi$
, if
 $I(x|\chi )$
is larger, the higher the quality of x in the population
 $\chi$
. For an individual
 $x_{i}$
in population
 $\chi$
, if
 $I(x_{i}|\chi ) \lt 0$
, then there is at least an individual
 $x_{j}$
in population
 $\chi$
that is of better quality than
 $x_{i}$
. This property suggests that when
 $I(x_{i}|\chi ) \geq 0$
, individual
 $x_{i}$
is located in a promising area of the objective space, and the individuals in this area are of higher quality compared to the other individuals in the population. It shows that the algorithm is able to guide the population to optimize toward the promising area.
The indicator integrates information about the objectives and limitations of each individual within the population. During the algorithmic search process, the metric has the capacity to preserve certain underperforming yet promising solutions, thereby enhancing the overall performance of the algorithm’s output.
3.2.4. The procedures of the constrained multi-objective optimization algorithm
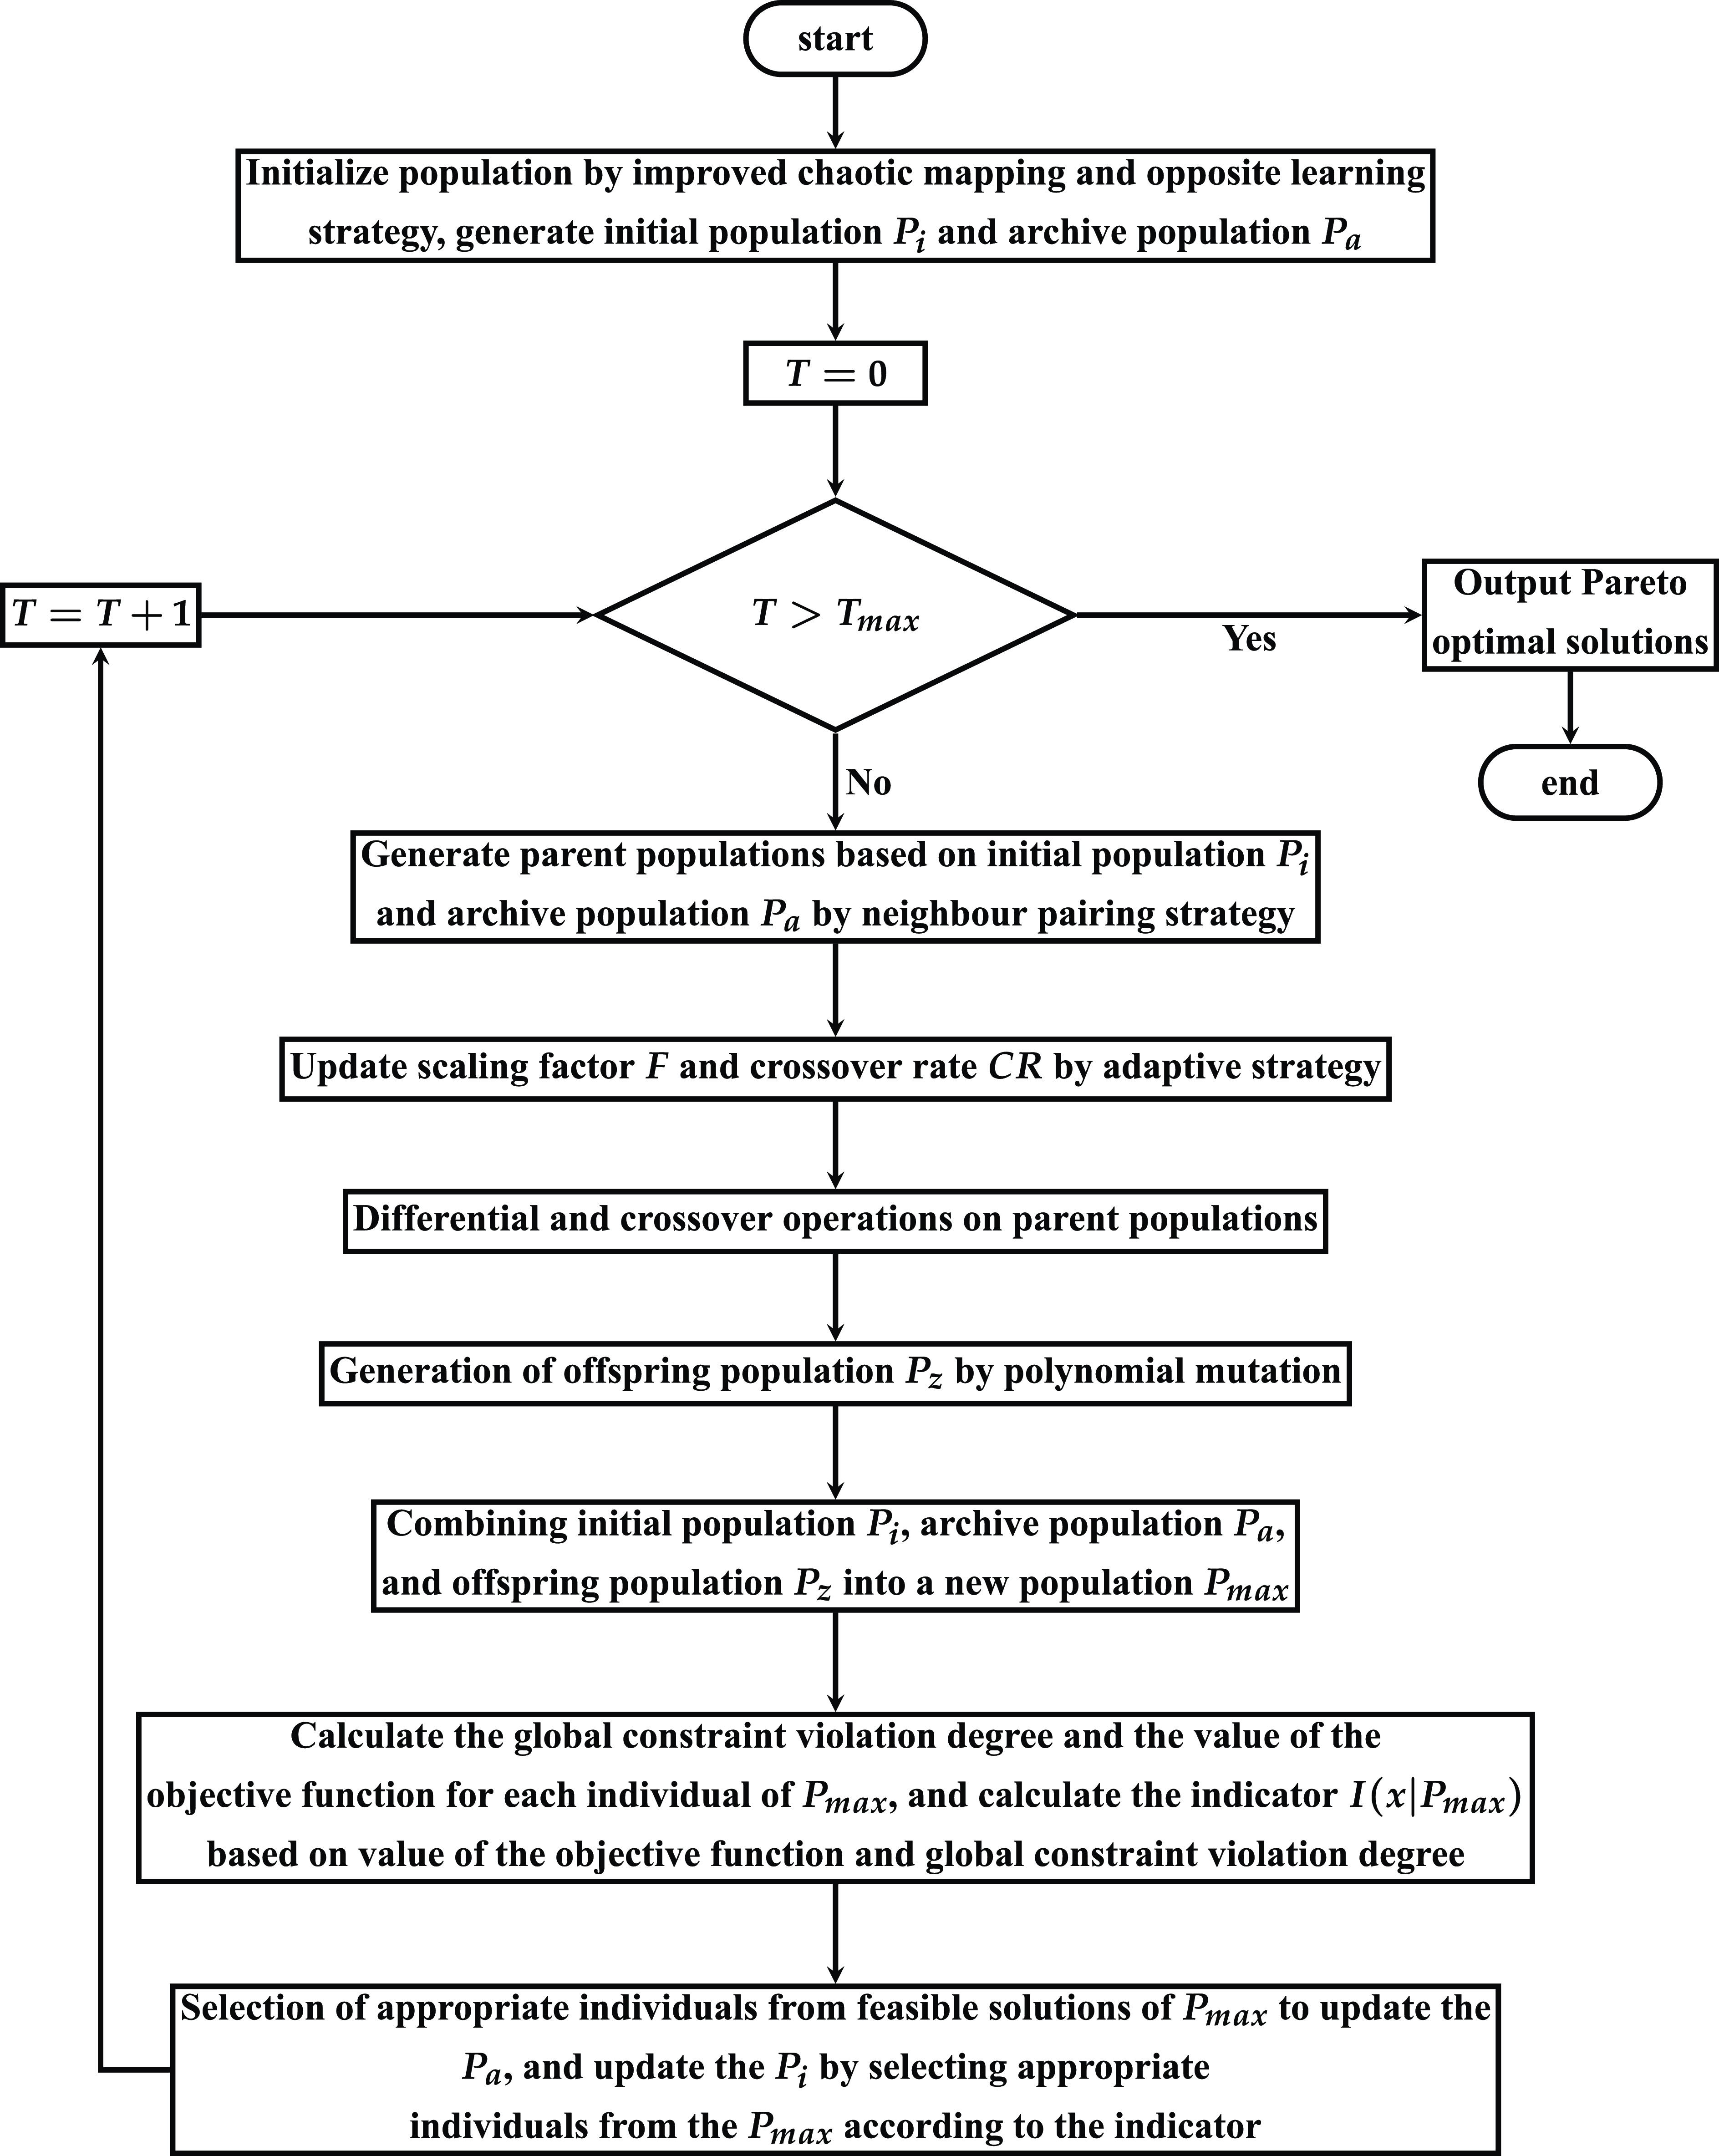
The flow of the proposed optimization algorithm is depicted in Figure 1. Initially, the population
 $P_{i}$
is generated using an enhanced Tent chaotic mapping with the opposition-based learning strategy. Concurrently, a duplicate population
 $P_{a}$
is established as an archive population. This archive serves to preserve the optimal feasible individuals produced by the algorithm during each iteration. Subsequently, populations
 $P_{i}$
and
 $P_{a}$
are amalgamated into a novel population based on a predetermined ratio. This newly formed population is then partitioned into multiple parent populations utilizing a neighbor pairing strategy. Then, the parameters of the differential evolution operator are refined utilizing the proposed adaptive strategy. Subsequently, the parameters of the differential evolution operator are refined using the proposed adaptive strategy. The parent population, derived from the preceding step, serves as the input to execute the suggested adaptive differential evolution algorithm, resulting in the offspring population
 $P_{z}$
. Following this, the populations
 $P_{i}$
,
 $P_{a}$
, and
 $P_{z}$
are amalgamated into a new population, denoted as
 $P_{\max}$
.
The optimization algorithm flowchart.

 $P_{i}$
and
 $P_{a}$
need be revised following the acquisition of the population
 $P_{\max}$
. The following is the process of updating the population
 $P_{i}$
using an indicator-based approach: at first, calculate the indicator value of each individual in
 $P_{\max}$
according to Eq. (26), and filter the individuals in the promising region from
 $P_{\max}$
to form a subset
 $P_{sub}$
according to Eq. (31). Second, the algorithm evaluates if the number of individuals in
 $P_{sub}$
equals that in
 $P_{i}$
. If
 $P_{sub}$
has fewer individuals than
 $P_{i}$
, those with superior indicators are chosen from the remaining individuals in
 $P_{max}$
to fill the gap. Conversely, if
 $P_{sub}$
exceeds the count in
 $P_{i}$
, it becomes imperative to evenly divide the promising region and allocate the individuals in
 $P_{sub}$
across each delineated subregion. Subsequently, one must identify the subregion with the highest density of individuals and remove those exhibiting the poorest metrics. The refined
 $P_{sub}$
, comprising the survivors, is then poised to engage in the subsequent iteration as the updated
 $P_{i}$
.
The primary procedure for updating the
 $P_{a}$
is delineated as follows: initially, the degree of constraint violation for each individual is computed in accordance with Eq. (28). Subsequently, feasible individuals are culled from
 $P_{\max}$
to constitute a novel population,
 $P_{a}$
. The subsequent step involves assessing whether the quantity of individuals within the newly formed
 $P_{a}$
aligns with that of the original
 $P_{a}$
. In instances where the new
 $P_{a}$
possesses fewer individuals, those exhibiting minimal constraint violation degree are selected from remaining individuals in
 $P_{\max}$
to augment it. Conversely, if the new
 $P_{a}$
harbors an excess of individuals, the environmental selection strategy inherent to PREA [Reference Yuan, Liu, Gu, Zhang and He29] is employed to select individuals equivalent to the count in the original
 $P_{a}$
. Ultimately, the chosen individuals coalesce to form a new
 $P_{a}$
population, poised to engage in the subsequent iteration of the algorithm.
 \begin{equation} P_{sub} = \{x|I(x|P_{\max}) \geq 0, x \in P_{\max}\} \end{equation}
3.3. Selection of optimal trajectories in Cartesian space
In the realm of robot manipulator trajectory planning, it is often observed that a trajectory designed in joint space may not adequately accommodate the motion of the robot manipulator’s end in Cartesian space. Direct trajectory planning within Cartesian space. However, necessitates substantial computational resources to determine the kinematic inverse solution. Moreover, this approach carries the risk of encountering singularities, which could result in uncontrolled joint velocities. Therefore, this research proposes a method that allows for the consideration of trajectories in Cartesian space during joint space trajectory planning. The objective of this method is to identify an optimal trajectory from the Pareto optimal solutions procured by the optimization algorithm. This trajectory should bear the closest resemblance in shape to the desired path within Cartesian space. The selection of an appropriate metric to gauge the similarity of trajectory shapes in Cartesian space is paramount.
The Fréchet distance is frequently employed to quantify the similarity between curves in spatial representations [Reference Gudmundsson, van Renssen, Saeidi and Wong30]. It can be defined as
 \begin{equation} \delta _{F}(T, S) = \inf _{\alpha, \beta }\max _{t \in [0,1]}{d(T(\alpha (t)), S(\beta (t)))} \end{equation}
where T and S denote two successive curves in Cartesian space;
 $\alpha$
and
 $\beta$
represent two functions that operate over the interval [0,1]; d represents the distance metric function within Cartesian space; and
 $\delta _{F}(T, S)$
is the Fréchet distance between T and S. When the curve T is close to the curve S, the
 $\delta _{F}(T, S)$
is smaller; if reversed, the
 $\delta _{F}(T, S)$
is larger. By choosing the optimal trajectory from the Pareto optimal solutions, which has the smallest Fréchet distance
 $\delta _{F}(T, S)$
from the desired path in Cartesian space, it is feasible to conduct joint space trajectory planning while simultaneously meeting the end motion requirements of the robot manipulator in Cartesian space.
4. Experiments and analysis of results
To demonstrate the effectiveness of the proposed trajectory planning method, the proposed indicator-based adaptive differential evolution algorithm (IADEA) and several advanced optimization methods are used for the trajectory planning problem of the robotic arm within the experimental cabinet separately and compared in this experiment. In addition, the simulation results of the proposed trajectory planning method are shown and the effectiveness of the trajectory selection strategy in Cartesian space is verified. Finally, the interpolation performance of the seventh B-spline curve with cubic polynomial curve and quintic polynomial curve is comparatively analyzed.
4.1. Establishment of robot manipulator motion model and initialization of trajectory planning methods
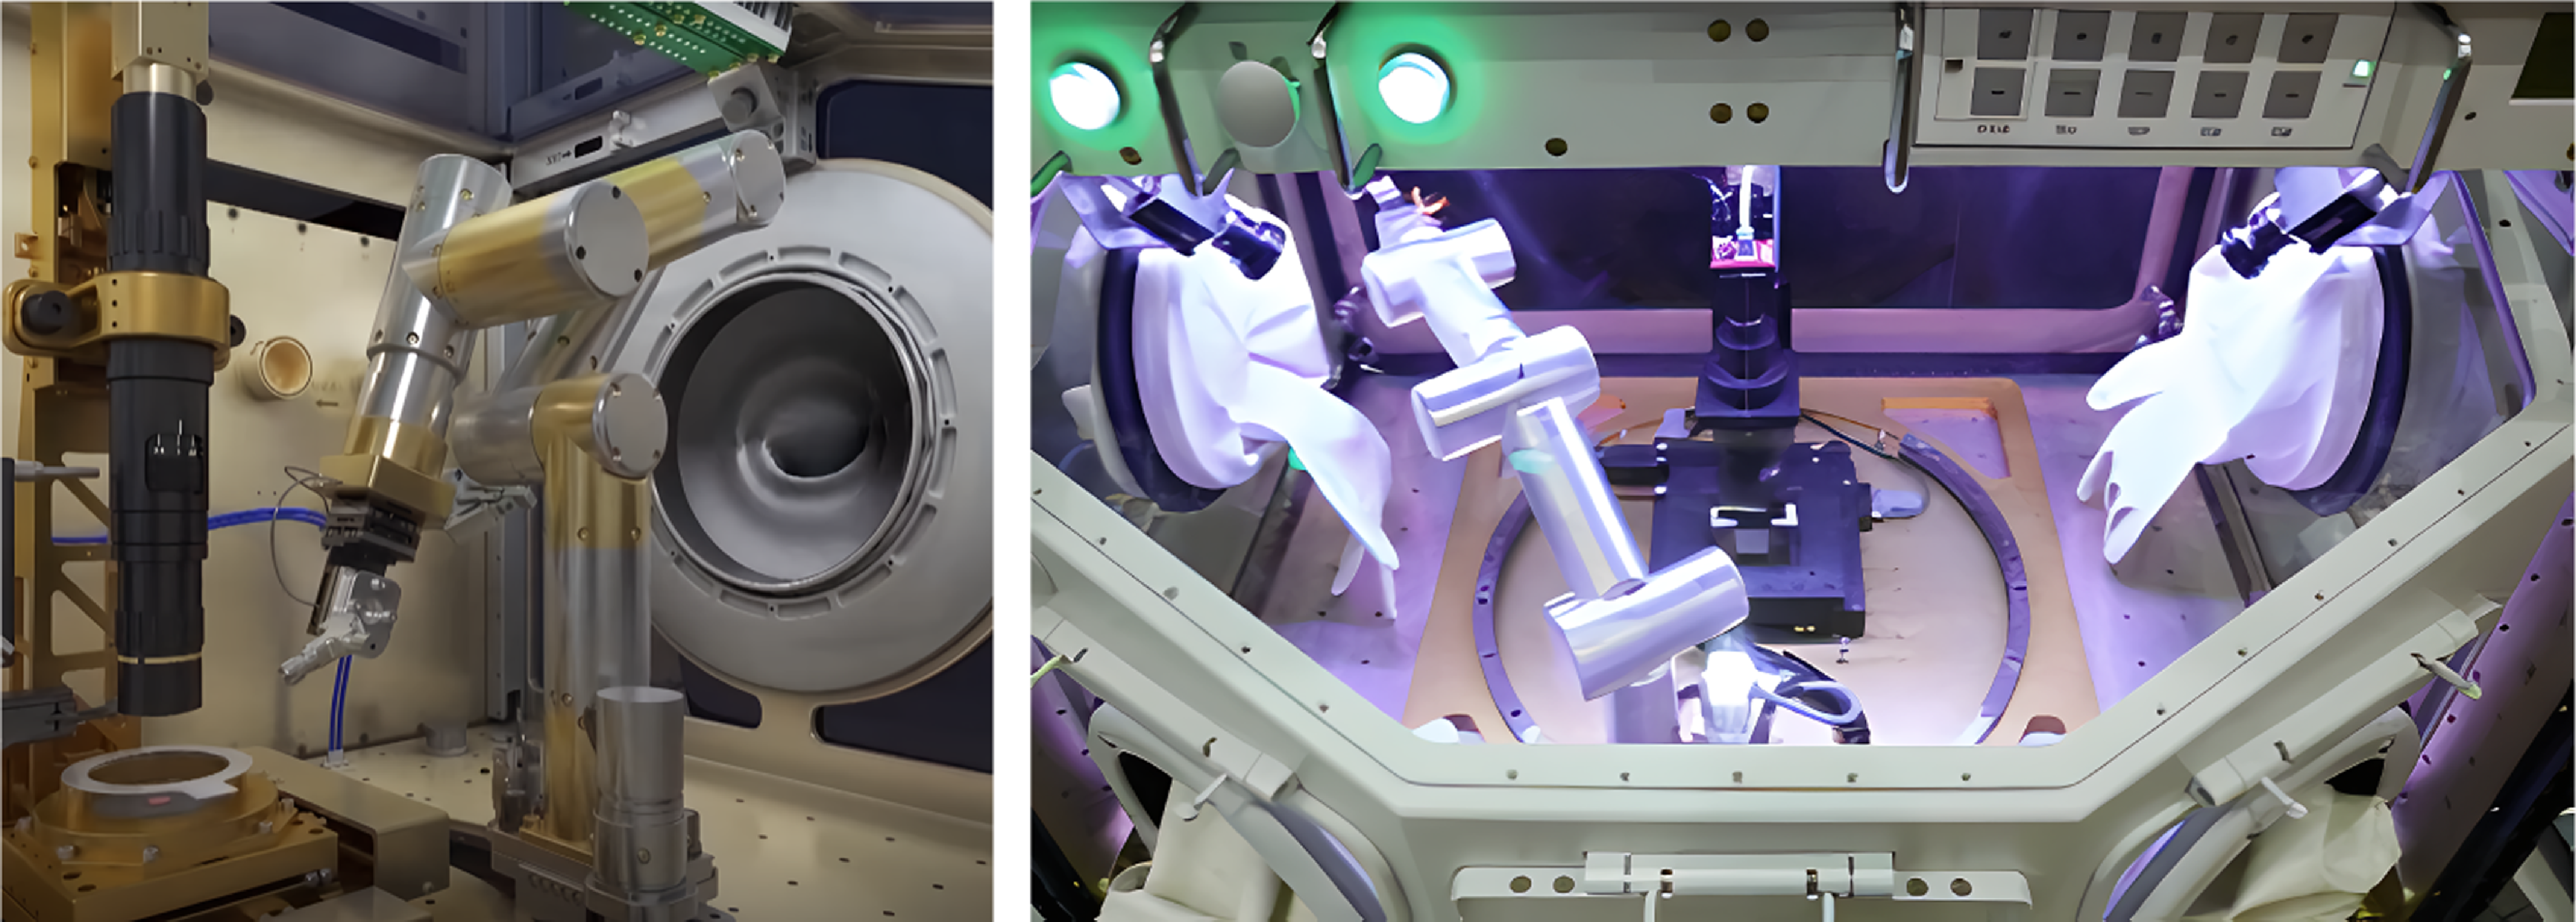
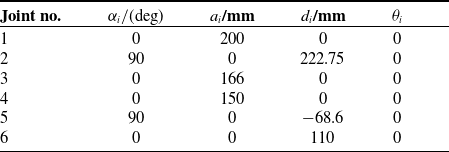
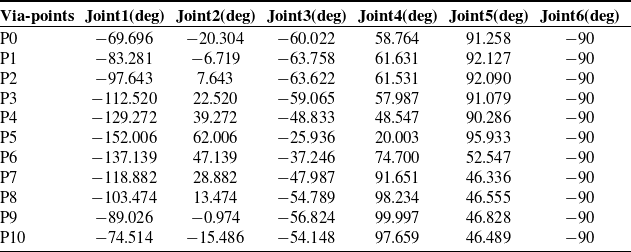
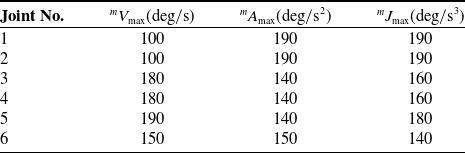
Path data obtained from the robotic arm platform in the experimental cabinet in the Wentian Lab Module were used to validate the effectiveness of the trajectory planning approach. Figure 2 shows a prototype of the robotic arm in the experimental cabinet. The trajectory planning of this robotic arm requires the creation of a corresponding kinematic model. The D-H parametric method is frequently employed to model the kinematics of a robotic arm and to determine both the forward and inverse kinematic solutions. In this study, the planned joint space trajectories need to be obtained by solving the kinematic inverse of the robotic arm model to get the corresponding end trajectories. The standard D-H parameters of the experimental cabinet robot manipulator are listed in Table I. With D-H parameters and inverse kinematics, path points in Cartesian space can be transformed into the via-points in joint space. The via-points in joint space are shown in Table II. The velocity constraints, acceleration constraints, and jerk constraints for each joint are shown in Table III.
The robotic arm of the experiment cabinet in the space station.

All experiments and simulations are implemented on MATLAB R2023b on a PC running Windows x64, a 13th Gen Intel(R) Core (TM) i5-13600KF @3.50 GHz CPU, and 32 GB of RAM. The codes of the optimization algorithms used are taken from PlatEMO [Reference Tian, Cheng, Zhang and Jin31], a MATLAB platform for multi- or many-objective optimization. At the beginning of the experiment, the population size is set to 200, and the maximum number of function evaluations is set to 100,000. The upper limit of the time interval is 5 s, and the lower limit of the time interval is 0.5 s. The parameter
 $\alpha$
of Tent chaotic mapping is 0.499. The weight factor
 $w_{cr}$
is 0.9. The rate of change adjustment parameter q is 0.6.
D-H parameters of the robot manipulator.

4.2. Optimization method performance validation
The comparative experiments were designed to validate the efficacy and superiority of the proposed constrained multi-objective optimization method in addressing the trajectory planning problem for the experimental cabinet robot manipulator. Five advanced constrained multi-objective optimization algorithms were selected as benchmarks: Coevolutionary constrained multi-objective optimization (CCMO) [Reference Tian, Zhang, Xiao, Zhang and Jin32], Two-stage evolutionary algorithm with three indicators (TSTI) [Reference Dong, Gong, Ming and Wang33], NSGA-II [Reference Deb, Pratap, Agarwal and Meyarivan34], Evolutionary multitasking-based constrained multiobjective optimization (EMCMO) [Reference Qiao, Yu, Qu, Liang, Song and Yue35], and NSGA-III [Reference Deb and Jain36]. The objective of this experiment was to employ suitable indicators to assess the optimization results of the algorithm. Within the realm of constrained multi-objective optimization, two evaluation indicators are commonly employed: inverted generational distance plus (IGDp) and hypervolume (HV). Both indicators serve to evaluate the performance of the algorithm and the quality of the Pareto optimal solutions derived [Reference Cai, Xiao, Li, Hu, Ishibuchi and Li37, Reference Zitzler, Brockhoff, Thiele, Obayashi, Deb, Poloni, Hiroyasu and Murata38].
Via-points in joint space.

Velocity, acceleration, and jerk constraints for robot manipulator.

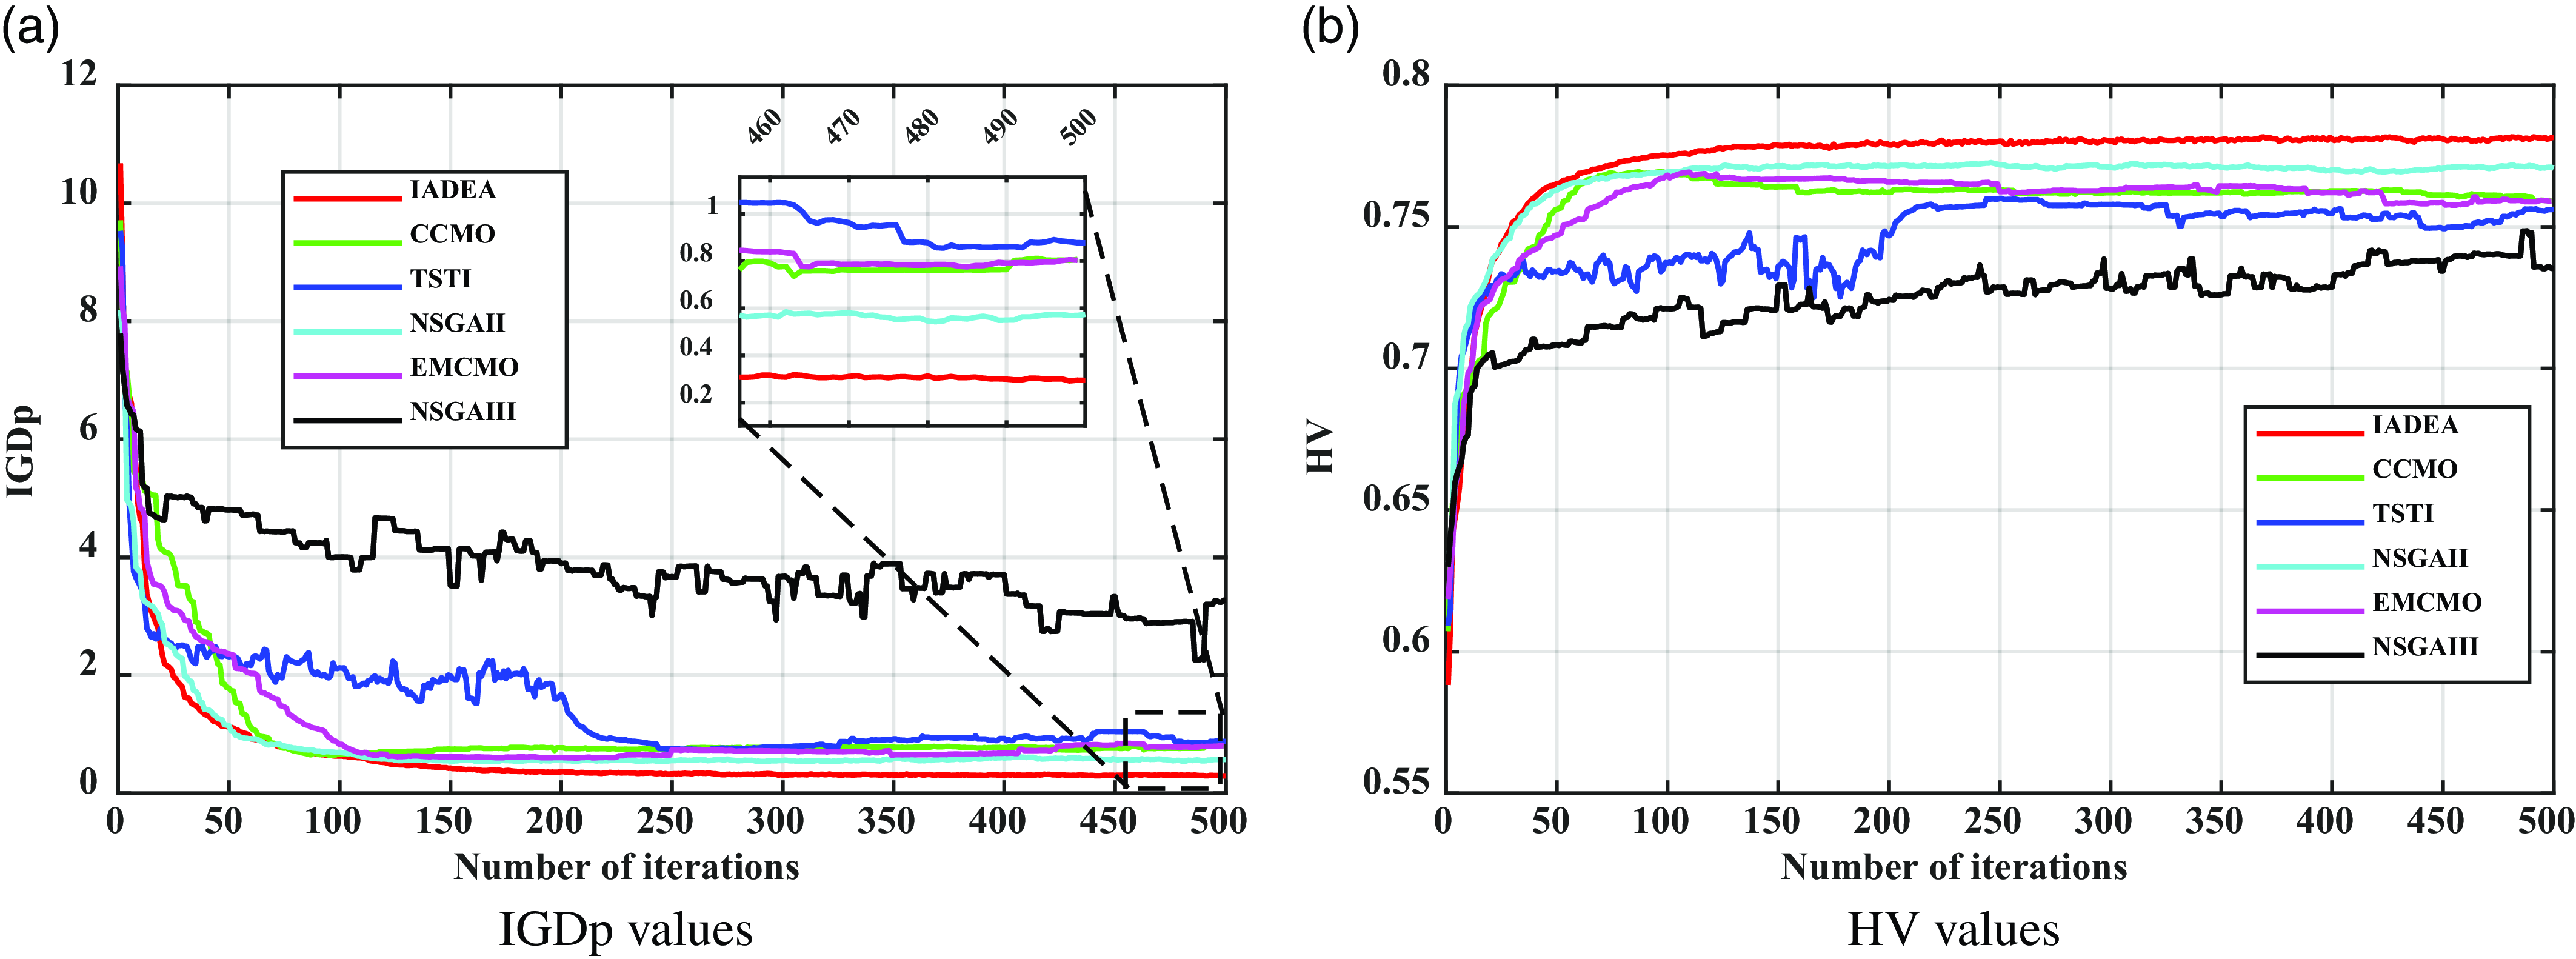
The IGDp is an enhanced version of the IGD, developed to rectify its non-compliance with the Pareto criterion. This indicator gauges the distance between the algorithm’s Pareto optimal solutions in the objective space and the actual constrained Pareto solutions. A smaller IGDp signifies that the solutions derived from the algorithm are closer to the true constrained Pareto optimal solutions, suggesting a superior solution quality. Nonetheless, computing this indicator necessitates knowledge of the genuine solutions, which is typically elusive in real-world engineering problems. Numerous scholars have suggested using approximate constrained Pareto optimal solutions as the benchmark for the IGDp. This study employs a gridding technique introduced in ref. [Reference Cai, Xiao, Li, Hu, Ishibuchi and Li39] to determine the approximate constrained Pareto optimal solutions, subsequently utilizing these solutions to compute the IGDp. The IGDp for various optimization algorithms on robot manipulator trajectory planning is depicted in Figure 3(a).
Convergence profiles of the six algorithms.

The HV indicator denotes the volume bounded by the Pareto optimal solutions derived from the optimization algorithm and the reference point within the objective space. A larger HV indicator signifies a more widely dispersed Pareto optimal solutions, indicating superior solution quality and enhanced algorithm performance. Figure 3(b) presents the HV for various optimization algorithms addressing robot manipulator trajectory planning.
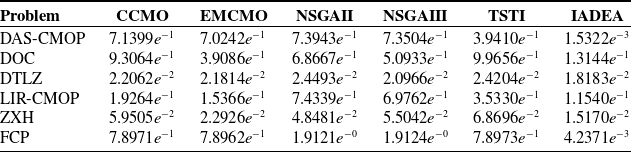
IGDp indicators for each algorithm on other optimization problems.

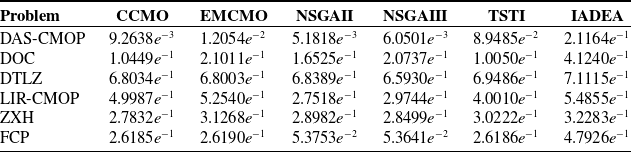
HV indicators for each algorithm on other optimization problems.

To assess the efficacy of the proposed multi-objective optimization algorithm, it was applied to six representative multi-objective optimization problems and its performance was juxtaposed with other algorithms of a similar nature. The selected problems encompassed DAS-CMOP [Reference Fan, Li, Cai, Li, Wei, Zhang, Deb and Goodman40], DOC [Reference Liu, Wang and Tang41], DTLZ [Reference Deb, Thiele, Laumanns, Zitzler, Abraham, Jain and Goldberg42], LIR-CMOP [Reference Fan, Li, Cai, Huang, Fang, You, Mo, Wei and Goodman43], ZXH [Reference Zhou, Xiang and He44], and FCP [Reference Yuan, Liu, Ong and He28]. Tables IV and V present the IGDp and HV metrics for these six problems, incorporating the results from the proposed IADEA algorithm. In the six constrained multi-objective optimization problems examined, the HV indicators of the proposed IADEA consistently surpass those of other algorithms. Conversely, the IGDp indicators for IADEA are consistently lower than those of its counterparts. These findings suggest that the proposed IADEA exhibits superior optimization capabilities relative to alternative algorithms within these specific problem sets.
In Figure 3(a) and (b), both TSTI and NSGAIII exhibit significant instability during the initial iterations when compared to other algorithms. In contrast to NSGAIII, TSTI is capable of converging to a stable region after the iteration. However, NSGAIII has yet to achieve this level of stability. The final convergence results indicate that the IADEA algorithm outperforms all five other algorithms. In terms of convergence speed, the IADEA algorithm is initially slower than NSGAII. This is due to the fact that in the early stages of iteration, the IADEA algorithm must guide the population toward a promising region for exploration. As the number of iterations increases, the algorithm transitions from a global search to a local search, thereby accelerating the speed of convergence. Consequently, the IADEA algorithm demonstrates superior overall convergence speed.
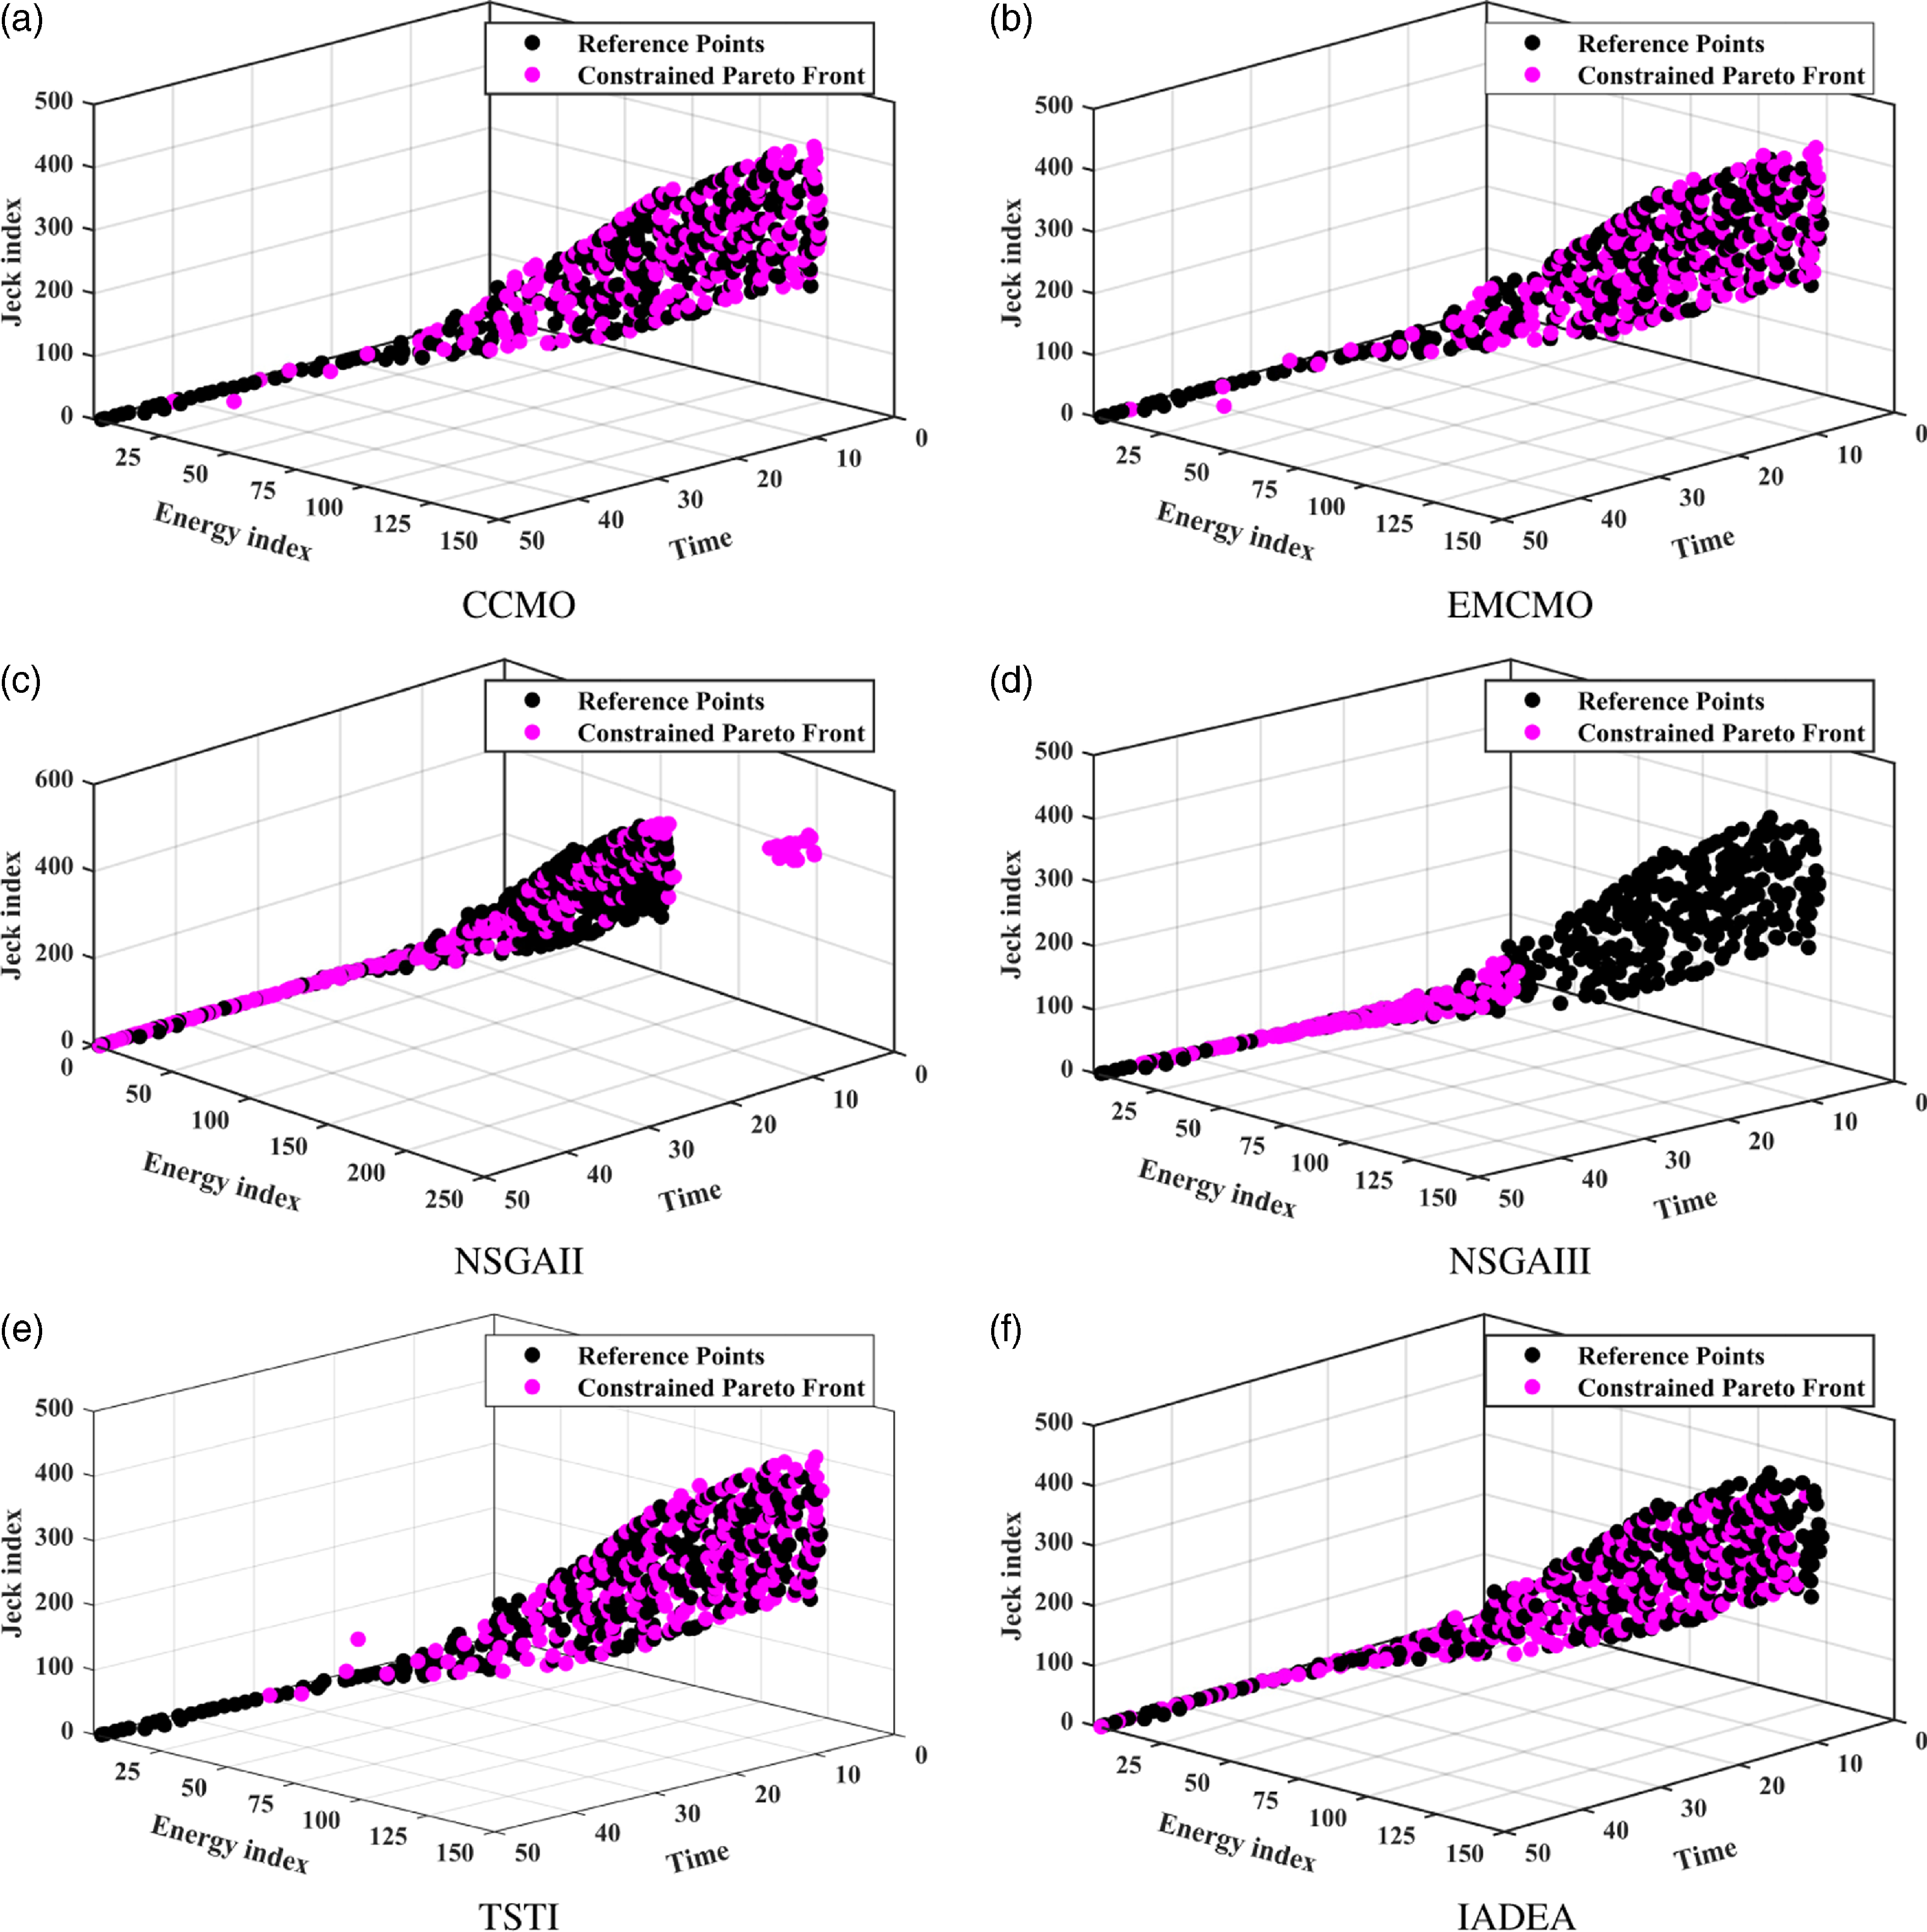
Figure 4 presents the distribution of Pareto optimal solutions within the objective space derived from the six multi-objective optimization algorithms. As illustrated in Figure 4, CCMO, EMCMO, and TSTI, effectively direct the population toward local optimization within regions characterized by minimal time bias and significant energy consumption and jerk. However, these algorithms yield a limited and unevenly distributed number of solutions in regions with large time metrics. Within the region where time metrics fall between 5 and 15 s, NSGAII yields fewer solutions than the proposed IADEA. Furthermore, its distribution lacks uniformity and exhibits a proclivity toward local optima, while NSGAIII exhibits a pronounced local stagnation. In contrast, the proposed IADEA demonstrates superior capability in guiding the population to explore within the target space, thereby yielding Pareto solutions characterized by a more balanced distribution and enhanced diversity.
Constrained Pareto solutions in objective space of individual optimization algorithms.

4.3. Results of trajectory planning and analysis
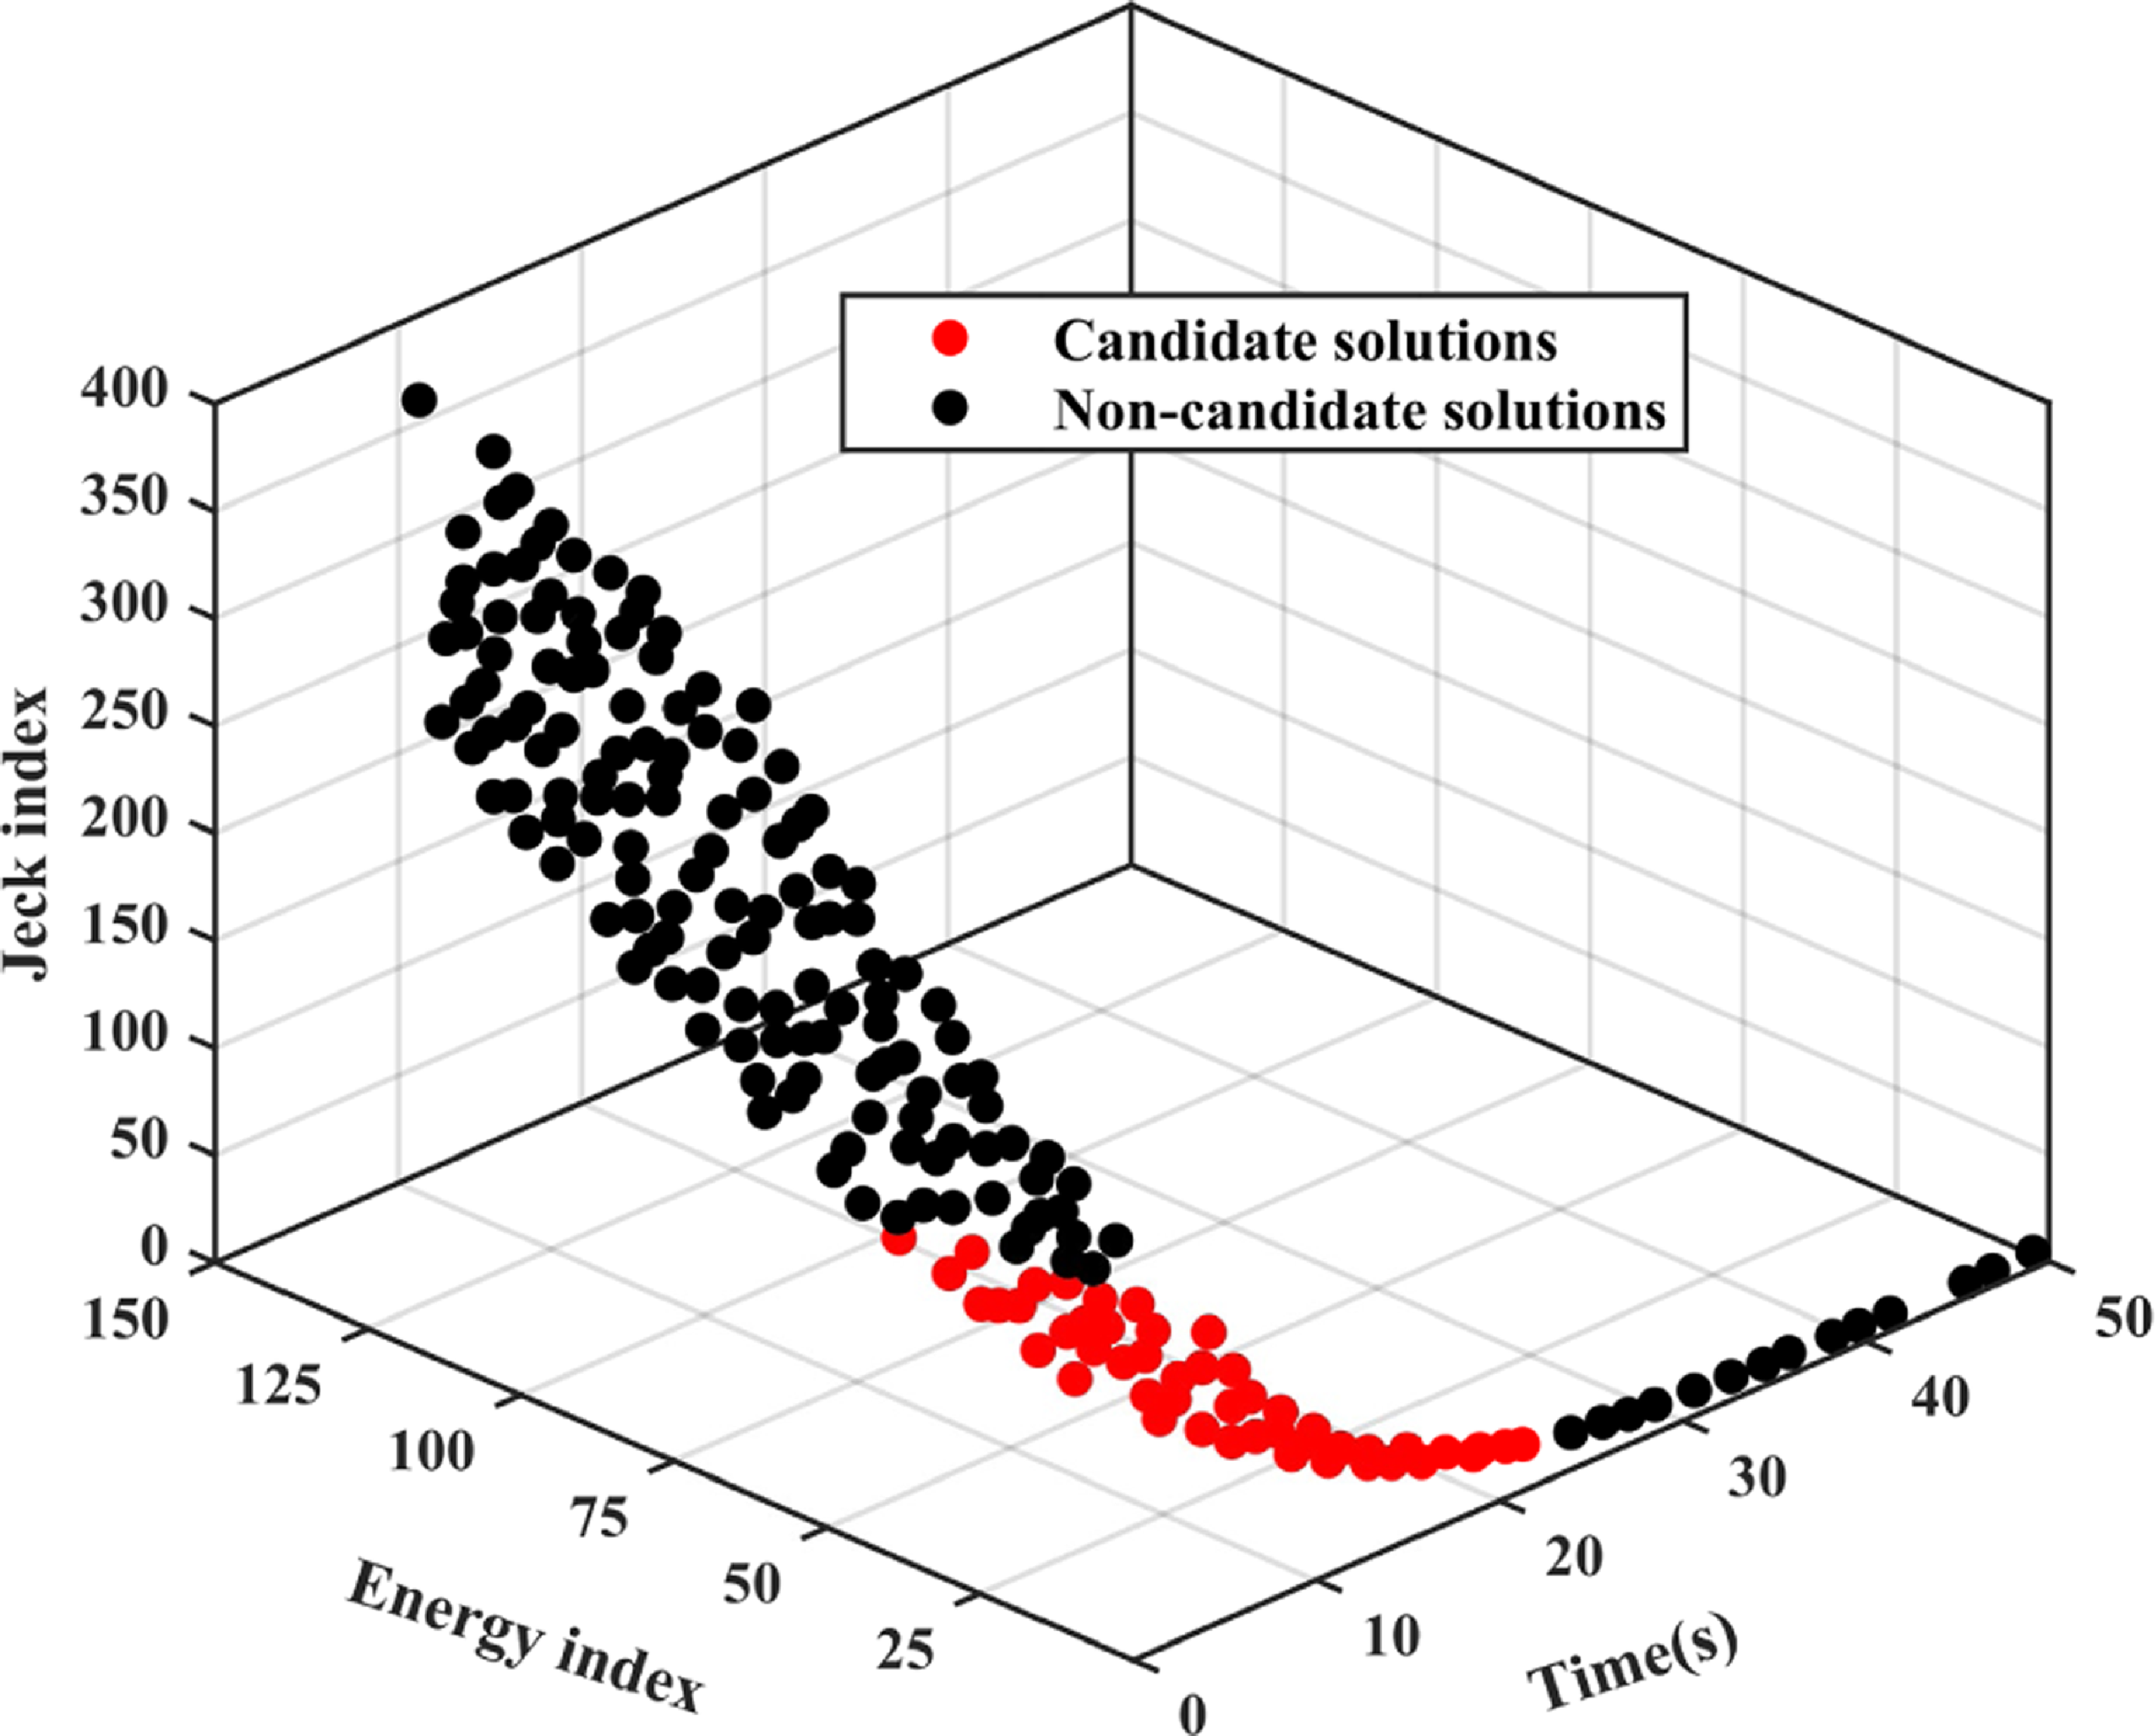
In this section, the complete trajectory planning process is discussed. Initially, the joint space trajectory is established by interpolating the via-points in Table II using the seventh-degree B-spline curve. Subsequently, this trajectory is optimized through the application of the proposed multi-objective optimization algorithm. In this process, the time interval between each pair of path points serves as the decision variable. The optimized results are depicted in Figure 5.
Solutions with relatively superior overall performance.

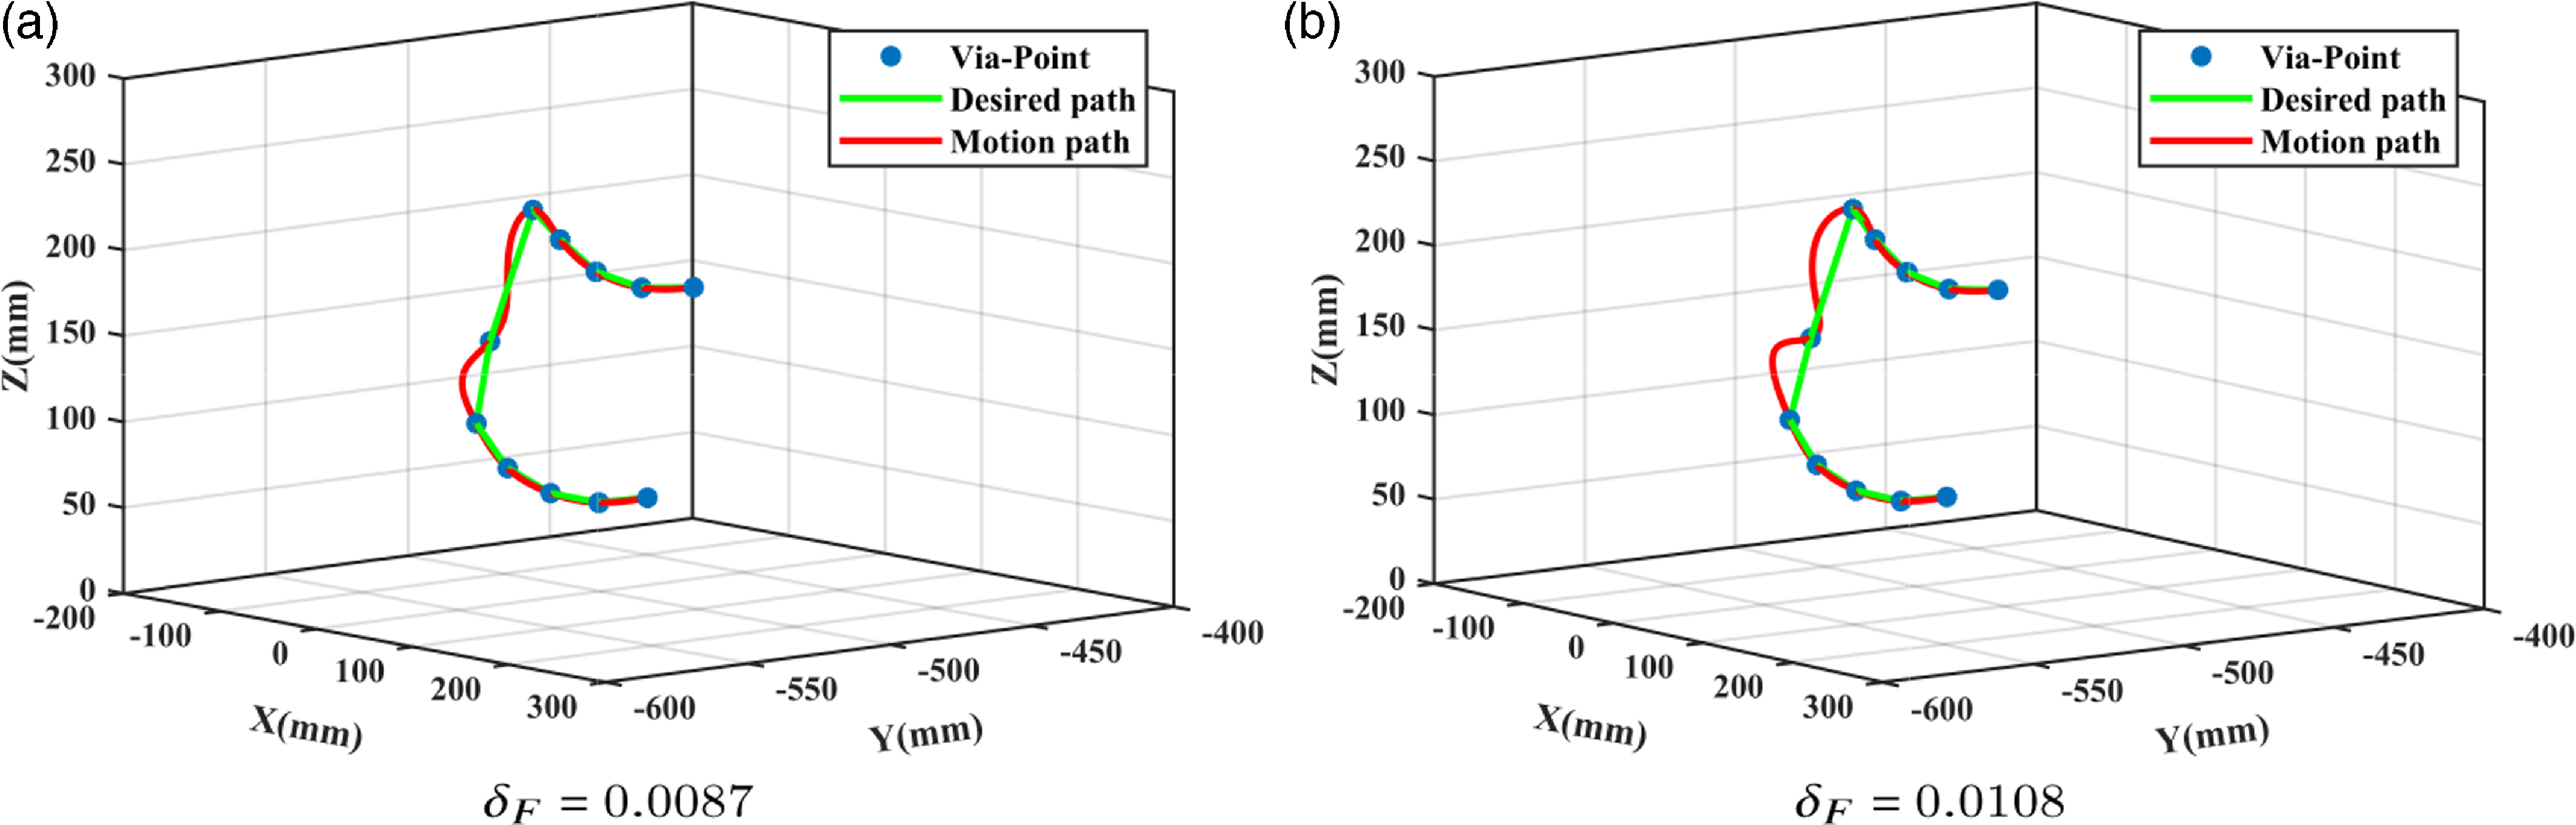
The red section in Figure 5 denotes the candidate region within the Pareto solutions, a collection of solutions exhibiting superior performance. By computing the Fréchet distance for each trajectory associated with a solution in this region and subsequently ranking them, the solution linked to the smallest Fréchet distance can be pinpointed. The minimum Fréchet distance,
 $\delta _F$
, of the optimal trajectory derived from this solution is 0.0087. The maximum Fréchet distance among the trajectories procured in the candidate region stands at
 $\delta _F$
= 0.0108. A visualization of these two trajectories in Cartesian space is depicted in Figure 6. In this figure, blue points signify the robot manipulator’s passing points in Cartesian space, green curves illustrate the anticipated movement path of the robot manipulator’s end-effector in Cartesian space, and red curves represent the optimized motion trajectory of the same end-effector in Cartesian space. A comparison between Figure 6(a) and (b) reveals that the optimized trajectory in Figure 6(a) aligns more closely with the expected motion path, whereas the trajectory in Figure 6(b) deviates significantly from it.
The paths with different Fréchet distances in Cartesian space.

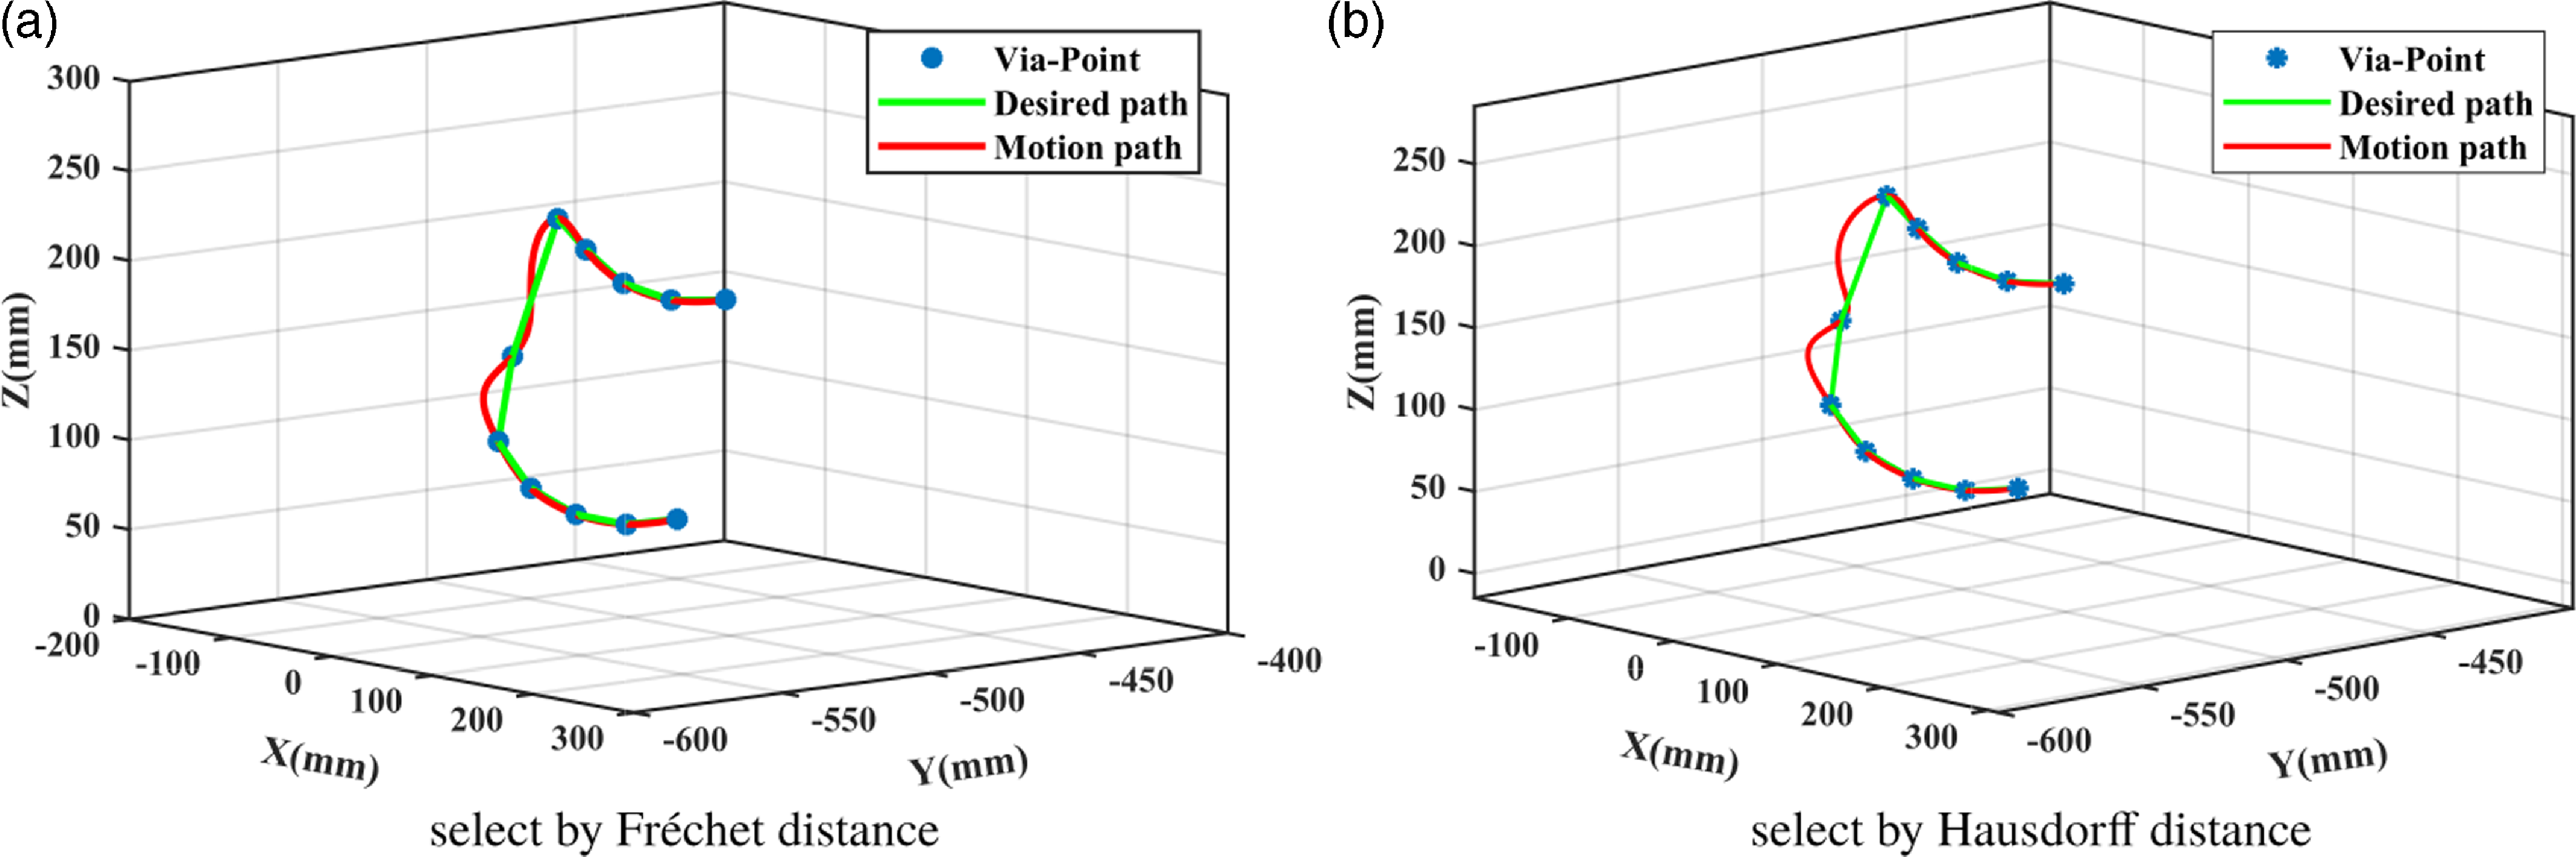
To validate the superiority of the Fréchet distance in measuring path similarity, this study juxtaposes the trajectory derived from the Fréchet distance with that obtained via the Hausdorff distance [Reference Alt and Scharf45], which is usually used to measure the similarity of curves. Figure 7 shows the comparison between the Cartesian space paths selected by two different distances and the desired path. It is evident that the path derived from the Fréchet distance more closely aligns with the desired trajectory than the Hausdorff distance.
The trajectories selected by different distances in Cartesian space.

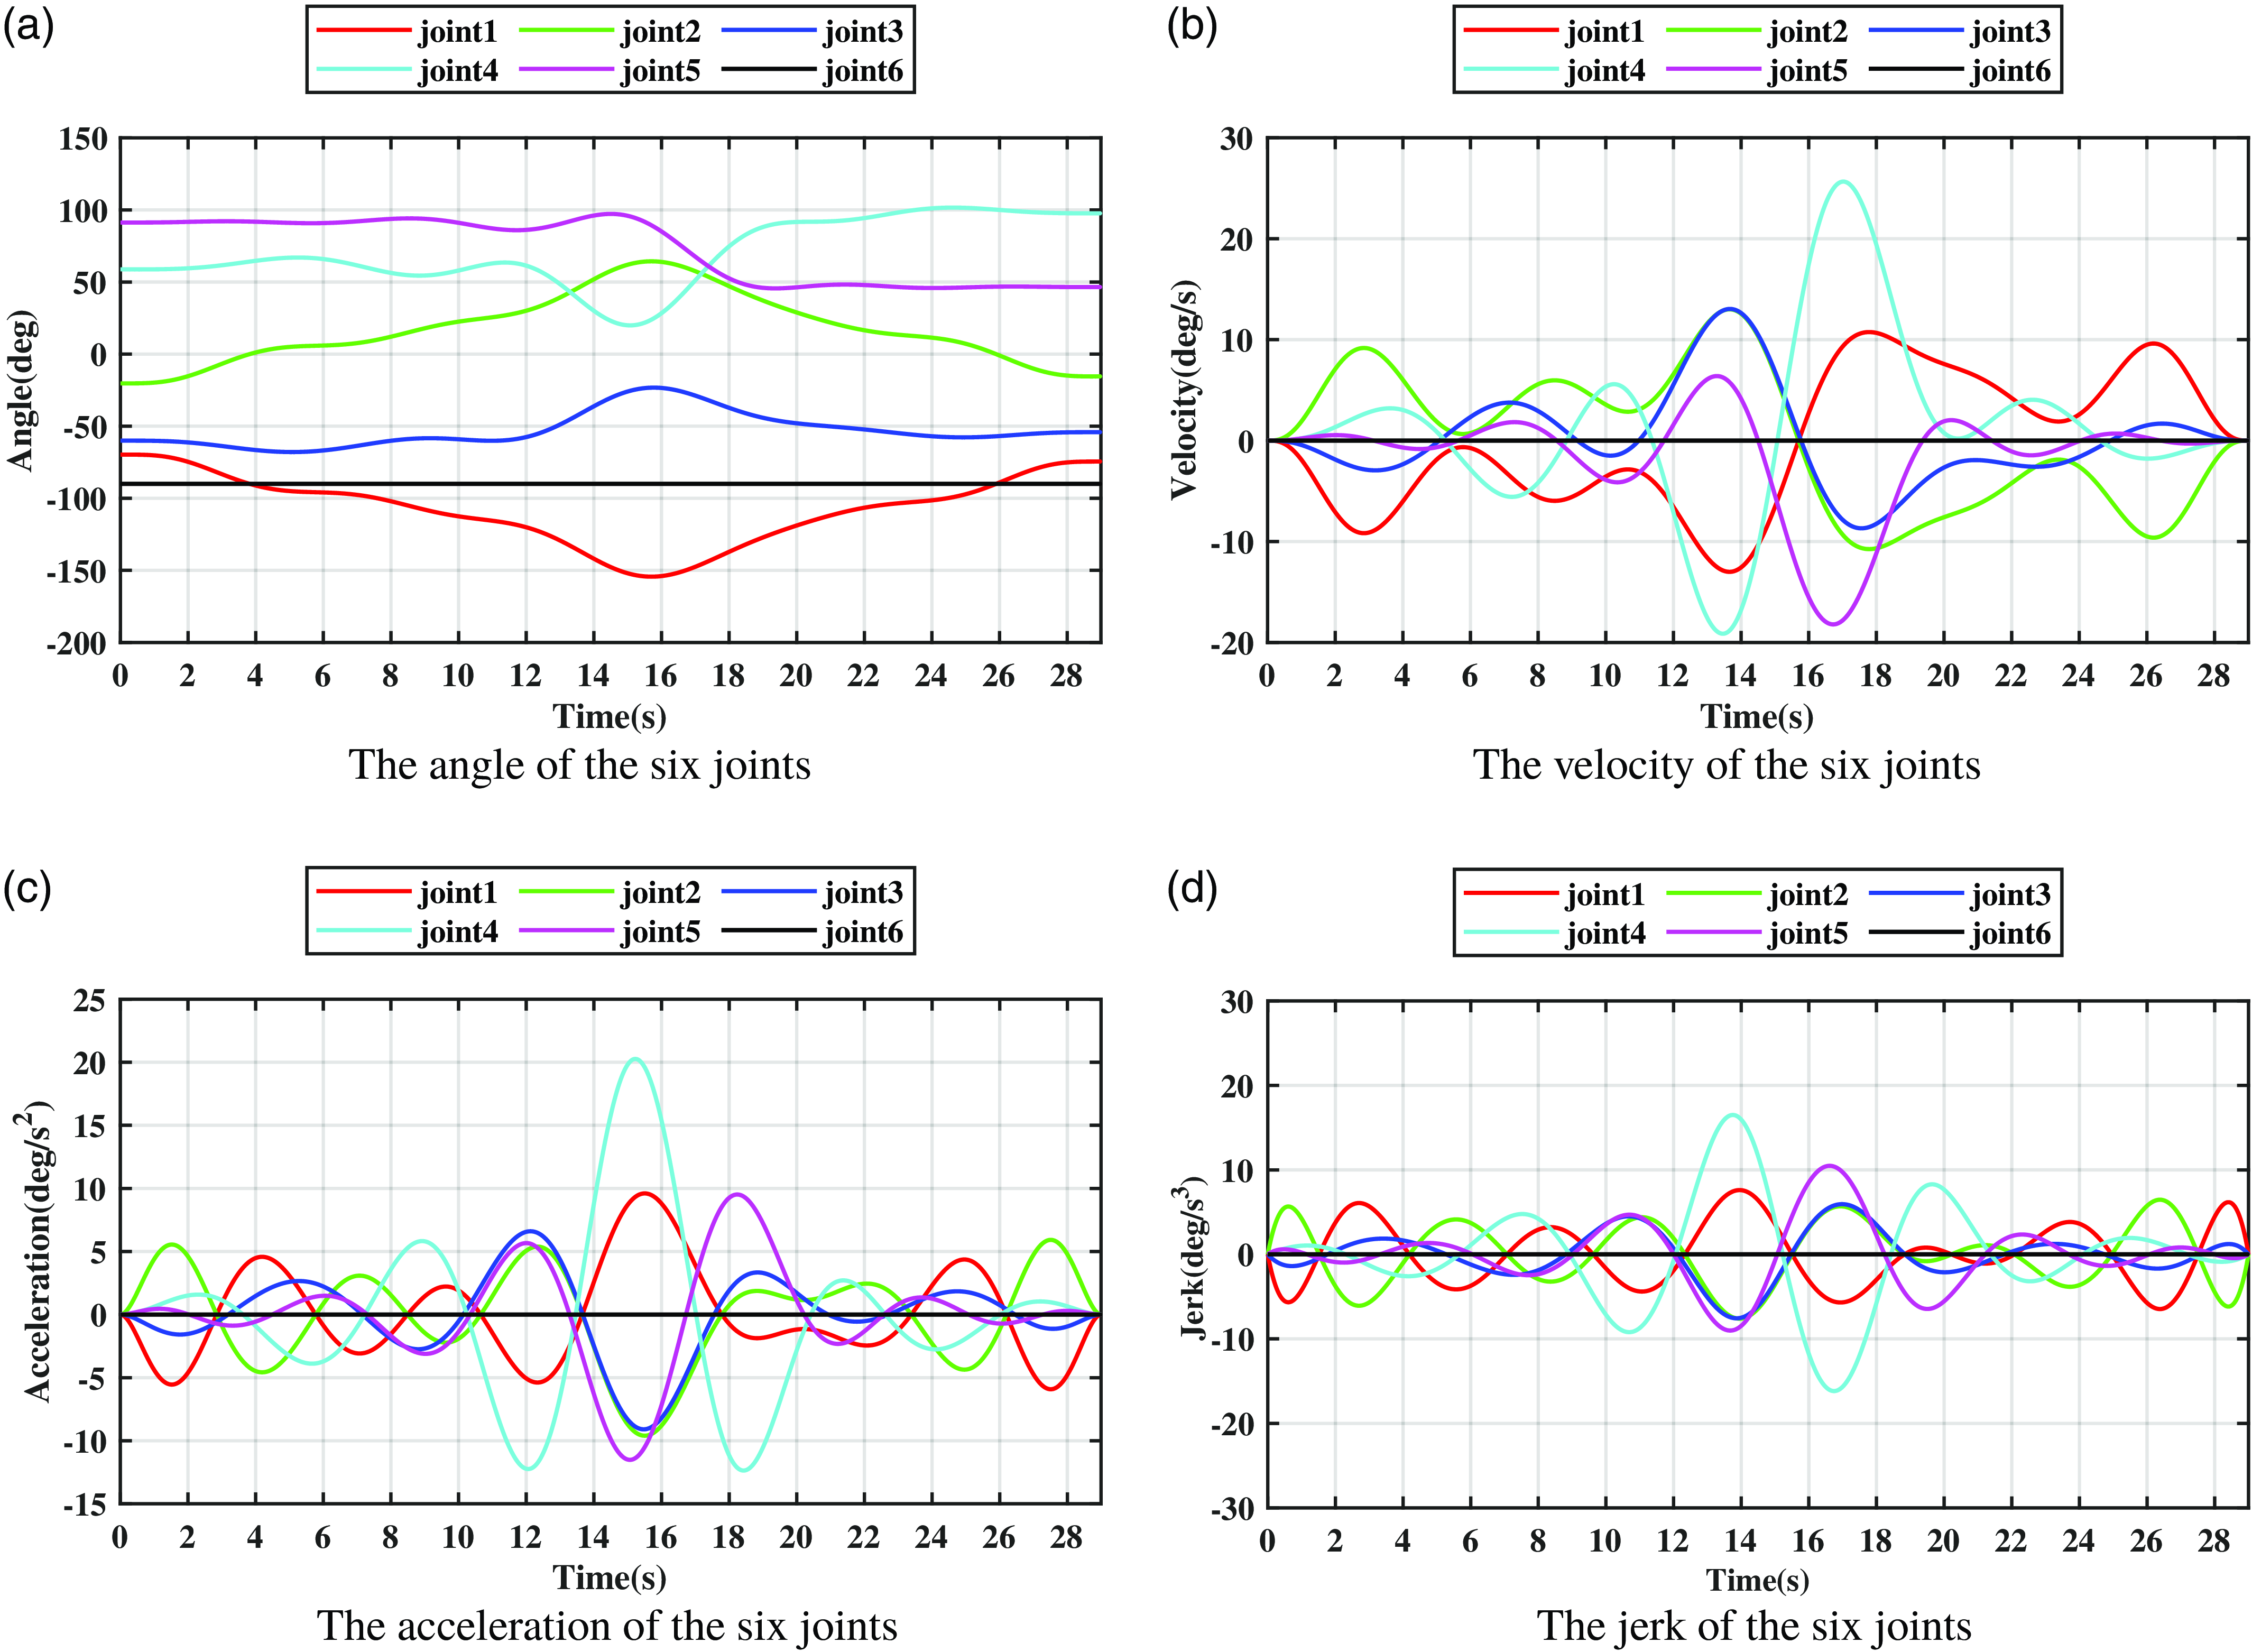
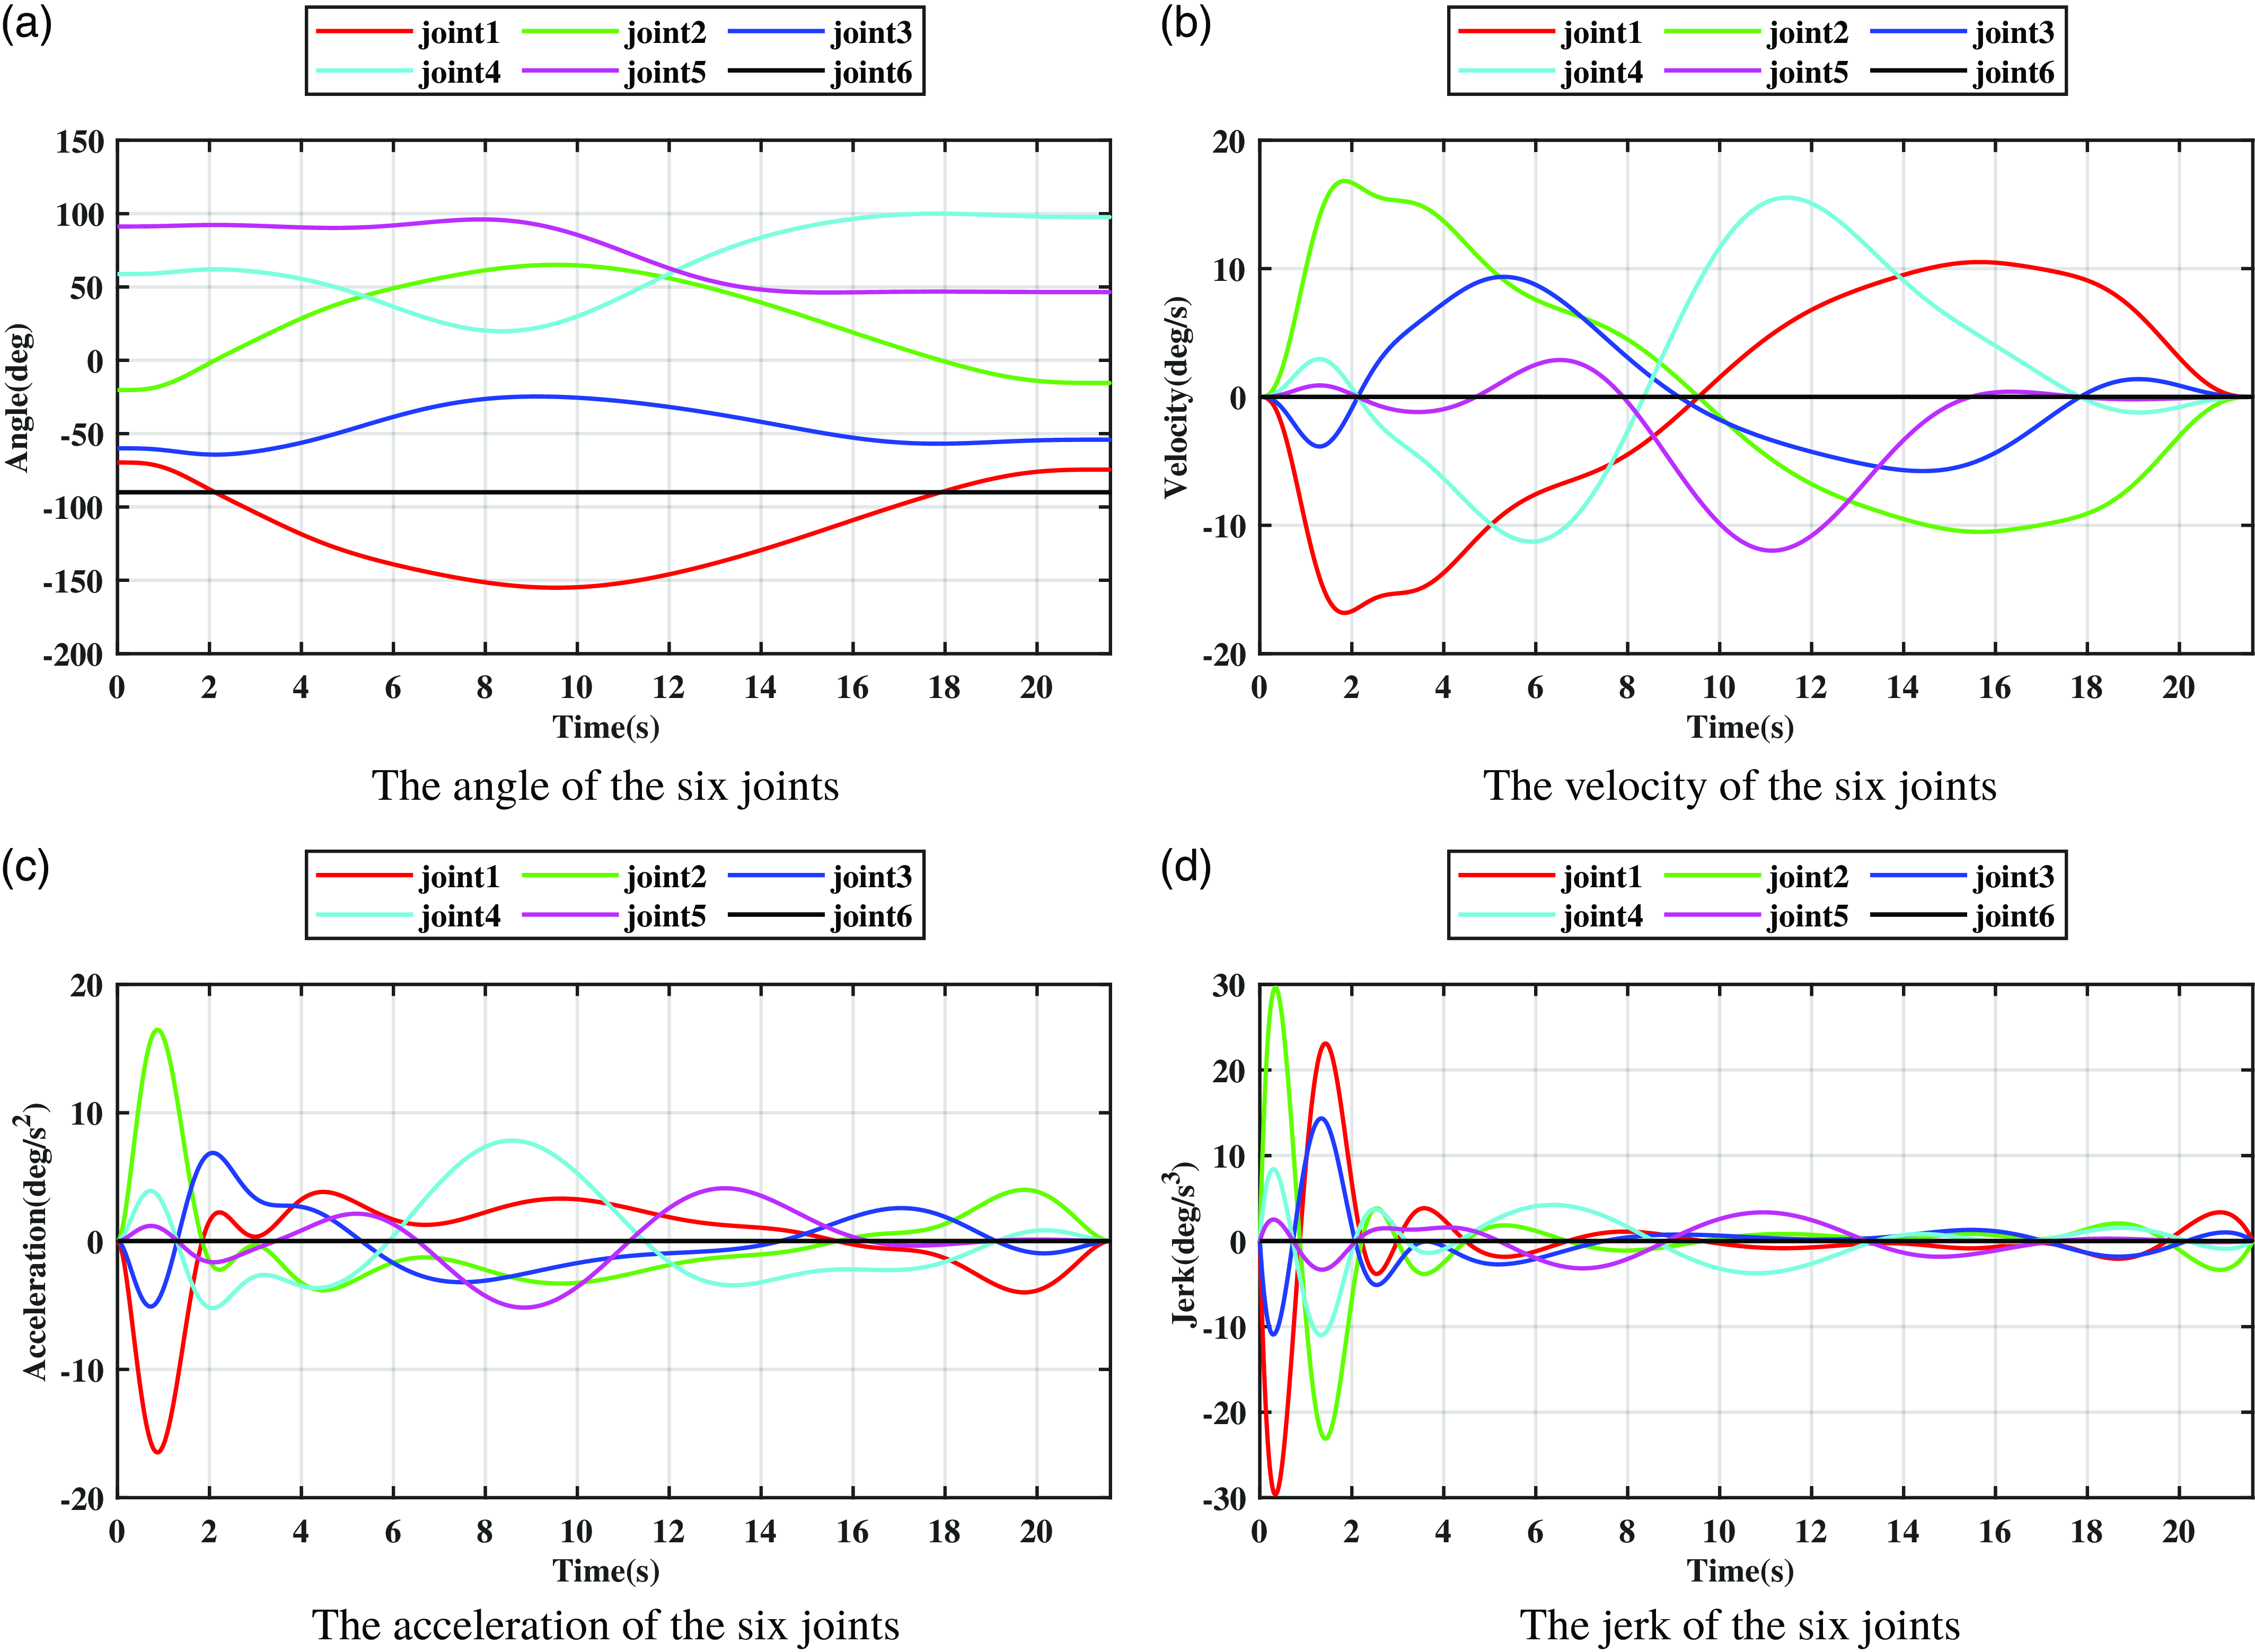
Figures 8 and 9 illustrate the joint space trajectories produced by the B-spline interpolation method alone and those generated by the proposed trajectory planning method, respectively. Upon comparing these two trajectories, it becomes evident that the trajectory produced by the B-spline interpolation method exhibits larger amplitude and higher frequency oscillations in velocity, acceleration, and jerk. This is highly detrimental to the movement of the robotic arm, causing frequent joint jitter during operation. The trajectory generated by the proposed trajectory planning method is smoother and the continuity of the trajectory is better.
The joint space trajectory obtained using only B-spline interpolation.

The joint space trajectory derived from the proposed trajectory planning method were utilized.

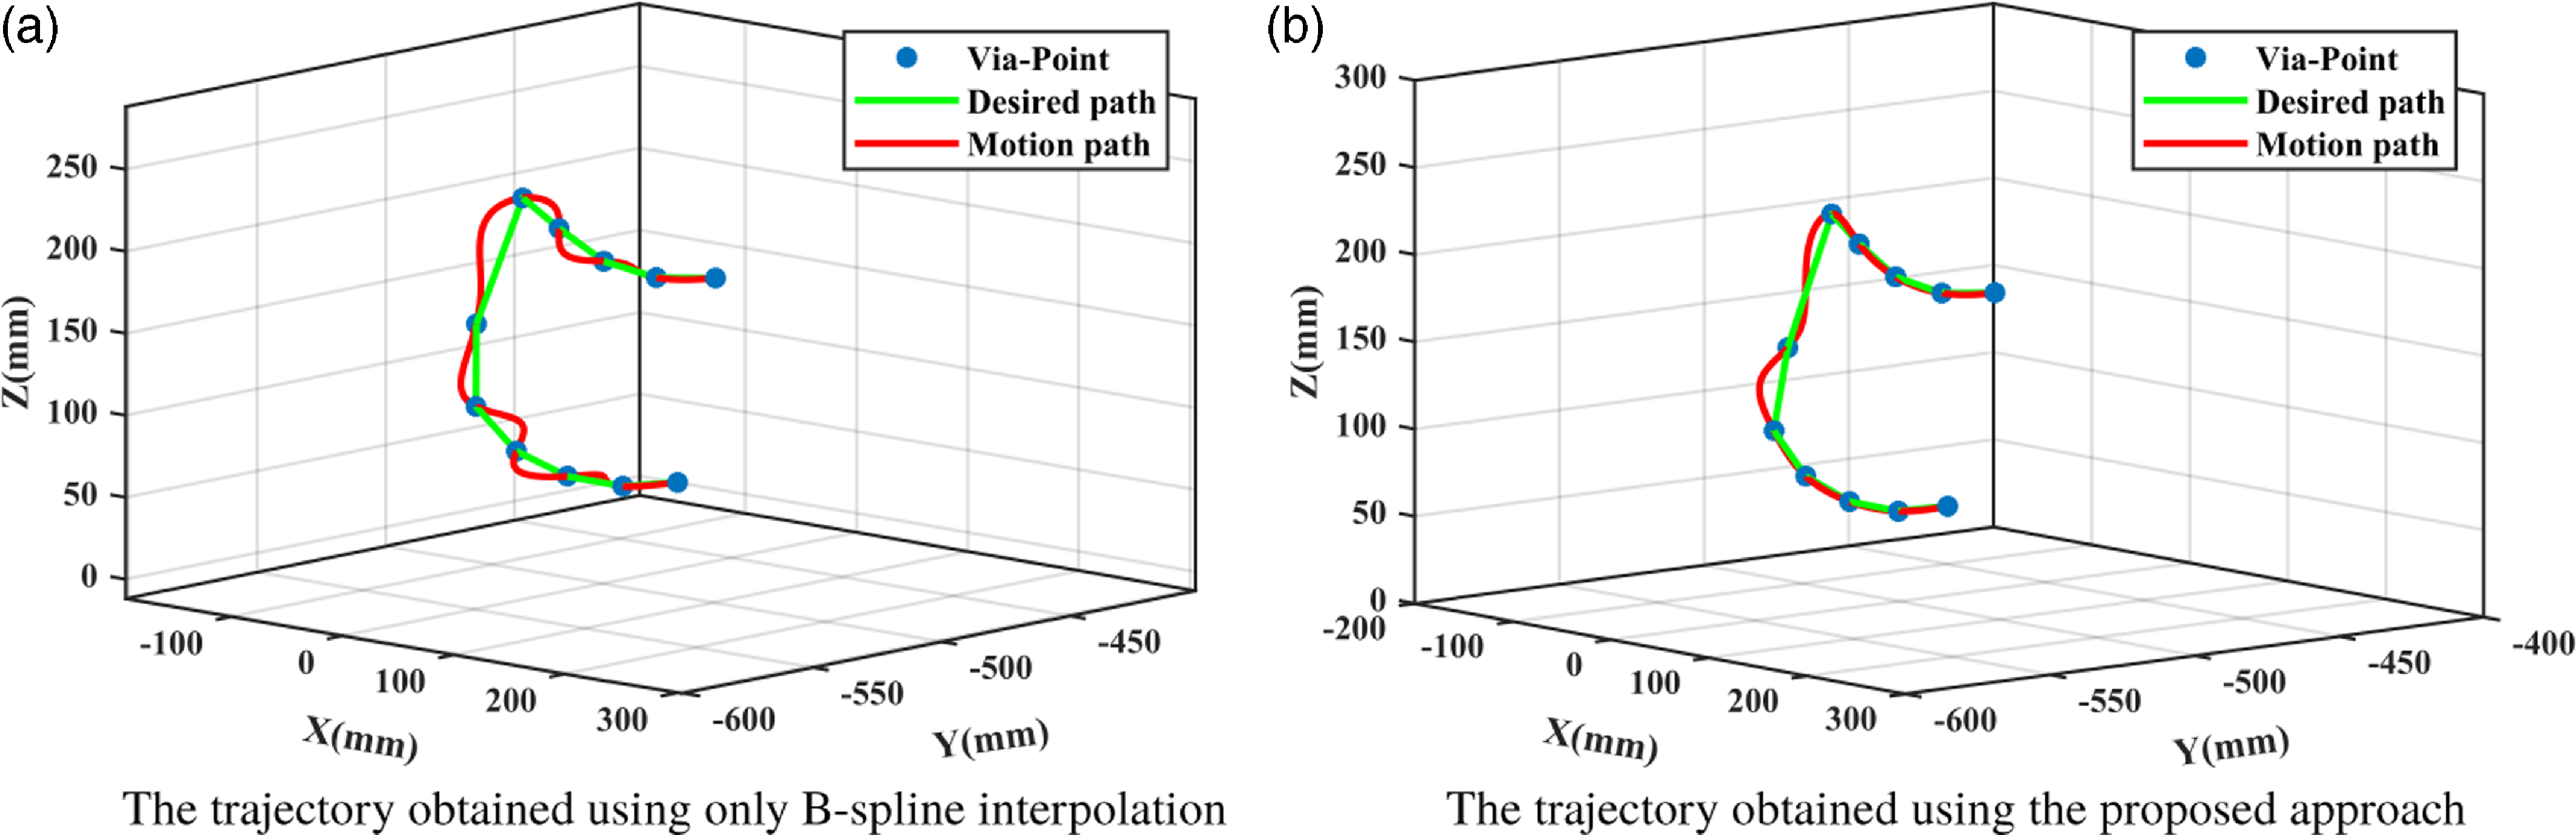
Figure 10 shows the Cartesian space trajectory produced by the B-spline interpolation method alone and those generated by the proposed trajectory planning method, respectively. When only B-spline interpolation is used, the Cartesian space trajectory’s shape is suboptimal. However, following the application of the proposed trajectory planning method, the resulting Cartesian space trajectory more closely aligns with the desired path shape. This enhancement ensures that the robot arm’s endpoint moves along the intended path in Cartesian space.
Cartesian trajectories generated using different methods.

Table VI presents the performance metrics for unoptimized trajectory and optimized trajectory, respectively. The trajectory of the robotic manipulator, without the application of trajectory planning, yields time, energy consumption, and jerk indicators of 29.0 s, 10.9986, and 12.3797 deg/
 ${\rm s}^{3}$
respectively. Conversely, when trajectory planning is employed, these indicators are reduced to 21.5974 s for time, 9.0663 for energy consumption, and a notably lower 4.1616 deg/
 ${\rm s}^{3}$
for jerk. Compared to a trajectory that lacks trajectory planning, the trajectory derived from trajectory planning reduces time, energy consumption, and impact by 25.53%, 17.56%, and 66.38%, respectively.
Comparison between unoptimized trajectory and optimized trajectory.

4.4. Evaluation of interpolation performance
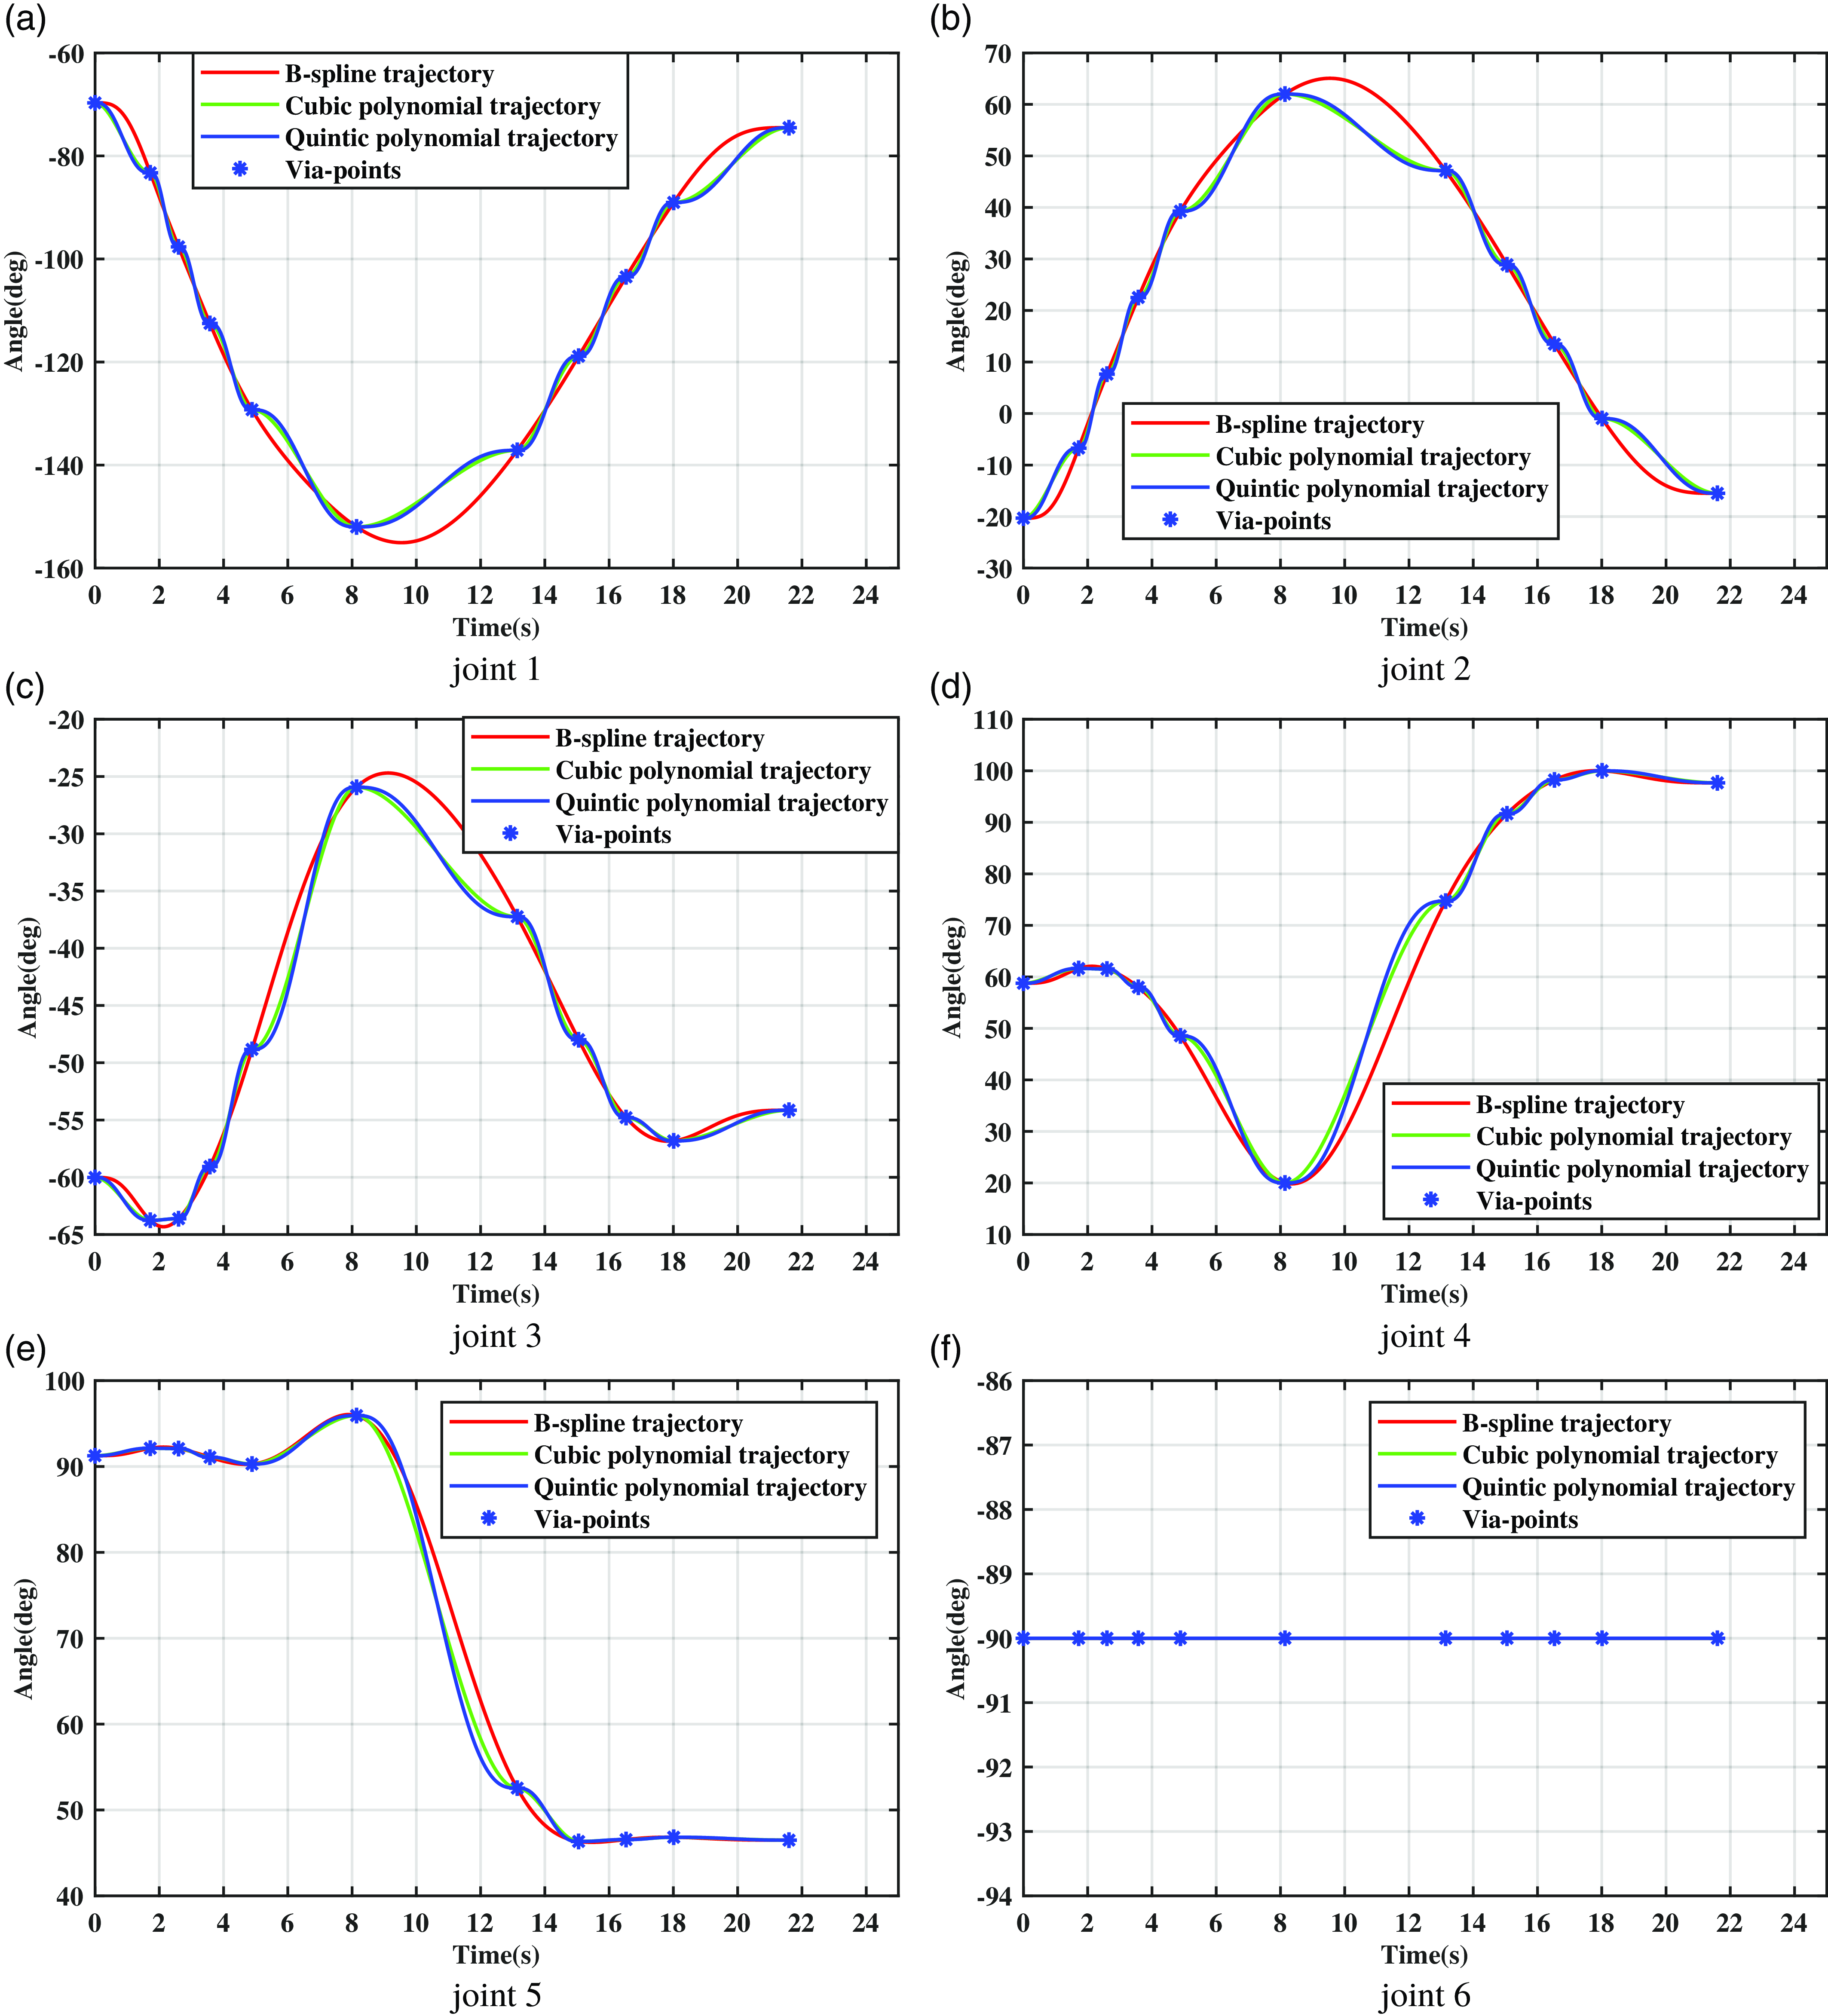
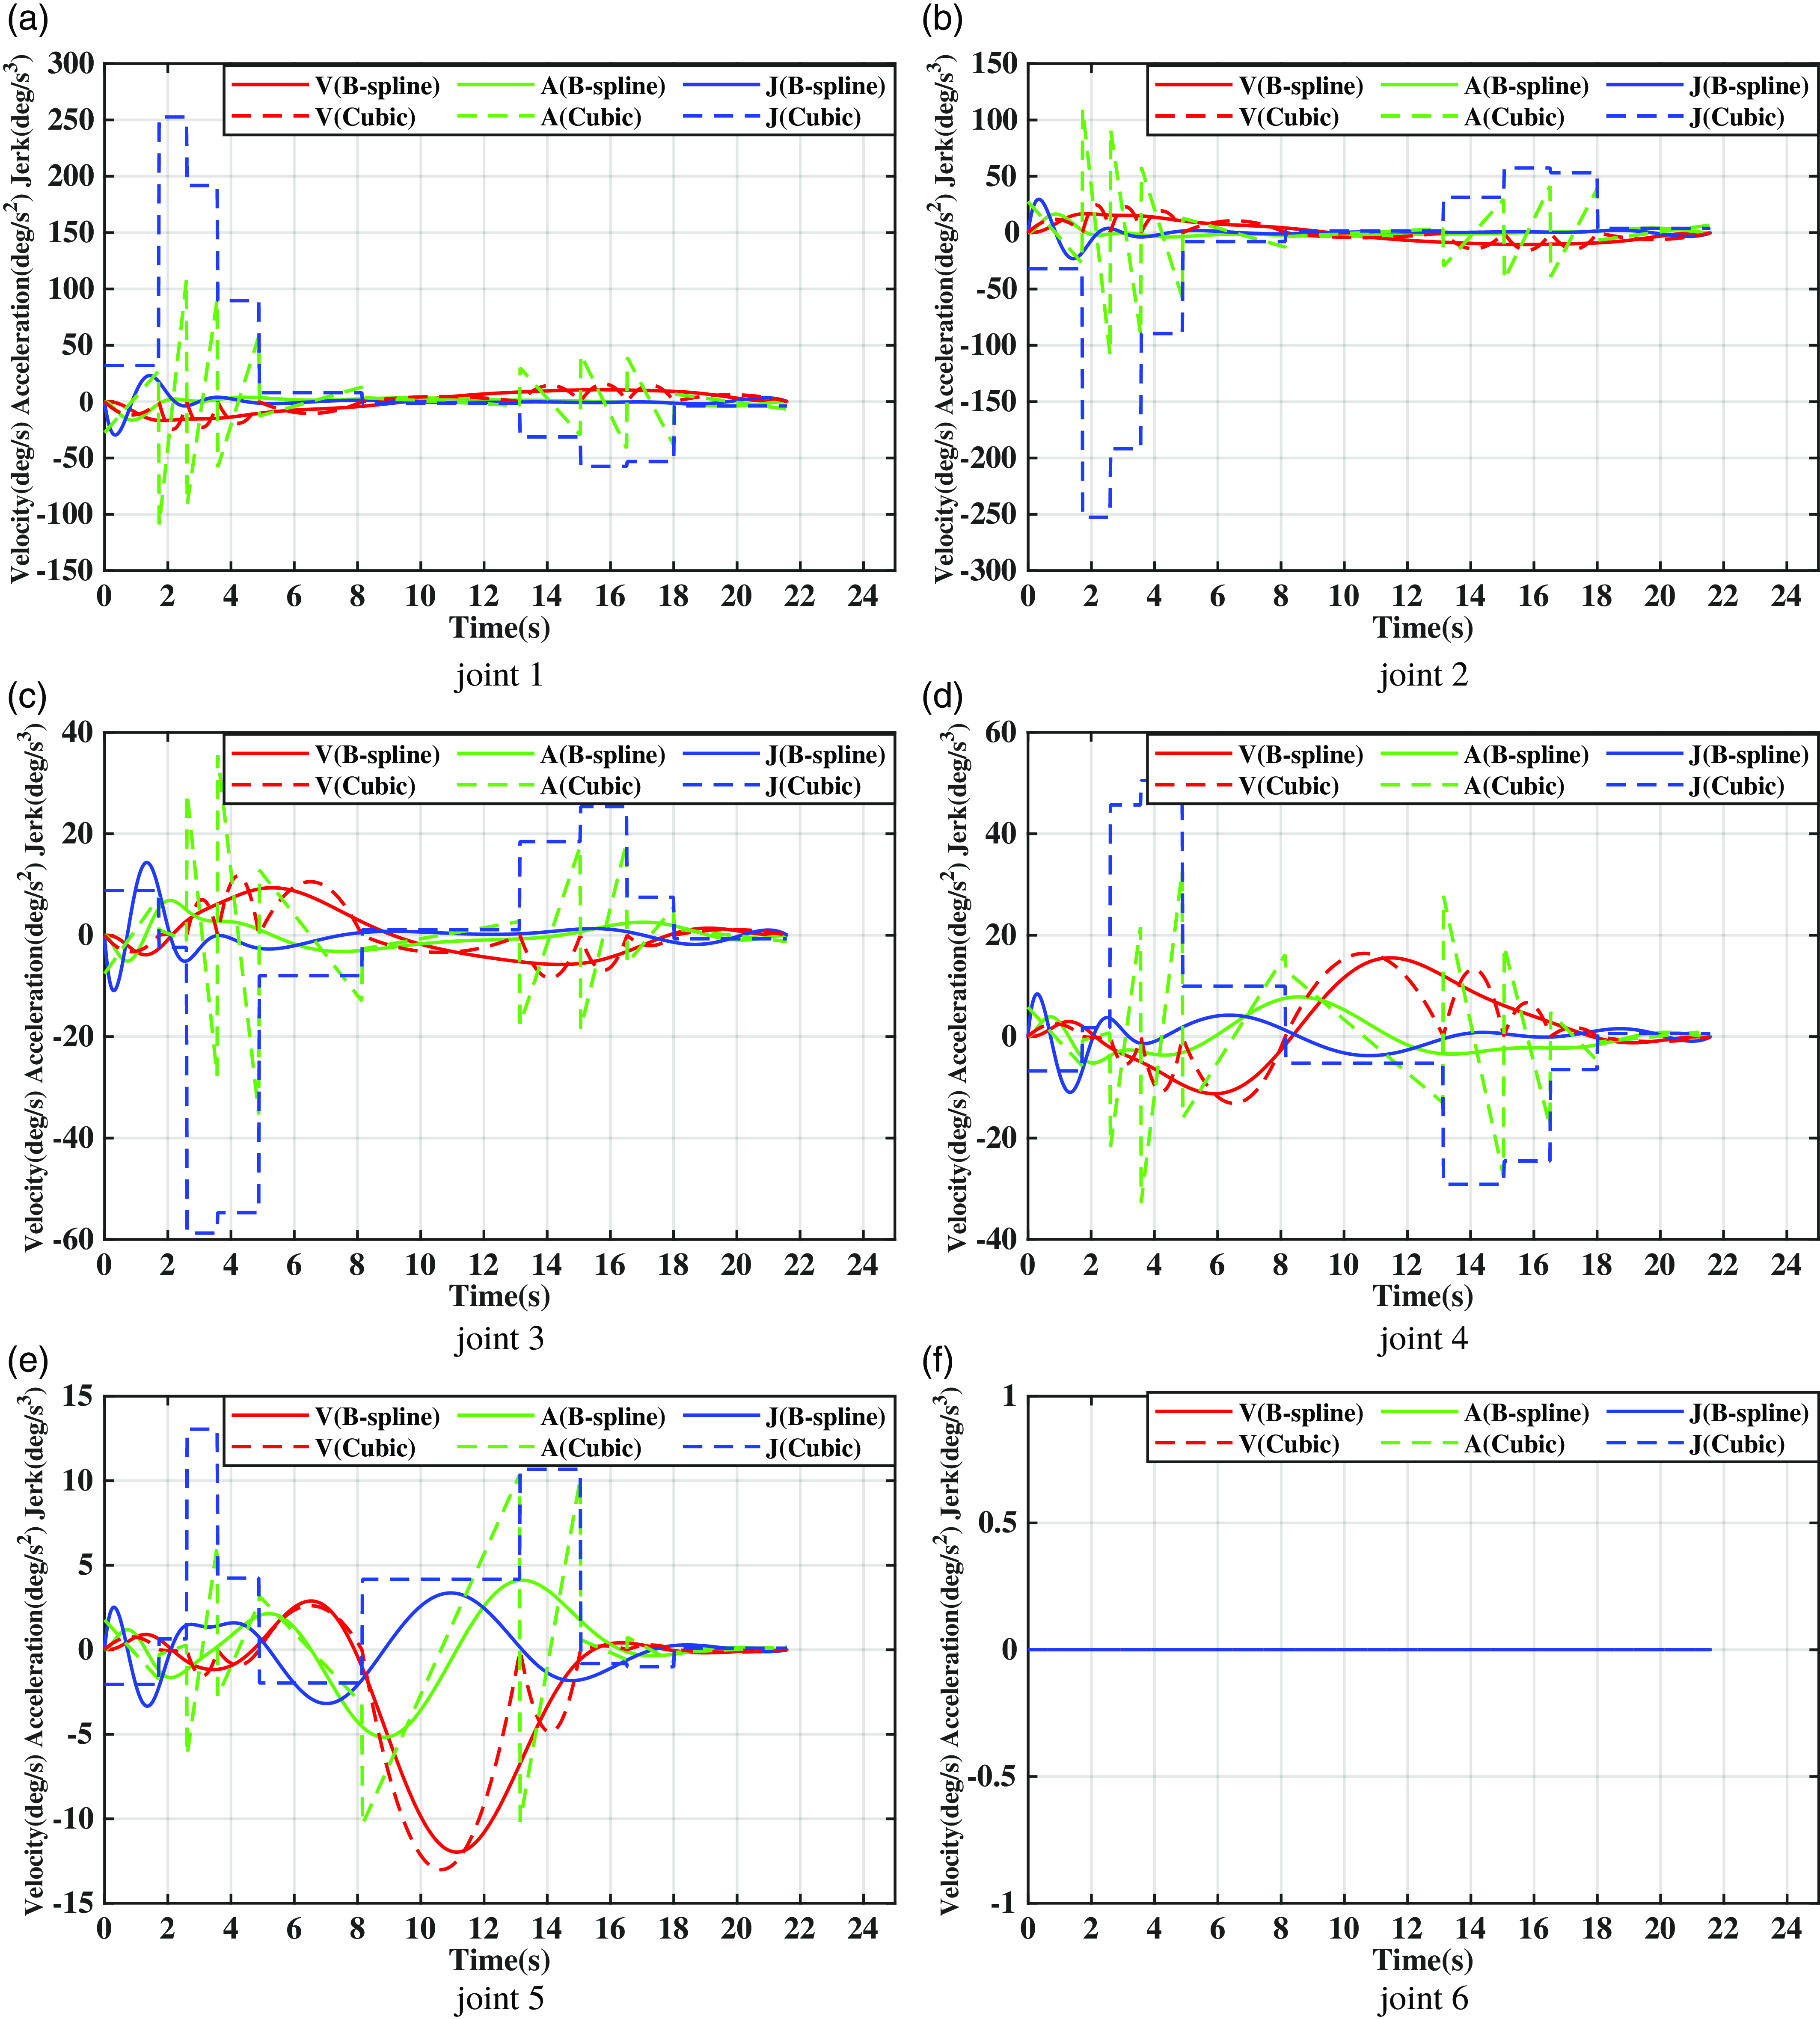
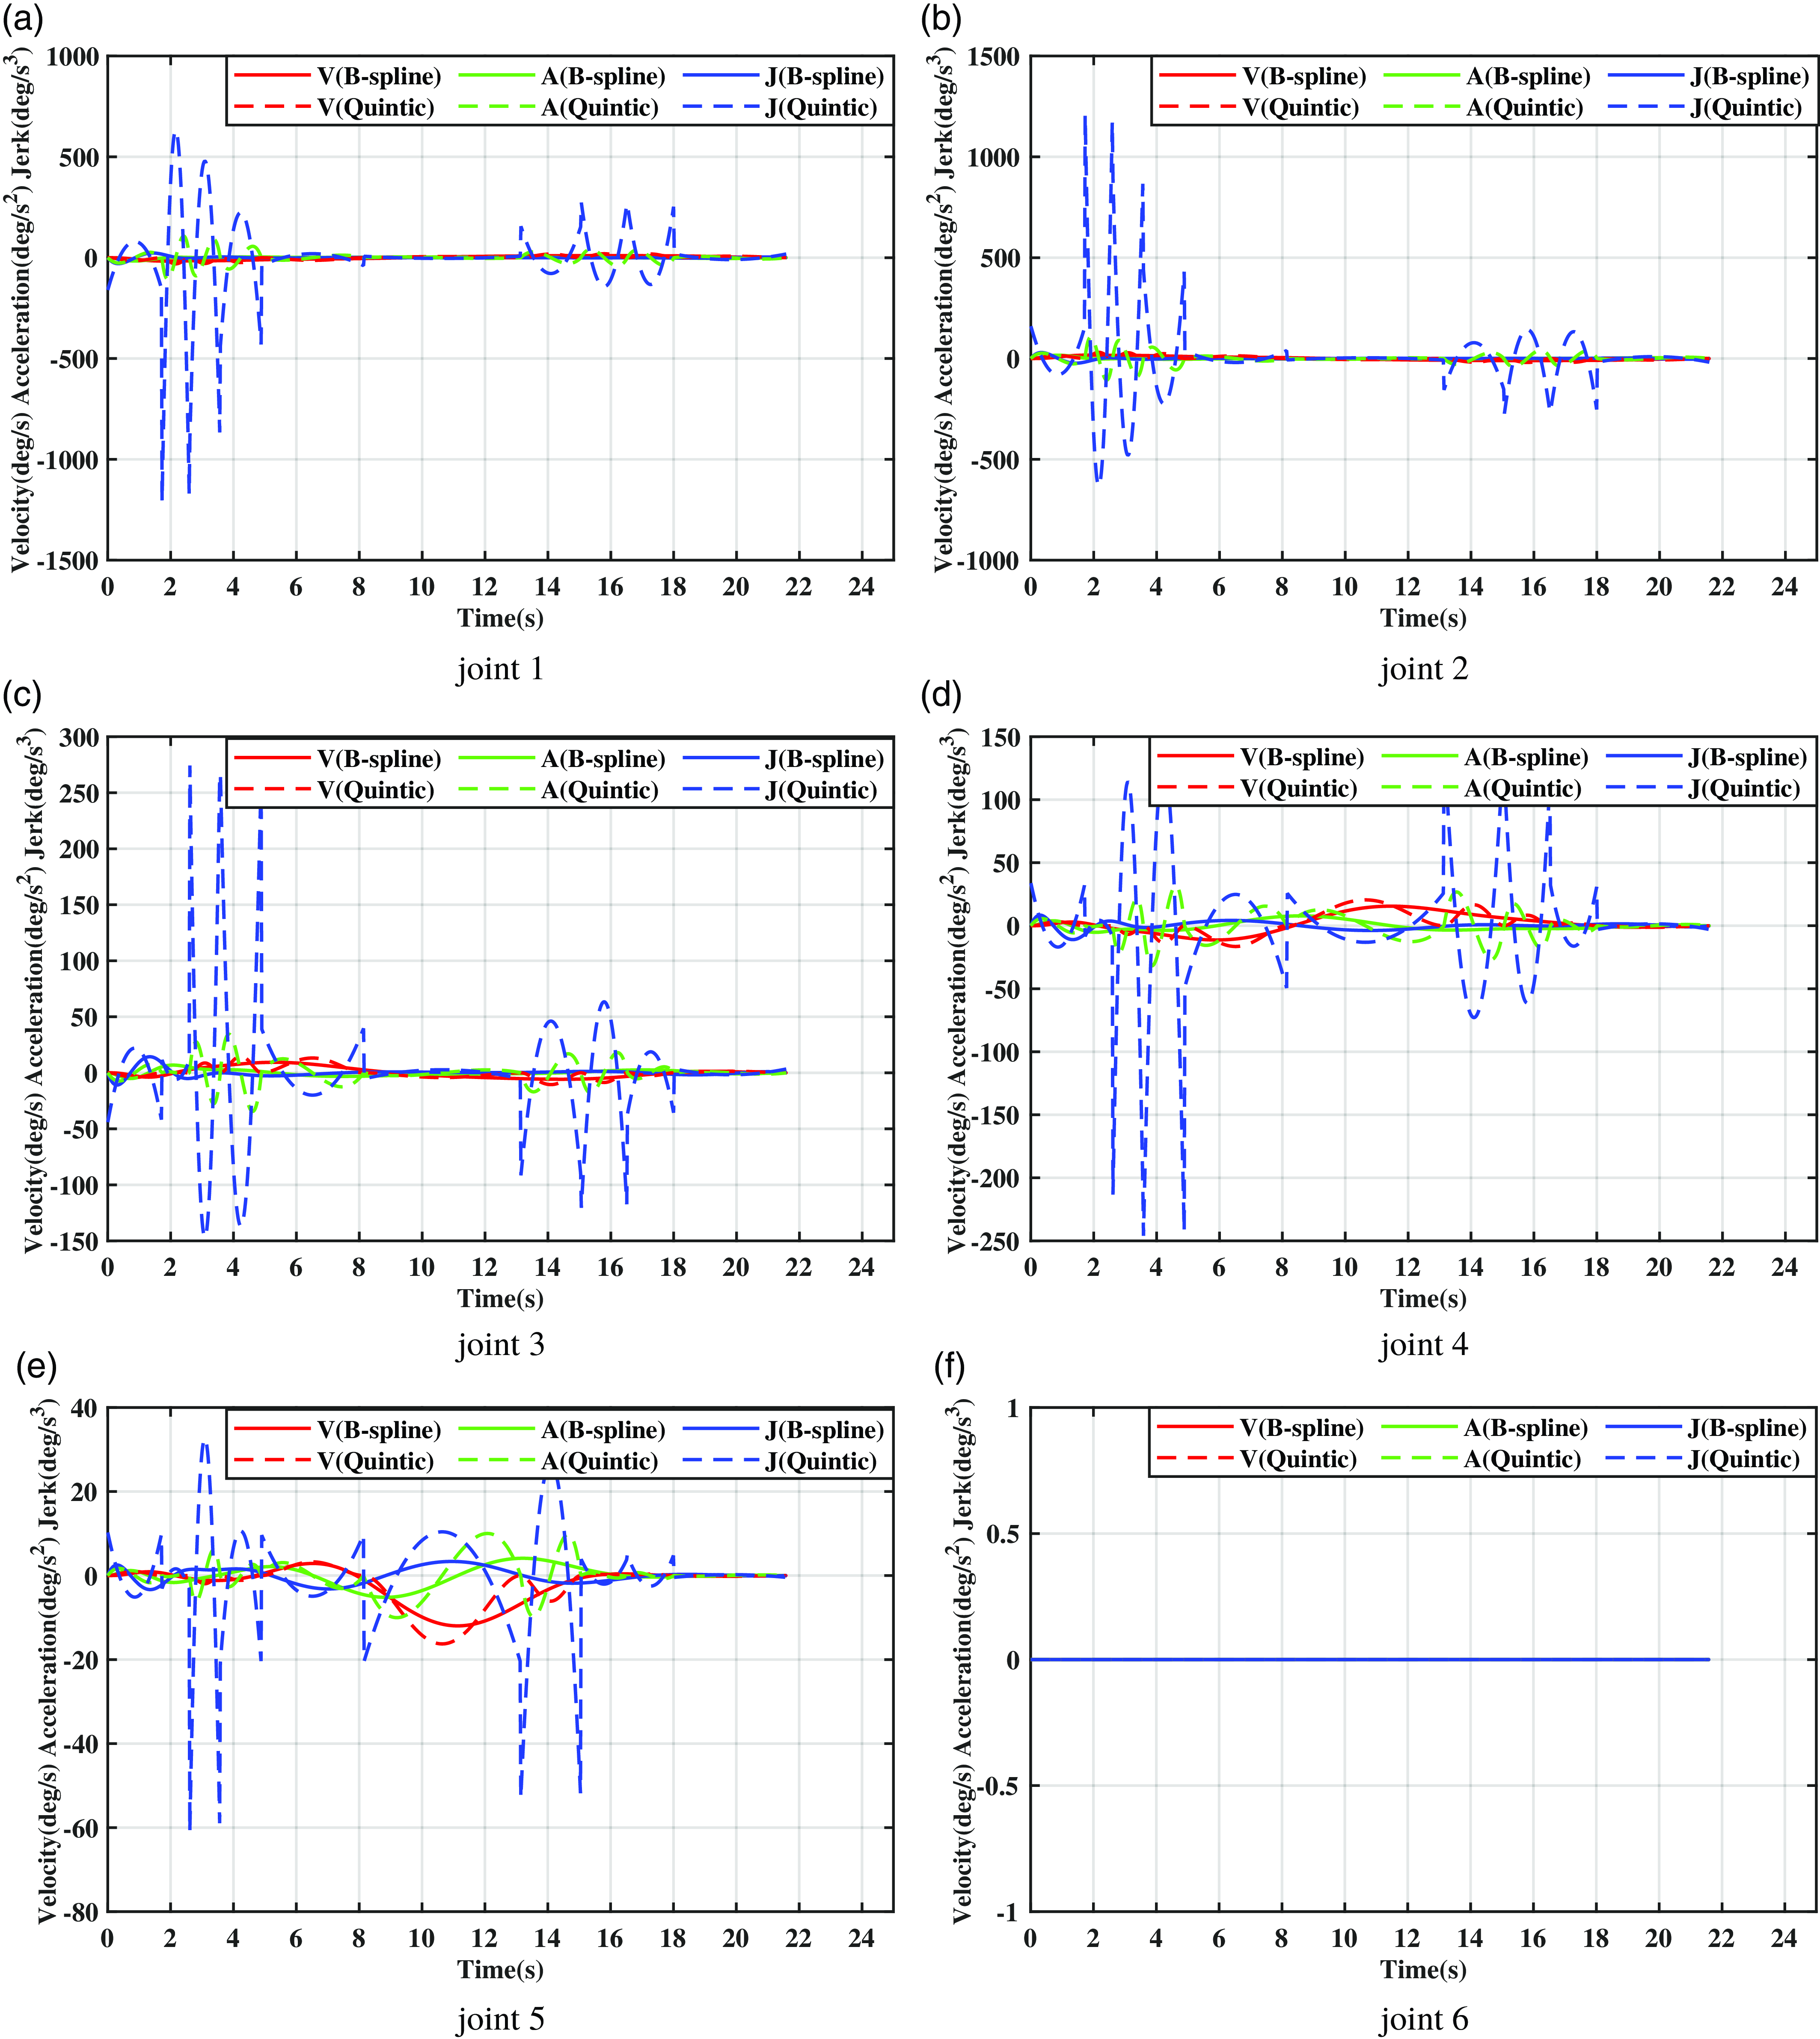
To assess the interpolation efficacy of the curves, we compare B-spline curves with the prevalent cubic polynomial and quintic polynomial curves. The time required to generate these trajectories is determined using our proposed optimization algorithm. Figures 11, 12, and 13 show a comparison of the three curves for joint angle, joint velocity, joint acceleration, and jerk during the working. The three figures illustrate that the trajectories derived from cubic polynomial interpolation can only ensure continuity in joint angle and joint velocity, while their joint acceleration and jerk are discontinuous. Conversely, those obtained from quintic polynomial interpolation can guarantee continuity in joint angle, joint velocity, and joint acceleration, but not in jerk. When compared to these two types of curve interpolation, the trajectories derived from seventh-degree B-spline interpolation can simultaneously satisfy the continuity of joint angle, joint velocity, joint acceleration, and jerk. Furthermore, they allow for the setting of initial velocity, acceleration, and jerk values as per requirements. Additionally, the seventh-degree B-spline curve trajectory exhibits smaller acceleration and jerk peaks compared to the other two types of curves, thereby generating a more stable and smoother trajectory.
Joint angles generated by different curves.

Joint velocities, joint accelerations, and jerks generated using cubic polynomials and B-spline interpolation, respectively.

Joint velocities, joint accelerations, and jerks were generated using quintic polynomials and B-spline interpolation, respectively.

5. Conclusions
This study introduces an indicator-based adaptive differential evolution algorithm, which is coupled with the seventh-degree B-spline curve interpolation for multi-objective trajectory planning of a robot manipulator in a space station experimental cabinet. Initially, a constrained multi-objective optimization model is developed for the manipulator’s trajectory planning, considering factors such as motion time, energy consumption, jerk, and specific constraints related to the manipulator’s movement. Subsequently, the fundamental trajectory of the manipulator’s motion was established using a seventh-degree B-spline interpolation and optimized via the proposed multi-objective optimization algorithm. This algorithm generates an initial population through enhanced Tent chaos mapping and opposition-based learning, thereby increasing the diversity and randomness of the initial population and boosting early optimization capabilities. It further refines the differential evolution algorithm using an adaptive strategy to balance global and local optimization capabilities. Additionally, it guides the algorithm to probe promising areas utilizing a constraint handling technique based on indicators, yielding completely constrained Pareto optimal solutions. Ultimately, by comparing the Fréchet distance between the anticipated trajectory in Cartesian space and the Pareto optimal solutions, the optimal trajectory that best meets the requirements in Cartesian space is identified from the Pareto optimal solutions.
Path point data obtained from the experimental cabinet robotic arm platform in the Wentian Lab Module was used to validate the effectiveness of the proposed method. To validate the efficacy of the proposed multi-objective optimization algorithm, it was tested alongside six advanced multi-objective optimization algorithms on six representative multi-objective optimization and trajectory planning problems. The performance of each algorithm was then compared across different optimization problems. The outcomes from IGDp and HV indicate that our proposed optimization method outperforms these five sophisticated multi-objective optimization algorithms in trajectory planning tasks, offering researchers optimal trade-off solutions for multi-objective trajectory planning. The efficacy of the proposed trajectory selection strategy is corroborated by juxtaposing the trajectories chosen based on two distinct distance metrics. The chosen trajectory is adept at fulfilling the motion conditions inherent in Cartesian space. The outcomes, both pre- and post-trajectory planning, demonstrate that the proposed method significantly enhances the motion performance of the robotic arm joints while adhering to the motion conditions in Cartesian space. Furthermore, this research compared the commonly employed cubic polynomial curves and quintic polynomial curves in trajectory planning against the seventh-degree B-spline curves derived from our proposed optimization algorithm. The seventh-degree B-spline curve ensures a smooth robot arm joint trajectory while maintaining lower speed, acceleration, and impact peak values. Our findings suggest that the proposed trajectory planning method is an effective strategy, adeptly balancing time, energy consumption, and impact objectives, generating superior joint space trajectories, and satisfying operational requirements in Cartesian space.
The offline trajectory planning method proposed in this paper is most valuable when the planned trajectory needs to be reused, making it particularly suitable for the repetitive disinfection work of the experiment cabinet in the space station. The future research work will focus on the development of an online trajectory planning method that can be applied to a broader range of work scenarios. Additionally, path planning will be a research focuses in the future, including the exploration of how to achieve accurate online obstacle avoidance and human–machine collaboration.
Author contributions
Yongxu Lu, Yansong Xu, and Wei Zhang conceived and designed the study. Yongxu Lu, Yansong Xu, and Junlin Li performed study analyses. Xiaoyuan Liu was instrumental in the design and fabrication of the prototype. Yongxu Lu, Yansong Xu, and Feng Li wrote the article.
Financial support
This work was supported by the Strategic Priority Research Program on Space Science, the Chinese Academy of Sciences (Grant No.XDA1502030505); the LiaoNing Revitalization Talents Program (Grant No.XLYC1807167); the Independent Program of State Key Laboratory of Robotics (Grant No.2019-Z06); and the Fundamental Research Project of SIA (Grant Nos. 2022JC3K03 and 2023JC2G01).
Conflicts of interest
The authors have no financial or proprietary interests in any material discussed in this article.
Ethical approval
None.