


Introduction
The control of peach–potato aphids, Myzus persicae (Sulzer) (Hemiptera: Aphididae), is achieved primarily by the application of insecticides, often with multiple applications each year. This has led to the evolution of insecticide resistance conferred by three genetically-independent mechanisms (Devonshire et al., Reference Devonshire, Field, Foster, Moores, Williamson and Blackman1998). The first of these to be characterized was the over-production of one of two closely related carboxylesterases (E4 and FE4). Depending on the amount of carboxylesterase produced, individuals are classified into one of four somewhat arbitrary categories: S (susceptible), R1 (moderately resistant), R2 (highly resistant) or R3 (extremely resistant) (Devonshire et al., Reference Devonshire, Moores and ffrenchConstant1986). This mechanism confers strong resistance to organophosphates and lower resistance to carbamates and pyrethroids.
Two types of target-site insensitivity conferring insecticide resistance have also been found in M. persicae. Individuals with modified acetylcholinesterase (MACE) show high levels of resistance to dimethyl carbamates such as pirimicarb and triazamate (Moores et al., Reference Moores, Devine and Devonshire1994). The MACE phenotype has recently been shown to be associated with a single amino acid substitution (serine to phenylalanine, S431F) within the active site of the enzyme (Nabeshima et al., Reference Nabeshima, Kozaki, Tomita and Kono2003; Andrews et al., Reference Andrews, Callaghan, Field, Williamson and Moores2004). Two mutations in a voltage-gated sodium channel protein (kdr and super-kdr), conferring knockdown resistance to pyrethroids and DDT, have also been identified in M. persicae (Martinez-Torres et al., Reference Martinez-Torres, Foster, Field, Devonshire and Williamson1999; Eleftherianos et al., Reference Eleftherianos, Williamson, Foster and Denholm2002). The two mutations are L1014F (kdr) and M918T (super-kdr), based on the housefly para sequences (Embl acc: X96668).
Resistance to pyrethroids in Myzus persicae has been recorded throughout Europe (Field et al., Reference Field, Anderson, Denholm, Foster, Harling, Javed, Martinez-Torres, Moores, Williamson and Devonshire1997; Foster et al., Reference Foster, Denholm, Harling, Moores and Devonshire1998; Field & Foster, Reference Field and Foster2002; Mazzoni & Cravedi, Reference Mazzoni and Cravedi2002; Guillemaud et al., Reference Guillemaud, Brun, Anthony, Sauge, Boll, Delorme, Fournier, Lapchin and Vanlerberghe-Masutti2003a; Nauen & Elbert, Reference Nauen and Elbert2003; Anstead et al., Reference Anstead, Williamson, Eleftherianos and Denholm2004; Fenton et al., Reference Fenton, Malloch, Woodford, Foster, Anstead, Denholm, King and Pickup2005; Zamoum et al., Reference Zamoum, Simon, Crochard, Ballanger, Lapchin, Vanlerberghe-Masutti and Guillemaud2005), and in the USA, Japan and Chile (Field et al., Reference Field, Anderson, Denholm, Foster, Harling, Javed, Martinez-Torres, Moores, Williamson and Devonshire1997; Fuentes-Contreras et al., Reference Fuentes-Contreras, Figueroa, Reyes, Briones and Niemeyer2004). Due to the low number of samples in most of these studies, there are little meaningful data available on the frequency of resistance (with the exception of Zamoum et al. (Reference Zamoum, Simon, Crochard, Ballanger, Lapchin, Vanlerberghe-Masutti and Guillemaud2005)). Australian populations have been found to contain the 1,3 autosomal translocation associated with elevated E4 esterase (Wilson et al., Reference Wilson, Sunnucks, Blackman and Hales2002), indicating this resistance mechanism is probably present. Prior to this study, only a single clone (2169G), which was collected in October 1997 from Lincolnshire, had been found with the M918T mutation (in conjunction with L1014F) (Eleftherianos et al., Reference Eleftherianos, Williamson, Foster and Denholm2002).
In the present study, we use a novel allelic discriminating polymerase chain reaction (PCR) assay (Anstead et al., Reference Anstead, Williamson, Eleftherianos and Denholm2004) to investigate the temporal and spatial incidence of kdr alleles in samples collected from either field sites or 12.2 m suction traps in the UK, mainland Europe, Zimbabwe and south-eastern Australia. The new assay enables higher-throughput screening for kdr mutations than was previously possible and has also enabled an examination of associations between kdr genotypes and the MACE and overproduced esterase mechanisms.
Materials and methods
Aphid samples
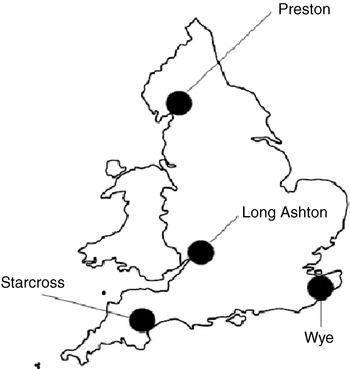
Samples from field crops were obtained from a variety of sources in Europe, Zimbabwe and the state of Victoria in Australia. Aphids from Europe and Africa were either shipped alive on plant material or in 95% ethanol. The ethanol preserved specimens could only be tested for kdr mutations as the MACE and carboxylesterase tests need active enzymes that are denatured by storage in alcohol. Samples from Australia were shipped frozen in ‘solution 21’ (25% glycerol, 0.5% Triton X-100, 100 mm KCl, 20 mm Tris (hydroxymethyl) aminomethane, 1 mm oxytetracycline, 10 μm CuSO4) (Tatchell et al., Reference Tatchell, Thorn, Loxdale and Devonshire1988), preserving enzyme activity and DNA. Aphids were also obtained from Rothamsted's UK-wide network of suction traps (Woiwod & Harrington, Reference Woiwod, Harrington, Leigh and Johnston1994), and these were always shipped in alcohol. The four UK traps used were Preston (53°51′16″, 2°45′47″), Long Ashton (51°25′35″, 2°40′2″), Starcross (50°37′44″, 3°27′13″) and Wye (51°11′50″, 0°56′21″). The trap locations are shown in fig. 1. The Long Ashton trap was discontinued at the end of 2002, so collections were made from Preston in 2003. Aphids were collected from the three UK suction traps daily; up to two aphids from each day of collection were tested for kdr and super-kdr from each of the traps. A further 12 individuals were obtained in Sweden from a suction trap based on the design of the Rothamsted traps. European sample site locations are shown in fig. 2. All the Australian samples were collected from the state of Victoria, and these field locations are shown in fig. 3.
The locations of 12.2 m suction traps used for the collection of Myzus persicae from the United Kingdom in 2002/3.
The location of European Myzus persicae collection field sites and the Swedish suction trap 2001–2003. The number of individuals collected is indicated.

The location of collection sites for Myzus persicae in the state of Victoria, Australia 2002, and the number of clonal lineages tested.

Insecticide resistance
The kdr and super-kdr mutations were diagnosed using a rapid allelic discrimination PCR assay (Anstead et al., Reference Anstead, Williamson, Eleftherianos and Denholm2004). During PCR amplification of the resistance allele, two Taqman MBG probes, labelled with different flourophores, bind to the resistant and susceptible allele. The ratio between the fluorescence at the appropriate wavelengths allows the genotype of the resistance allele to be determined. Aphids were assigned genotypes using the following codes: SRSR, heterozygous at both sites; RRSS, homozygous resistant at kdr, homozygous susceptible at super-kdr; SRSS, heterozygous at kdr, susceptible at super-kdr; SSSS, homozygous susceptible at both sites; RRRR, homozygous resistant at both sites. MACE was diagnosed using a kinetic enzyme inhibition assay (Moores et al., Reference Moores, Devine and Devonshire1994), and carboxylesterase levels were determined by immunoassay (Devonshire et al., Reference Devonshire, Moores and ffrenchConstant1986). For genotypic testing, single aphids were homogenized in 50 μl of PBS/Tween (phosphate buffer, 0.02 m, pH 7.0 containing 0.05 v/v Tween 20) in the wells of a microtitre plate using a multihomogenizer (ffrenchConstant & Devonshire, Reference ffrenchConstant and Devonshire1987). One μl was used for carboxylesterase testing, 5 μl was removed for the extraction of genomic DNA for diagnosing kdr and super-kdr and the remainder was used to test the MACE phenotype (either susceptible or resistant, the latter including aphids both heterozygous and homozygous for the MACE mutation.
Statistical analysis
Deviations from Hardy-Weinberg equilibrium at the kdr and super-kdr mutation sites were tested for in-field collected samples when more than ten aphids were available. Associations between elevated carboxylesterase, kdr, super-kdr and MACE were analysed using standard t-tests and analysis of variance (unbalanced design) (ANOVA). Linkage disequilibrium between the two kdr mutations and MACE was calculated using DIS (available from http://www.ucl.ac.uk/taxome/jim/bin/software.html) (Dasmahapatra et al., Reference Dasmahapatra, Blum, Aiello, Hackwell, Davies, Bermingham and Mallett2002), as were deviations from Hardy-Weinberg equilibrium. Data were pooled by country and year to increase the sample size for linkage disequilibrium calculations. The French and Australian samples were omitted from the linkage disequilibrium analysis as neither MACE nor super-kdr was found in these areas.
Results
Overall geographical distribution of resistance
A summary of the distribution of resistance mechanisms is shown in table 1. Elevated carboxylesterase was the most widespread resistance mechanism and was present in all samples. The kdr mutation was also widely found, only being absent from the Zimbabwean sample. MACE and the super-kdr mutation were both absent from samples from Australia and Zimbabwe. There were considerable differences between the frequencies of resistance mechanisms in the samples, probably due to different insecticide selection pressures. Kdr was present at frequencies between 0.19 and 0.66 in all but two of the samples; it was absent from aphids from Zimbabwe and was present, as a homozygote, in all the aphids from the Swedish suction trap. Super-kdr was present at much lower frequencies and was absent from a number of samples including some that were relatively large (e.g. samples collected from Germany in 2002 and 2003). In some samples, especially those from Greece and Italy, selection seems to have completely removed the lower carboxylesterase categories and all aphids collected scored as R2 or R3.
Geographical incidence of resistance mechanisms and genotypes of Myzus persicae.

a Samples collected and subsequently stored in alcohol could not be tested for carboxylesterase levels or for MACE.
Carboxylesterase levels are divided into the four standard categories of resistance. Kdr and super-kdr are shown as allele frequencies. MACE is shown as the frequency of the MACE phenotype, i.e. homozygotes and heterozygotes combined.
UK suction trap catches in 2002 and 2003
Numbers of M. persicae caught in the three suction traps in 2002 and 2003 shown a bi-modal distribution typical of M. persicae in the UK (fig. 4) where two major flights per season occur (Karley et al., Reference Karley, Parker, Pitchford and Douglas2004). This pattern was generally apparent in the data from each trap (fig. 4), although the timing and magnitude of the flights varied between traps and years. In 2002, the highest total number of aphids was collected from Starcross (92), then Wye (74) and Long Ashton (32). In 2003 higher total numbers were collected from Wye (318) than Preston (131) and Starcross (54). Overall aphid numbers were higher in 2003 and this was reflected at each trap.
Total number of Myzus persicae collected from three UK suction traps in 2002 ( , Long Ashton;
, Wye; □, Starcross) and 2003 (, Preston;
, Wye; □, Starcross).

Figure 5 shows the incidence of knockdown resistance detected in the combined trap catches for 2002 and 2003. In both 2002 and 2003 the kdr mutation was present during every month of M. persicae collection, although the frequency varied considerably; ranging from 5% (August 2003) to 65% (October 2002) (fig. 5). In 2003 it was found during every month at every trap, with the exception of two months at the Preston trap when only a single aphid was recorded. The kdr mutation was found most commonly as a heterozygote without the super-kdr mutation (SRSS). In contrast the super-kdr mutation was only detected during August and September 2002 and June and September 2003. In June 2003 when the super-kdr mutation was at a frequency of 0.15, aphids with this mutation were caught at all three traps. However in September 2003, super-kdr aphids were only caught at Preston. The two most common genotypes were SSSS (no resistance mutations) and SRSS (heterozygous for kdr, homozygous susceptible for the super-kdr mutation). No individual from field or suction trap sample was found with the super-kdr mutation alone. It was always accompanied by the kdr mutation.
Knockdown resistance genotypes of Myzus persicae collected from three UK suction traps (combined) in 2002 (□, SRSR;
, RRSS;
, SRSS; ■, SSSS) and 2003 (
, RRRR; □, SRSR;
, RRSS;
, SRSS; ■, SSSS). See text for genotype annotation.

Hardy-Weinberg equilibrium
Deviations from Hardy-Weinberg equilibrium were calculated from samples collected from single fields and from the UK trap samples in 2002 and 2003 (pooled for the whole year) (table 2). The sample sites ranged from Scottish samples where, it is believed, no sexual recombination occurs (due to the absence of peach), to Greek peach samples, which were spring-collected, when the aphids had just gone through a cycle of sexual reproduction (M. persicae undergoes sexual reproduction exclusively on peach trees). All but one set of samples showed a heterozygous excess, although the level of statistical significance varied.
Tests for Hardy-Weinberg equilibrium of knockdown resistance mutations in field samples of Myzus persicae. The frequency of each resistant genotype is also shown.

A negative value for F represents an excess of heterozygotes * P<0.05, ** P<0.01, *** P<0.001.
Associations between mechanisms
To improve statistical power when calculating associations between resistance, the continuously distributed carboxylesterase immunoassay values were used (Devonshire et al., Reference Devonshire, Moores and ffrenchConstant1986) instead of the usual four categories of carboxylesterase level (S, R1, R2, R3). Figure 6 shows the mean carboxylesterase levels for aphids collected in 2002 and 2003 with, and without, the MACE mutation. Aphids containing the MACE mutation had mean carboxylesterase levels significantly higher (equivalent to R2) than those without it (equivalent to R1) (t=9.7, P<0.001).
The relationship between carboxylesterase level and the presence of the MACE mutation in samples of Myzus persicae. Error bars indicate 95% confidence of the mean (MACE, n=129; non-MACE, n=161).

Mean carboxylesterase levels for M. persicae collected in 2002 and 2003 with different kdr genotypes are shown in fig. 7. Based on ANOVA, SSSS, SRSS and RRSS, aphids had significantly lower carboxylesterase levels than SRSR. SSSS and SRSS aphids had significantly lower carboxylesterase levels than RRSS aphids. There was no significant difference in carboxylesterase levels between SSSS and SRSS aphids. SRSR aphids had a mean carboxylesterase activity equivalent to R3, RRSS to R2 and SSSS/SRSS to R1.
The relationship between kdr genotype and carboxylesterase levels in Myzus persicae, error bars indicate 95% confidence of the mean (SSSS, n=86; SRSS, n=148; RRSS, n=8; SRSR, n=44). Bars denoted by different letters differ significantly in mean carboxylesterase levels based on ANOVA (P<0.05, 3 df, LSD=0.4, F<0.001).

In samples for which data were available on kdr, super-kdr and MACE showed that the kdr and super-kdr mutations were in very strong linkage disequilibrium, as expected because of the very tight linkage between these two sites in the same gene (table 3). There was also significant linkage disequilibrium between MACE and kdr and MACE and super-kdr in the UK, but no significant linkage disequilibrium between MACE and kdr in Germany (where super-kdr was absent). In Greece and Italy, there was no significant linkage disequilibrium between MACE and kdr or super-kdr.
Correlation coefficients for linkage target-site resistance mutations in Myzus Persicae.
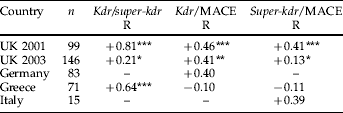
* P<0.05, ** P<0.01, *** P<0.001.
Discussion
The availability of a high throughput method for screening knockdown resistance genotypes in M. persicae has enabled the most comprehensive analysis to date of the incidence of alleles responsible for this mechanism. The inclusion of suction trap samples provides an interesting contrast to those from field crops, which are more likely to reflect localized events including insecticide treatment regimes. Research has shown that populations caught in suction traps are representative of a large area (Taylor, Reference Taylor, Rabb and Kennedy1979). Observations of M. persicae abundance from individual traps were found to be correlated over distances up to approximately 700 km (Cocu et al., Reference Cocu, Harrington, Hulle and Rounsevell2005), indicating the population sampled should be representative of the population as a whole over these distances.
Host-alternating aphids, such as M. persicae, typically undergo two migratory events during a season, one in spring as aphids move from their primary to their secondary host and one in the autumn when they return (Taylor, Reference Taylor, Rabb and Kennedy1979; Weisser, Reference Weisser2000). This pattern was seen in M. persicae caught in 2002 and 2003. However, in both years a single trap (Starcross in 2002 and Wye in 2003) showed a peak in July that was later than expected for a spring migration event. This peak was likely to have been due to the production of alates on secondary hosts. Aphid alates on secondary hosts are normally produced in response to over-crowding or reduced host-quality (Muller et al., Reference Muller, Williams and Hardie2001).
The kdr mutation (L1014F) was present in all the countries sampled with the exception of Zimbabwe. L1014F has now been found in M. persicae from every continent where this species is known to occur. Elevated carboxylesterases were also common in all the countries sampled, in some cases to the exclusion of susceptible aphids. MACE and super-kdr were both found throughout Europe but were not found in samples from Australia and Zimbabwe. However, the Zimbabwean sample was a small one from a single field, so no conclusions can be drawn about the status of kdr, super-kdr or MACE from this country. The samples from Australia were collected from a number of different sites and hosts and represented the most common clones found in the state of Victoria (Vorburger et al., Reference Vorburger, Lancaster and Sunnucks2003). Some of these samples had also been subject to intense selection with pyrethroids and carbamates. If the super-kdr mutation and/or MACE were present in Victoria, it should have been present in these samples.
There was a strong contrast in the temporal patterns of kdr and super-kdr mutations in the UK suction trap catches. The kdr mutation was present throughout the trapping season, whereas the super-kdr mutation appeared only in samples from August and September 2002 and from June and September 2003. Numbers tested were too low to disclose clear trends in the occurrence of this mutation, but a plausible explanation is that numbers build up under selection by pyrethroids but then decline in the absence of insecticide pressure (although this was not directly tested). This would imply that super-kdr in M. persicae confers a greater fitness cost than kdr in the absence of insecticide selection. Various side-effects of resistance on the biology of M. persicae have been postulated or demonstrated to influence fitness, including reduced overwintering success and varying response to environmental cues (Foster et al., Reference Foster, Denholm and Thompson2003a,Reference Foster, Kift, Baverstock, Sime, Reynolds, Jones, Thompson and Tatchellb).
Both the kdr and super-kdr mutations were in heterozygous excess; and in most cases, deviation from Hardy-Weinberg expectation was significant. This heterozygous excess is most likely to indicate selection against individuals homozygous for kdr and super-kdr. Homozygous susceptible M. persicae are most likely selected against by the application of insecticides as kdr gives some resistance to pyrethroids even when present as a heterozygote in M. persicae (Foster et al., Reference Foster, Denholm and Devonshire2002). Individuals heterozygous at both mutations are highly resistant and unaffected by high doses of pyrethroids (Eleftherianos et al., Reference Eleftherianos, Williamson, Foster and Denholm2002). Homozygous resistant individuals are rare for kdr and very rare for super-kdr. This is almost certainly due to fitness costs associated with resistance, either as a direct result of the resistance or because deleterious recessive mutations are associated with the resistance mutation. There are known fitness costs associated with the kdr mutation in M. persicae. The presence of kdr is associated with a decreased response to alarm pheromone, which could render them more vulnerable to predation or parasitism (Foster et al., Reference Foster, Young, Williamson, Duce, Denholm and Devine2003c). Both susceptible and heterozygous individuals show a significantly decreased response when compared to homozygous resistant individuals, and susceptible individuals show a significantly decreased response when compared to heterozygous individuals. Heterozygote deficit in microsatellites seems to be the general rule in M. persicae populations studied to date (Wilson et al., Reference Wilson, Sunnucks, Blackman and Hales2002; Fenton et al., Reference Fenton, Malloch, Navajas, Hillier and Birch2003; Guillemaud et al., Reference Guillemaud, Mieuzet and Simon2003b). Homozygous excess has also been found in French Sitobion avenae (Fabricius) populations (Simon et al., Reference Simon, Baumann, Sunnucks, Hebert, Pierre, Le Gallic and Dedryver1999) although heterozygous excess has been found in Rhopalosiphum padi (Linnaeus) (Delmotte et al., Reference Delmotte, Leterme, Gauthier, Rispe and Simon2002) and various Sitobion species (Sunnucks et al., Reference Sunnucks, England, Taylor and Hales1996; Wilson et al., Reference Wilson, Sunnucks and Hales1999). As these loci are in non-coding regions, selection probably would not have caused these deviations. Asexuality coupled with strong clonal selection, so that a few clones are highly over-represented, is instead likely to cause deviations from Hardy-Weinberg equilibrium for all polymorphic loci (including microsatellites) via hitch-hiking. This effect could result in heterozygote deficit or excess and would be expected to differ strongly among loci. The data for microsatellites generally shows this pattern (e.g. Zamoum et al., Reference Zamoum, Simon, Crochard, Ballanger, Lapchin, Vanlerberghe-Masutti and Guillemaud2005). Therefore, while the strong heterozygote excesses at kdr and super-kdr are consistent with selection against homozygotes, they may also be caused by over-representation of certain clones that just happen to be heterozygous at resistance loci. Nonetheless, because of the consistent strong heterozygote deficit across all populations, including known sexual populations, selection is the most likely explanation.
During the sampling, only some of the possible genotypic combinations of the two mutations conferring kdr resistance were detected. The super-kdr mutation was only ever found in conjunction with kdr. The most likely explanations for this are either that super-kdr arose in one or more alleles already containing the kdr mutation (Anstead et al., Reference Anstead, Williamson and Denholm2005) and little or no recombination has occurred between the mutations, or that the presence of the super-kdr mutation alone is highly disadvantageous (see Morin et al., Reference Morin, Williamson, Goodson, Brown, Tabashnik and Dennehy2002). In either case, only three alleles would be expected to predominate: fully susceptible, resistant at kdr but susceptible at super-kdr, and resistant at both sites. These three alleles form six possible genotypes, of which only five were found. No individuals were found that were homozygous resistant for kdr and heterozygous for super-kdr (RRSR). The likely frequency, assuming Hardy-Weinberg equilibrium, of this genotype can be calculated from the kdr/super-kdr gamete frequencies (kdr resistant, super-kdr susceptible=0.206; kdr resistant, super-kdr resistant=0.127) from all sites combined. This means approximately 5% of the individuals (0.206∗0.127∗2=0.0522 ) should be RRSR. One problem with determining if the absence of this genotype is significant is that there is no information available on the clonal diversity within these samples. However, the relationship between the number of individuals and the number of clonal lineages has been explored in other studies. If these samples follow the same pattern as those in Fenton et al. (Reference Fenton, Woodford and Malloch1998), for instance, there would be approximately 200 separate clonal lineages. The chance of failing to detect one RRSR individual from 200 randomly selected clonal lineages, if they were present at 5% of the population, is (1−0.05)200 which is <0.005.
As expected, there was strong linkage disequilibrium shown between kdr and super-kdr. These are two mutations of the same gene and, as such, are strongly physically linked. It is also not surprising to see an association between the levels of carboxylesterase and the kdr and super-kdr resistance mutations since both give resistance to pyrethroids. Elevated levels of carboxylesterase sequester and detoxify the pyrethroid, and the kdr and super-kdr reduce the sensitivity of the voltage-gated sodium channel (Devonshire et al., Reference Devonshire, Field, Foster, Moores, Williamson and Blackman1998). Both should be selected for by insecticide pressure and, in asexual populations, would be likely to stay associated. The association between esterase and MACE is less pronounced. MACE aphids have an average R2 esterase level and non-MACE have R1. The association between MACE and esterase and its state of linkage disequilibrium with the two sodium channel mutations is likely to be related to asexual reproduction. If a population of asexually reproducing, clones are sprayed with a pyrethroid and then a carbamate; only those with both sets of resistance will survive leading to linkage disequilibrium within the population. Some popular insecticides are mixtures of carbamates and pyrethroids and select for mechanisms simultaneously. In southern Europe, where M. persicae can reproduce sexually, the linkage between MACE and kdr/super-kdr breaks down, presumably as a consequence of recombination.
In summary, insecticide resistance remains a large problem in M. persicae, with all three mechanisms widespread throughout Europe. This is likely to present control difficulties, especially where all three resistance mechanisms are present in individual aphids. This was shown to have been the case in Scotland, where two clones possessing all three resistance mechanisms were responsible for a number of insecticide control failures in 2001 (Fenton et al., Reference Fenton, Malloch, Woodford, Foster, Anstead, Denholm, King and Pickup2005). A recent study in northern France also showed the presence of a predominating microsatellite genotype, which combined the kdr and elevated esterase mechanisms; although in this case, it did not have the MACE mutation and its super-kdr status was unknown (Zamoum et al., Reference Zamoum, Simon, Crochard, Ballanger, Lapchin, Vanlerberghe-Masutti and Guillemaud2005). However, the apparent selective disadvantage for kdr, as a homozygote, and to super-kdr, in any form in the absence of insecticide pressure, should reduce the frequency of resistance between seasons. More work is needed on this subject. The super-kdr mutation, in particular, seems to be associated with a high fitness cost in the absence of insecticide selection. As yet it is not clear if this fitness cost is caused by the mutation itself or associated deleterious mutations. If it is caused by associated mutations, we might expect this cost to diminish over time as sexual recombination ‘frees’ it from these mutations, and this could lead to a major outbreak of highly resistant strains.
One weakness of studies utilizing suction trap material is that it is almost impossible to relate samples to insecticide application data, as suction traps are representative of populations over very large heterogeneous areas. This reveals a need for detailed field studies relating the frequency of resistant genotypes over time to the application of insecticides at the field level. This kind of study could answer questions about the fitness of different resistance genotypes in the presence and absence of insecticide applications and under different abiotic conditions.
There is also intriguing interaction between selection on the one hand and life-cycle on the other. Sexual reproduction produces a large number of different genotypes, both for insecticide resistance and other genes (e.g. for adaptation to different climatic conditions). Asexual reproduction then fixes these combinations temporarily, and the most successful clones increase massively. This combination of a single sexual cycle followed by numerous asexual cycles is very successful in adaptation to the sudden strong selection pressures of insecticide application. The sexual stage ensures the production of new combinations of genes, e.g. a clone with three resistance mechanisms, and the asexual generations ensure the most successful combinations are maintained.
Acknowledgements
This work was funded by a CASE studentship from BBSRC with industrial support from Syngenta. The authors thank Dr Richard Harrington and the Rothamsted insect survey team, Dr John Margaritopolous (University of Thessaly), Dr Brian Fenton (SCRI), Russ Slater (Syngenta), and Cristoph Vorburger (La Trobe University) for samples. Rothamsted Research receives grant-aided support from the Biotechnology and Biological Sciences Research Council.



