


Introduction
Although the bulk of sea ice is imperfect, for mathematical convenience it is often assumed by modellers to be uniform in its physical and material properties, especially by those who seek to understand how it affects the passage of ocean waves (Reference Squire, Dugan, Wadhams, Rottier and LiuSquire and others, 1995). This approximation works in many circumstances, allowing theoretical conclusions to be drawn and results to be found that have subsequently been validated by field and laboratory experiments (e.g. Reference SquireSquire, 1984). Theoreticians argue that, because the length of "typical" ocean waves greatly exceeds the width of features such as cracks, pressure ridges and leads, the effect of the flaws will be minimal when horizontal scales are not too big. The extrapolation of such conclusions to geophysical scales to answer geophysical questions has, on the other hand, been controversial (Reference SquireSquire, 1995), in large part because of the spatial variability of sea ice and the accumulated effect of the many imperfections that a train of waves must encounter as it progresses further into an ice pack.
There has also been recent interest in using waves to "remotely sense" ice thickness. The basis of such proposals is that theory and its associated experiments have, over the last 20 years or so, become sufficiently convincing that we now feel that we understand how waves and sea ice in its many forms interact. Accordingly, when provided with the wave intensity outside and within the ice field, measured perhaps by satellite radar altimetry, synthetic aperture radar or scatterometry, the models can be tuned, at least in principle, to output an estimate of mean ice thickness. Unfortunately, the majority of models still assume that the ice behaves as a uniform plate without flaws or an unsophisticated aggregation of such plates.
In this paper we study wave propagation in an imperfect ice sheet. We consider what happens when an ice-coupled wave field travelling in an otherwise uniform ice sheet encounters an area of heavily cracked sea ice at normal incidence. Alternatively, the waves may enter a region where the ice is fractured into floes that are present at high concentration. The shear zone that forms between moving and stationary sea ice in the Arctic basin could be modelled like this.
A single crack in an otherwise perfect ice sheet has been looked at before. Reference Barrett and SquireBarrett and Squire (1996) solved the problem numerically for a finite-depth ocean, and recently Reference Squire, Dixon and ChungSquire and Dixon (2000a) have also reported a solution for deep water. The latter paper furnishes simple formulae for the reflection and transmission coefficients, R and T, that produce results identical to the Barrett and Squire model without having to solve a complicated and tedious matching problem. The formulae, which need only the ice-coupled wave numbers that are the roots of a quintic polynomial, can easily be evaluated for a given wave period by a few lines of MATLAB code. The current paper generalizes the Squire and Dixon result to multiple cracks, including the single crack as a special case. For N cracks, R and T emerge from the solution of a 2N × 2N matrix system made up of equations that do not sensibly decouple to provide natural formulae for R and T. However, MATLAB can again compute the solution without difficulty
The mathematical solution first requires a Green’s function to be found for an infinite homogeneous ice sheet floating on the surface of deep water. This has been done by Reference Squire and DixonSquire and Dixon (2000b), who report the solution to a different problem, and Reference Squire, Dixon and ChungSquire and Dixon (2000a). Their result, which extends the earlier work of Reference Meylan and SquireMeylan and Squire (1994), will just be quoted here. Green’s theorem in the plane is then used to formulate an equation that directly links the velocity potential φ(x,z) with the sum of the asymptotic terms at ±∞ and the terms that arise at the many edges of the multiply cracked ice sheet, presupposing that the bending moments and shears vanish at each crack but at this stage assuming only that they are continuous there. This generalizes Reference Squire, Dixon and ChungSquire and Dixon (2000a). Finally, assuming that the displacements and displacement gradients at the crack boundaries are finite, the equations are cast into the form of a system. To do this we demand that the adjoint bending moments and shears vanish at each crack edge, thereby completing the application of the necessary four boundary conditions for every crack. The system is solved straightforwardly to produce response curves for different crack systems and ice thicknesses.
Mathematical Model
A one-dimensional sea-ice sheet of thickness h and density p’ floats on deep water of density p. The sheet is assumed to be a thin elastic beam of infinite extent with rigidity d. Long-crested, ice-coupled waves of radian frequency w propagate in the positive × direction towards n cracks in the sheet located at points xn lying in the finite closed interval [0, L]. Coordinate z is taken to be vertically downwards. The ice-coupled waves are understood to be controlled by both the properties of the ice sheet in which they travel and the inertia of the water beneath (Reference Fox and SquireFox and Squire, 1994).
To avoid excessive mathematical detail the description that follows draws upon the first part of Reference Squire and DixonSquire and Dixon (2000b). That paper describes how the required Green’s function is derived, but applies it to a different problem, namely, to waves impinging upon an iceberg or thick ice floe trapped in sea ice. The interested reader is referred to that paper but should note that the integral equation that eventuates there is an added complication that does not arise in the current paper. Assuming that the velocity potential describing the system is separable and is periodic in time (e−iωt), the non-dimensionahzed boundary value problem we seek to solve for φ(x, z) is
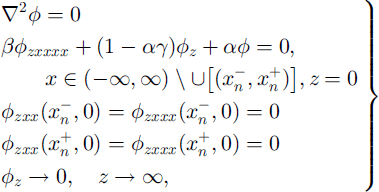
where the length scale chosen for non-dimensionalization is the distance l that designates the breadth of the cracked region. The non-dimensional parameters a, (5 and 7 are defined α = lω2 /g, g, β = D/gρl4 and γ = ρ’h/ρl. In common with other wave problems of this type, Equations (1) must be supplemented by suitable radiation conditions at ±∞.
The half-space Green’s function
The Green’s function G(ξ,ζ;x,z), x ∊( —∞, ∞), ≥0, which describes a uniform thin beam floating on a deep-water half-space, satisfies the system
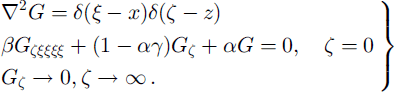
Reference Squire, Dixon and ChungSquire and Dixon (2000a) use Fourier transforms with respect to ξ- × to calculate g as follows
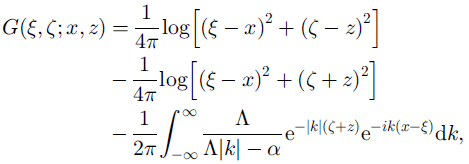
where A = A(k) = βk4 + 1 - αγ. This reduces to the better-known Green’s function for deep open water when β = γ = 0 (Reference Wehausen, Laitone and FluggeWehausen and Laitone, 1960).
The integral in Equation (3) is found by contour integration, first recognizing that it is equivalent to

where  denotes the real part, and then writing this integral as
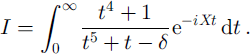
The parameters appearing in Equation (5) are

Note that  , where
 denotes the imaginary part, as z and ζ are always zero or positive. This is essential or the integral in Equation (5) will fail to converge. Use of partial fractions finally gives the contribution from the integral / to G(ξ,ζ;x,z)
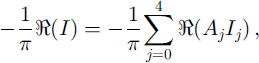
where
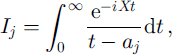
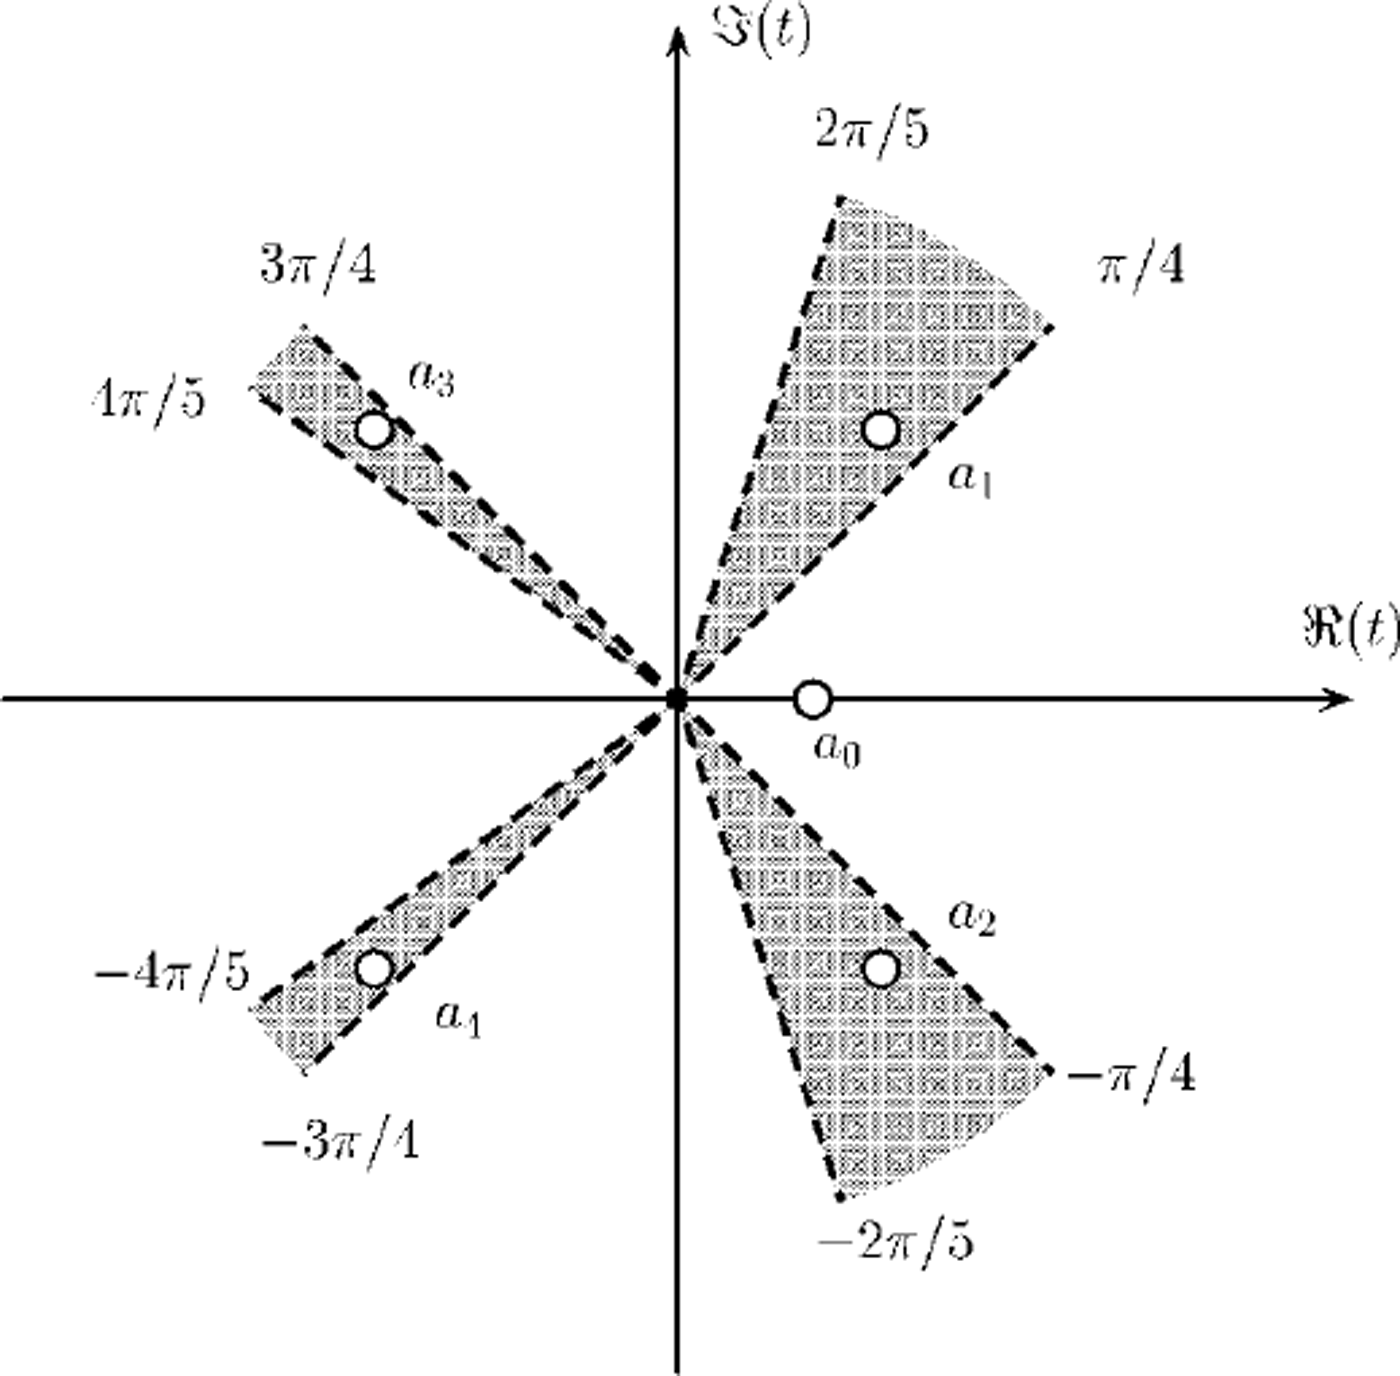
and a, are the five roots of t5 −t-δ = 0, which, for 6 > 0, lie as shown in Figure 1. The roots of the original dispersion relation Λk - α = 0 are kj = vaj; the a, always lie in the shaded sectors shown. Each integral appearing in the summation in Equation (6) may be evaluated by contour integration (Reference Squire and DixonSquire and Dixon, 2000b). For any × such that this is laborious, but fortunately such generality is not needed here, as to find r and t the integral will be required only at the surface. The result involves sine and cosine integral auxiliary functions (Reference Abramowitz and StegunAbramowitz and Stegun, 1965, p. 228−237), the latter function having a logarithmic singularity as × ^ 0.
Zeros of the transformed dispersion relation t5+y-δ = 0.
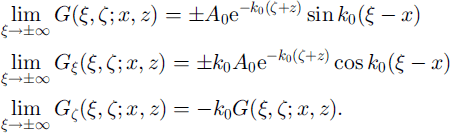
Because the asymptotic behaviour of the Green’s function is dominated by the real pole as × → ±∞, we may also reason, for example, that for ω 0
Finding r and t
Green’s theorem in the plane is now applied to a rectangle with sides ξ = −ξ0, where Co and Co are taken to be sufficiently large to include the point (x, z). Because
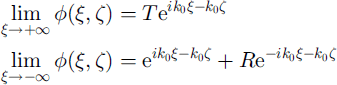
the contributions at each end, i.e. as ξ0 = ∞ are, respectively,
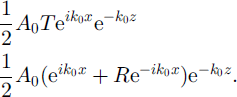
No contribution arises from the sea floor Co → ∞ because of the boundary condition there. On ζ = 0, however, n + 1 contributions arise, each originating from the section of uniform ice between the n cracks. Noting that the region of cracked ice extends from ξ1 = 0 to ξN = 1 in non-dimen-sionalized coordinates, the outermost terms are
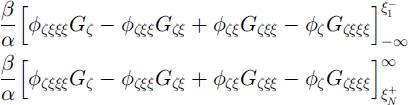
whereas all inner contributions take the form

for n = 1, . .. n - 1. The ±∞ limits in terms (10) combine with terms (9) to give
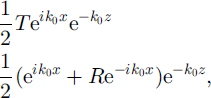
respectively, as they must for the asymptotic behaviour to be self-consistent. Because of the manner in which terms pair up across each crack, the free-edge boundary conditions, namely,  and
 , cannot be applied in full at this stage. Instead, we may only require that
 and
 . i.e. that the bending moments and shears are continuous across
 . Later we will insist that all are zero. Each crack therefore contributes terms
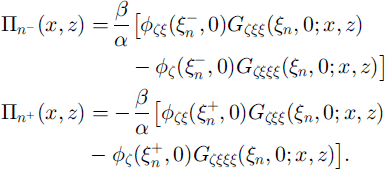
Bringing together results (12) and (13) we obtain an equation for φ(x,z) as follows:
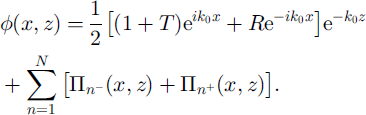
Expression (14) may be used to find the reflection and transmission coefficients, r and t, respectively. This is achieved by taking z = 0 and x = 0 then comparing the coefficients of the linearly independent functions  and
 The same can be done by considering x = −0 this is the self-consistency condition we referred to earlier. In either case, we obtain
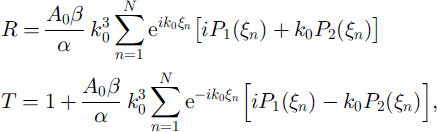
where

Resubstitution into Equation (14) gives a final equation for </>:
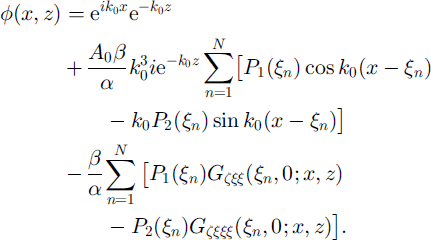
Equation (16) still has 2N unknowns, p1(ξn) and P2(ξn), that arise from the boundary terms on each side of the n cracks. Using xn and ξn interchangeably, these unknowns can be found by completing the application of the free-edge boundary conditions by setting φzxx(xn, 0) and φzxxx(xn, 0) to zero. This is done by first differentiating Equation (16) formally to obtain φzxx(x, z) and φzxxx(x,z), which, on taking the limit z → 0, are
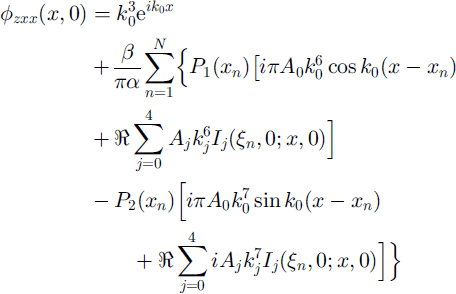

where the behaviour of the sine and cosine integral auxiliary functions for small arguments (Reference Abramowitz and StegunAbramowitz and Stegun, 1965, p. 233) has been used. Fortunately, potentially singular contributions vanish, either in the process of taking the real part or because the roots aj of t5 +1 - δ = 0 satisfy  and
 for m = 1 . . . 4 4, when written in terms of A;,, Similar expressions for higher powers of k3 follow from
 Expressions (17) and (18) must be set to zero at each of the cracks xn, n = 1 . . . N; because continuity holds this can be done by approaching the crack from either
 or
 the result is the same.
The system of equations that results from the foregoing process decouples when only a single crack is present. Supposing this is at x1, P1(x1) and P2(x1) are simply given by
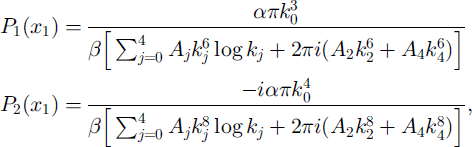
which may be compared with Equations (17) of Reference Squire, Dixon and ChungSquire and Dixon (2000a). (The slight difference arises because the current non-dimensionalization is based on the breadth of the cracked region L, which is inappropriate for a single crack.) The requirement to take real parts vanishes in Equations (19) because the complex terms in the j-summation appear as conjugate pairs. In this case, the reflection and transmission coefficients are given by

When more than one crack is present, i.e. N > 1, a matrix equation of the form CP = K emerges, where the vectors
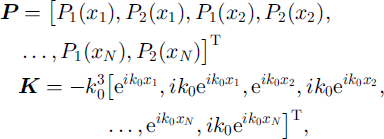
where []T denotes transpose. C is a 2 2N × 2 2N matrix with elements constructed from the coefficients of P1 (xn) and P2(xn) that appear in Equations (17) and (18). The matrix C has a convenient structure that allows it to be filled systematically: its odd and even rows are derived from Equations (17) and (18), respectively; and its columns occur in pairs for × = x1, × = x2, . . . , × = xn. Once C and the vectors P and K are filled, MATLAB is used to solve the system for P with a single command, thereby allowing R and T to be found from Equation (15). When N = 1 the solution reverts to the single-crack results expressed by Equations (20). The result is checked by using the energy-conservation condition |R|2 + |T|2 = 1
Results
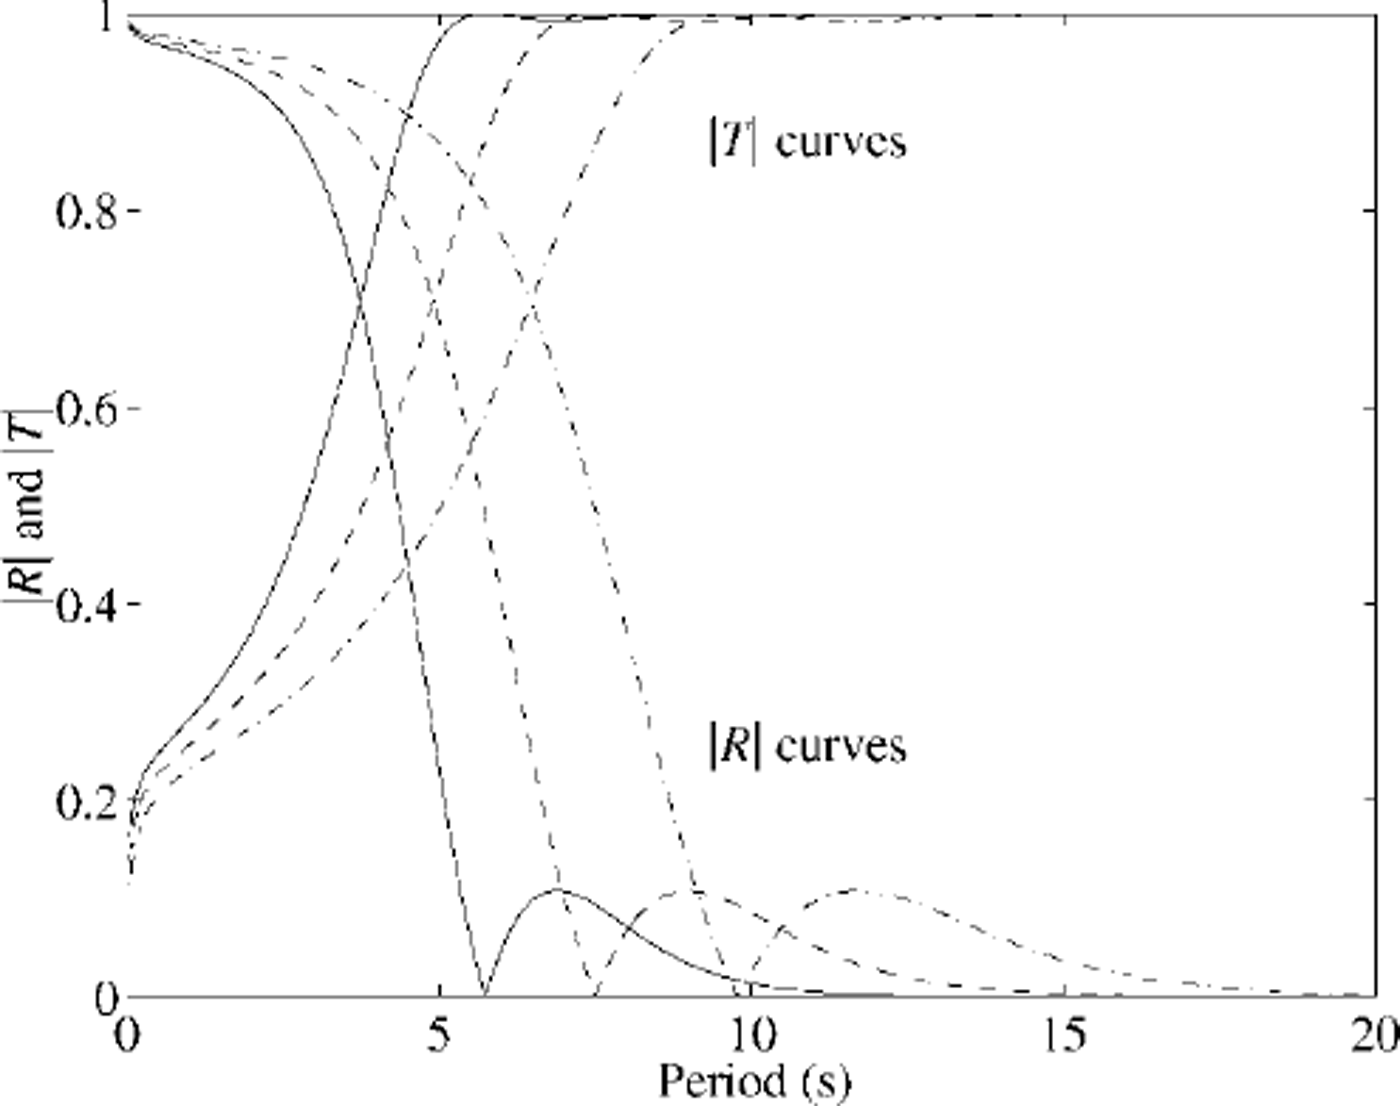
Figure 2 shows, for three different ice thicknesses, the magnitude of R and T for a single crack, plotted as a function of wave period. Recalling that the thin-plate model becomes less valid as wavelength and ice thickness become comparable, each curve grows more approximate as zero is approached. (A thick-plate model including rotatory inertia and transverse shear could be used in this region if necessary.) The crack responds as a low-pass filter with a steep transition band and a zero in |R| at the centre point of a 2π phase change in arg R. |T| = 1 at about 5.7 s for h= 0.5 m, 7.5 s for lm and 9.8 s for 2 m. As period is increased past the zero, |R| increases to a low maximum before tending to 0 again, although transmission is actually effectively perfect at periods beyond the zero. More details are given in Reference Squire, Dixon and ChungSquire and Dixon (2000a).
Magnitude of the reflection and transmission coefficients due to an open crack at three ice thicknesses: 0.5 m (solid), 1.0 m (dashed), 2.0 m (chained).
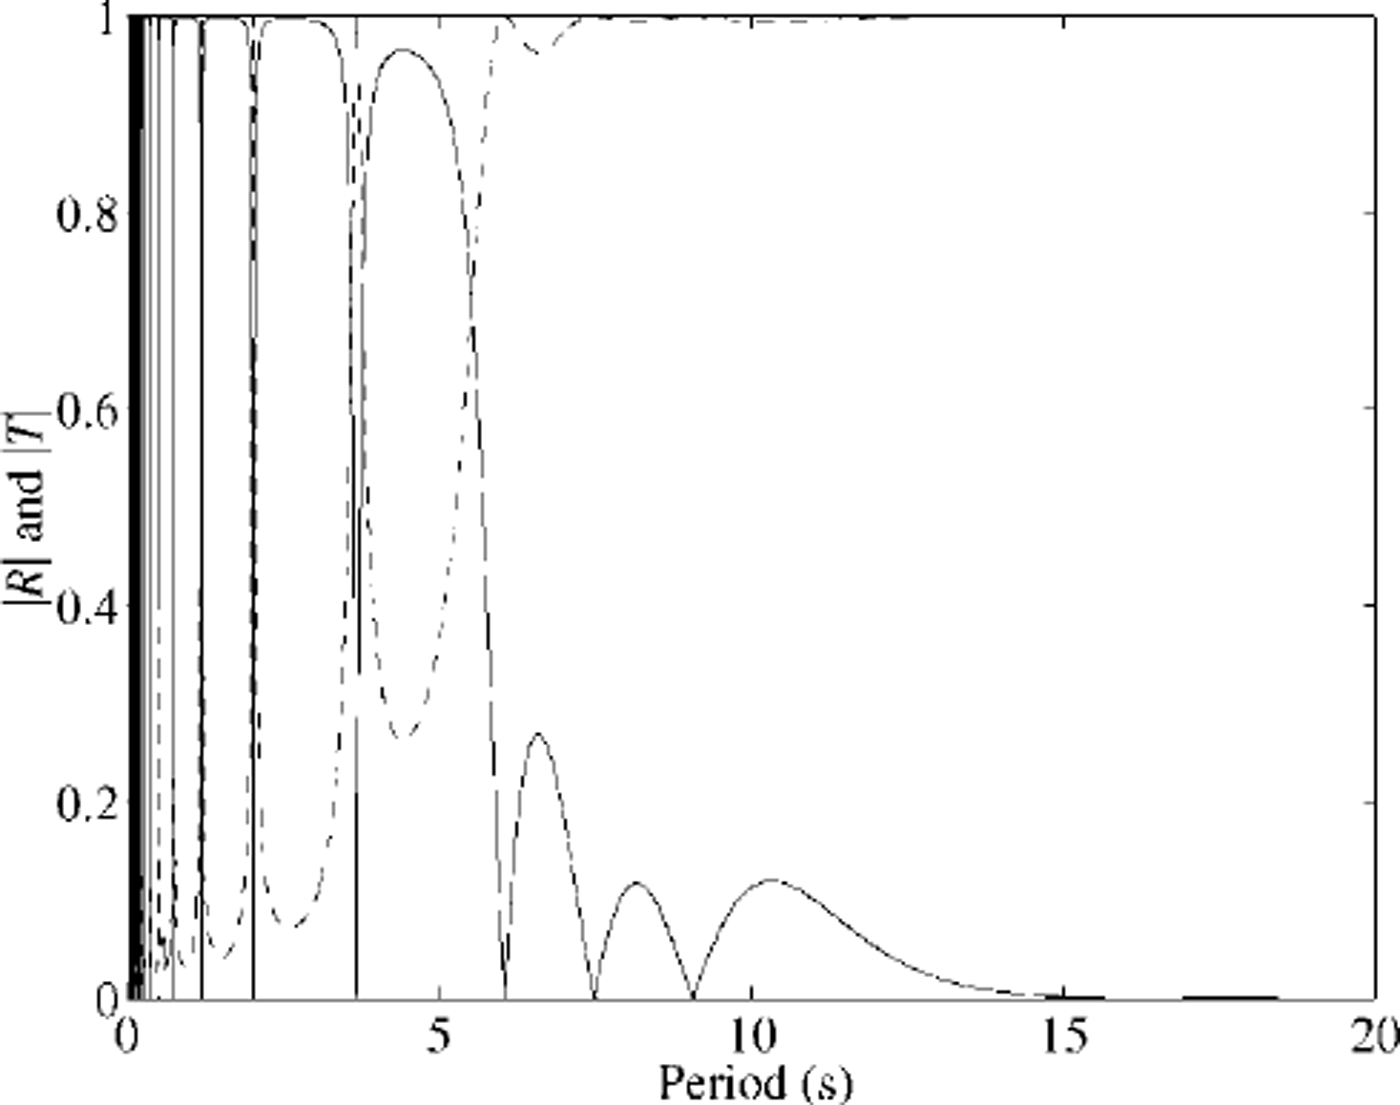
The same curves for two cracks are shown in Figure 3, this time only for one ice thickness h=1 m. While the generic low-pass filter effect of the feature is the same as for the single crack, a great deal more fine structure is evident in the form of zeros in the |R| curve. This is because the crack separation presents a new length scale to the waves, with which some interaction occurs at certain wavelengths. As period decreases-with a concomitant decrease in the wavelength-the zeros move together until for very short waves the comb of points at which transmission is perfect becomes very fine. Note again that the model becomes invalid as period → 0 , however.
Magnitude of the reflection (solid) and transmission (dashed) coefficients due to two open cracks separated by 100 mfor an ice thickness of 1.0 m.
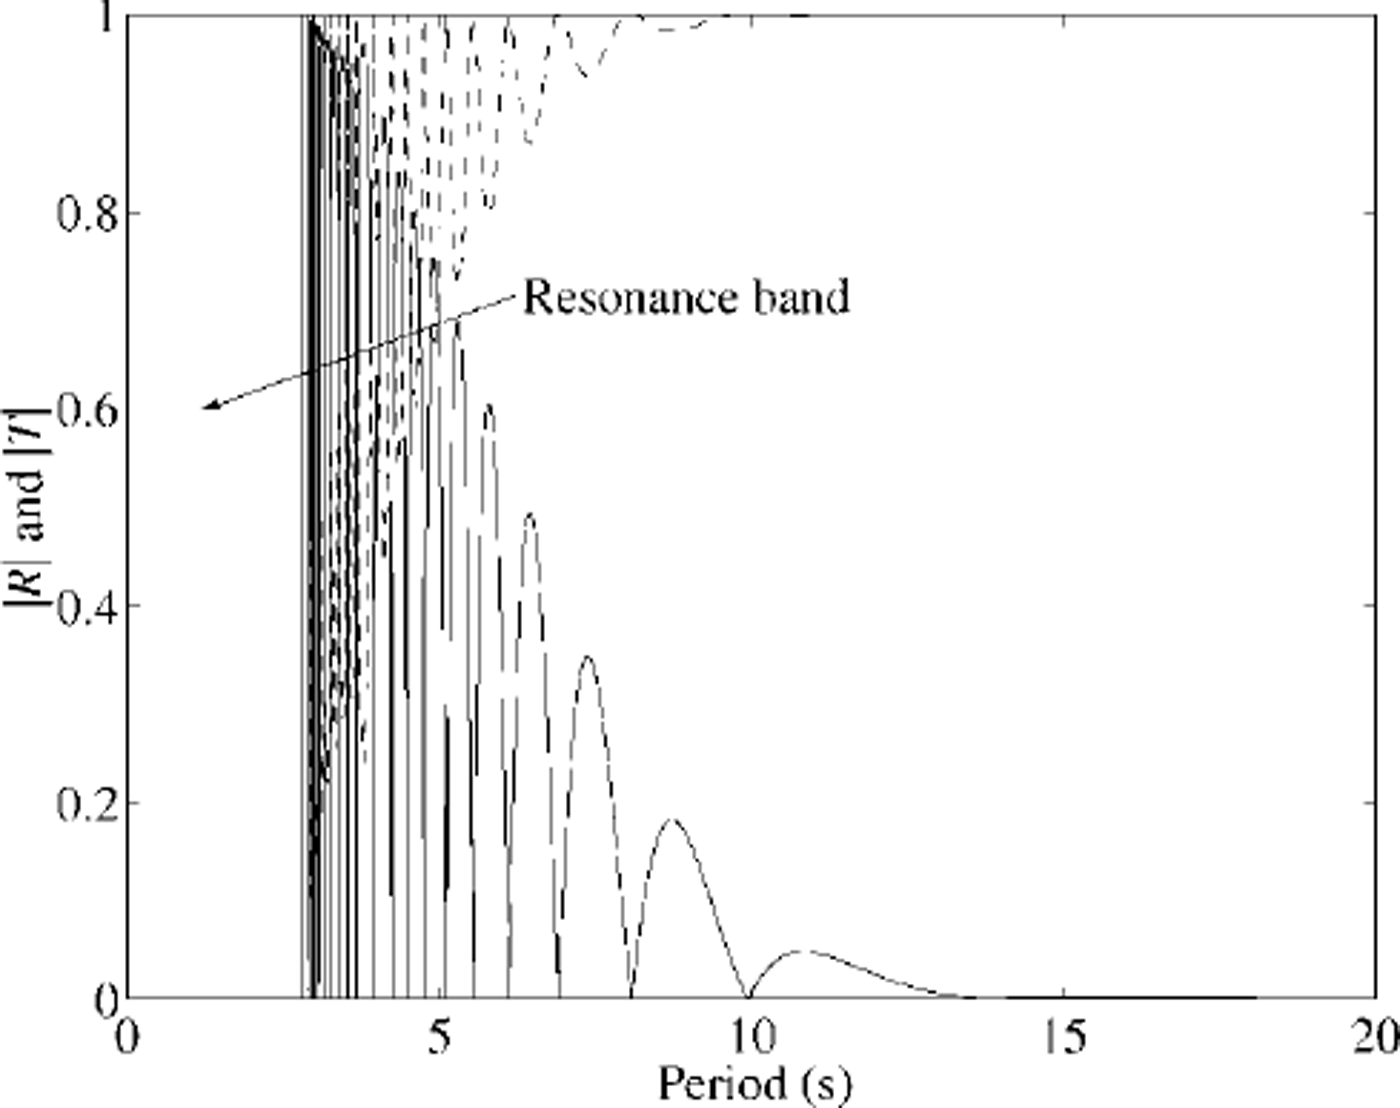
The situation for 11 cracks, located at 0,10, 20, 30, 40, 50, 60, 70, 80, 90 and 100 m, is analogous to the two-crack case. The feature still low-pass filters the incoming wave train, but in this case resonances arising due to interactions between the wavelength and the distance between cracks are extreme. Indeed, resonances are so frequent at low periods where, because the wavelength is small, many cycles can fit between cracks and the several cracks interact, that a resonance band is defined where zeros in |R| occur too frequently to be plotted. This is shown in Figure 4.
Magnitude of the reflection (solid) and transmission (dashed) coefficients due to eleven equally spaced open cracks located within 100 m of ice of thickness 1.0 m.
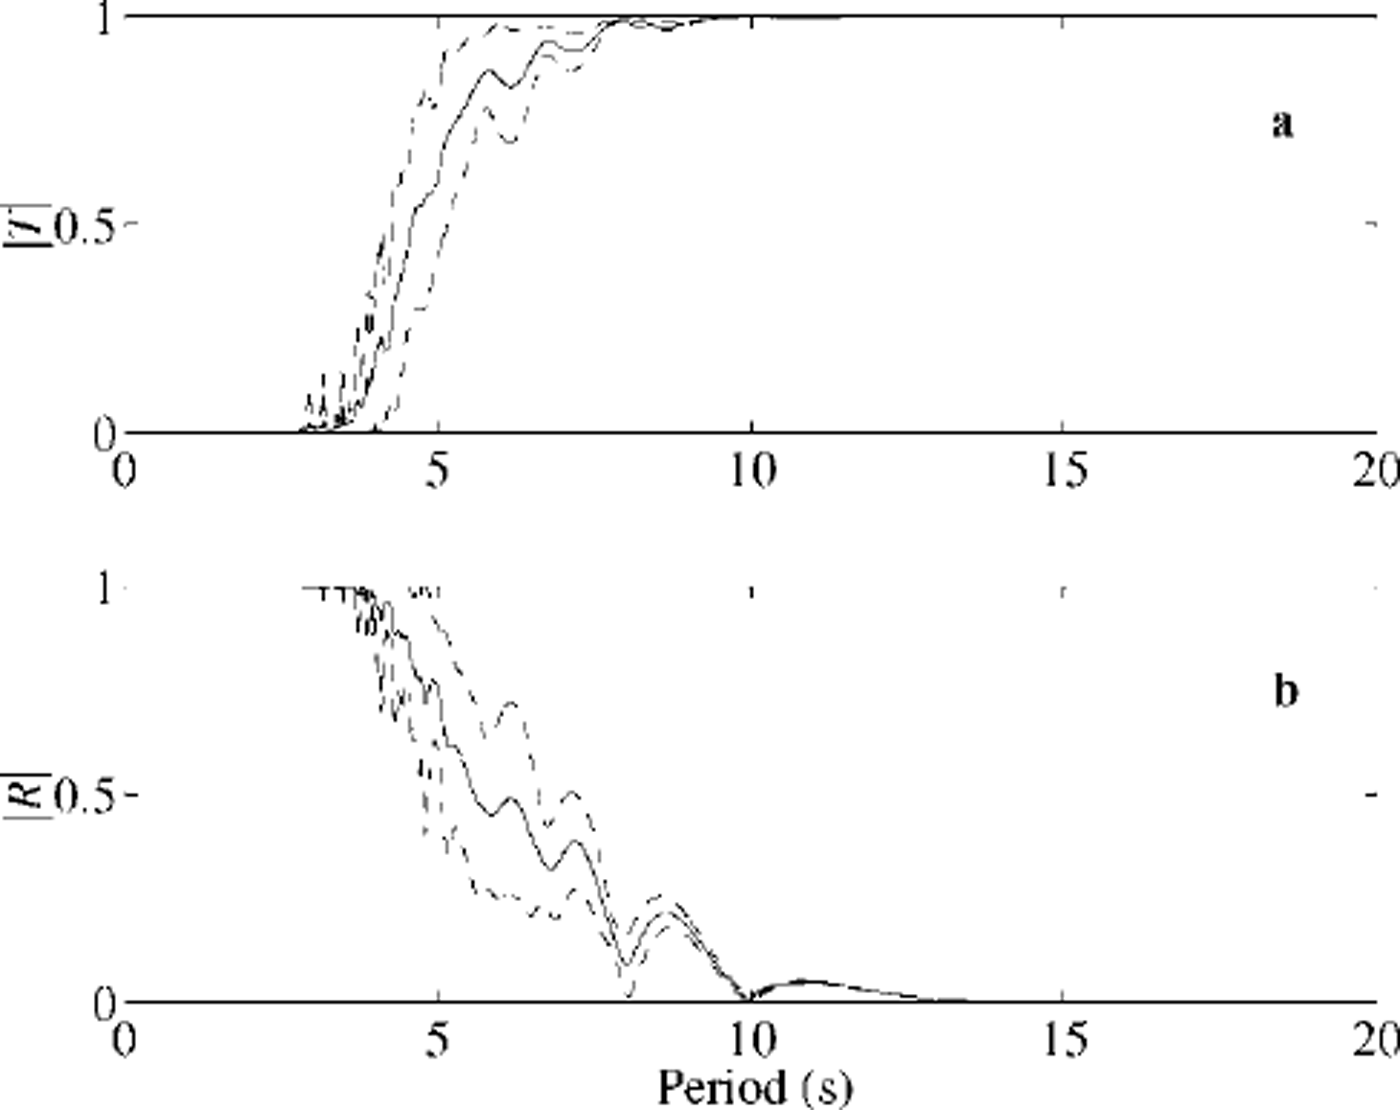
In real ice, cracks are unlikely to be located at precisely the same separation; instead they will be randomly located. This is investigated in Figure 5, where five cracks at locations drawn from a uniform distribution are positioned randomly over 100 m of sea ice. This scenario is computed many times (35) and the average curve is then found and plotted with 1 standard deviation either side. Notice in Figure 5 that the fine structure in the curve at relatively long periods remains almost untouched by the averaging process where the standard deviation is quite small, whereas at shorter periods it is smeared out with an associated increase in standard deviation. For a region of ice composed of many randomly placed cracks, this suggests that sea ice may still appear transparent to the incoming wave train at a few wave periods, but that the dense-resonance comb will not eventuate because coupling between crack separation and wavelength is reduced by the randomness. Accordingly, the most important effect of multiple, randomly placed cracks is likely to be their low-pass filter action.
Magnitude of the transmission coefficient (a) and reflection coefficient (b)due to five randomly spaced open cracks located within 100 m of ice of thickness 1.0 m. one standard deviation about the curve is also plotted in each case.
Conclusions
The aggregation of the several mechanisms that cause high frequencies to be removed from an incoming sea, namely, reflection at the edge, viscous damping in the water, ice viscosity and now sets of cracks, all act to create a local ice-coupled wave spectrum that is significantly biased towards long period waves. The dispersion of such waves is indistinguishable from that in the open sea unless the sea ice is unphysically thick. Accordingly, it is improbable that waves travelling through the Arctic basin can be used as a remote-sensing agent to determine mean ice thickness.
While the resonances reported in the results section are mathematically interesting, they are less important than the overall low-pass filter effect. We have seen that sets of periodic, as opposed to randomly spaced, cracks are more likely to lead to perfect transmission at some frequencies. Resonance would also be less likely to occur in a fully three-dimensional model, where the notion of characteristic impedance no longer holds true.
Acknowledgements
This work was supported by a Marsden Grant administered by the Royal Society of New Zealand and by the NZ Public Good Science Fund. We thank P. Fenton for his help.



