The relationship between lifestyle factors and endocrine function, particularly thyroid function, has attracted increasing attention due to the rising global prevalence of thyroid disorders and lifestyle-related diseases(Reference Huang, Cai and Zheng1,Reference Maleki, Faghfouri and Tabrizi2) . Thyroid hormones, primarily thyroxine (T4) and triiodothyronine (T3), are critical for regulating metabolic processes, growth and development. Disruptions in thyroid function are known to impact metabolic health, cardiovascular function and overall well-being(Reference Yamakawa, Kato and Noh3,Reference Zarrin, Bagheri and Mehdizadeh4) . Several studies utilising data from the National Health and Nutrition Examination Survey (NHANES) have examined the prevalence and trends of thyroid disease among USA adults. A study analysing NHANES data from 1999 to 2018 found that the age-standardised prevalence of thyroid disease increased from 5·05 % in 2015–2018, up from 4·55 % in 1999–2002. Factors such as age, sex, ethnicity, BMI, education and income were independently associated with increased risks of thyroid disease(Reference Zhang, Wang and Hu5). Another NHANES-based study from 1988 to 2012 reported that 80 % of individuals with thyroid dysfunction were previously undiagnosed(Reference Yamakawa, Kato and Noh3).
The healthy lifestyle score (HLS) is a composite measure that quantifies adherence to multiple health-promoting behaviours. Typically, it encompasses factors such as non-smoking status, moderate alcohol consumption, regular physical activity, healthy dietary patterns and optimal body weight. Each component is scored, and the aggregate reflects the overall lifestyle quality, with higher scores indicating healthier behaviours(Reference Farhadnejad, Teymoori and Asghari6). HLS has been utilised in various studies to assess its association with chronic diseases, including cardiovascular conditions(Reference Guasch-Ferré, Li and Bhupathiraju7) and metabolic disorders(Reference Jowshan, Pourjavid and Amirkhizi8). However, its relationship with thyroid function remains underexplored, warranting further investigation.
A NHANES study reported that higher levels of physical activity are negatively associated with thyroid hormone levels(Reference Klasson, Sadhir and Pontzer9). Smoking has been found to lower serum T4 and T3 levels, potentially through the inhibition of iodine uptake and thyroid hormone synthesis(Reference Soldin, Goughenour and Gilbert10). Similarly, excessive alcohol consumption has been associated with altered thyroid hormone levels, likely due to liver dysfunction, which impairs the metabolism of thyroid hormones(Reference Papineni, Pinnelli and Davanum11). Similarly, better cardiovascular health, as measured by the Life’s Essential 8 score, correlates with a reduced prevalence of low thyroid function(Reference Fang, Hu and Fei12). Diet quality, assessed via the Healthy Eating Index, has also been inversely associated with total and free triiodothyronine (FT3) levels(Reference Chen and Han13). Additionally, studies have explored the relationship between oxidative balance and thyroid function, indicating potential links between oxidative stress and thyroid hormone levels(Reference Xiao, Zhang and Ji14,Reference Faghfouri, Zarrin and Maleki15) .
Critically, the collective effect of an overall healthy lifestyle on thyroid homeostasis has not been directly studied, representing a critical gap in current research. While many component associations (e.g. smoking, diet, activity) have been reported, a summary HLS may capture synergistic interactions among behaviours and better reflect real-world lifestyle patterns(Reference Vajdi, Karimi and Farhangi16,Reference Jahromi, Daftari and Farhadnejad17) . In short, using a composite score can test whether a multidimensional healthy lifestyle exerts a coordinated effect on thyroid physiology above and beyond individual factors. This study aimed to investigate how HLS was associated with thyroid function markers, as marked by thyroid-related hormones, while accounting for demographic and socioeconomic factors.
Methods
Study design and population
This cross-sectional analysis utilised data from the NHANES cycles 2007–2008, 2009–2010 and 2011–2012. NHANES is a nationally representative survey of the USA civilian noninstitutionalised population conducted by the National Center for Health Statistics, employing a complex, multistage probability sampling design (https://wwwn.cdc.gov/nchs/nhanes). All participants provided informed consent, and the survey protocol was approved by the National Center for Health Statistics Research Ethics Review Board. In addition, written informed consent was obtained from all participants before their enrolment in the study(Reference Terry, Chiappa and McAllister18).
Adults aged ≥ 18 years with available data on thyroid function biomarkers and lifestyle variables were included in the present analysis. Pregnant women, individuals with known thyroid diseases and participants with missing or implausible data on covariates or exposures of interest were excluded (Figure 1).
Flowchart of study.

Assessment of Healthy Lifestyle Score
The HLS was constructed by summing six modifiable lifestyle factors(Reference Zhang, Chen and Pan19), with each factor assigned a score of 1 for healthy behaviour and 0 for unhealthy behaviour, resulting in a total HLS ranging from 0 to 6. In details, never smokers were assigned 1 point and former or current smokers received 0 (Former smokers were included with current smokers because previous evidence suggests that the metabolic and endocrine effects of smoking may persist even after cessation, potentially influencing thyroid function markers(Reference Asvold, Bjøro and Nilsen20)); for alcohol consumption, a score of 1 was assigned to no heavy drinking (men, < 28 g/d; women, < 14 g/d) and 0 otherwise; a BMI between 18·5 and 24·9 kg/m2 was considered healthy and scored 1 point; regarding physical activity, being in the upper tertile of total metabolic equivalent-minutes per week was scored as healthy (1 point); sleep duration of 7–9 h per night was considered optimal and given 1 point; and energy intake deemed ‘adequate’ based on age- and sex-specific estimated energy requirements was scored as 1 point. Participants were then categorised into three HLS groups: low (0–1), intermediate (2–3), and high (4–6)(Reference Xu, Huang and Wang21).
Thyroid function measures
Thyroid function biomarkers were measured using blood samples collected during the NHANES physical examination. The following markers were analysed: thyroid-stimulating hormone (TSH), free thyroxine (FT4), total thyroxine (TT4), FT3, total triiodothyronine (TT3), thyroglobulin (Tg), thyroid peroxidase antibody (TPOAb) and thyroglobulin antibody (TgAb). These biomarkers were selected because they are the main indicators of thyroid function and autoimmunity, and they are available in the NHANES laboratory dataset. TSH and FT4 were considered our primary endpoints given their central role in diagnosing overt and subclinical thyroid dysfunction. TT4, FT3 and TT3 were included to capture additional variation in hormone metabolism, while Tg and autoantibodies (TPOAb, TgAb) were measured to assess thyroid activity and autoimmunity(Reference Biondi and Cooper22–Reference Wu, Shi and Tang25).
These biomarkers were assessed using the Access 2 immunoassay system (Beckman Coulter), with all reagents provided by the manufacturer. Data collection spanned from 2007 to 2012. Participants were required to fast for at least 9 h prior to their morning blood draw, which was scheduled within four hours of waking. Blood samples were collected, processed for long-term storage and shipped weekly to a central laboratory for analysis. TSH concentrations were measured using a third-generation two-site sandwich immunoassay (reference range: 0·34–5·6 IU/ml). FT3 levels were analysed via a competitive binding immunoassay (2·5–3·9 pg/ml), while FT4 was assessed using a two-step enzyme immunoassay (0·6–1·6 ng/dl). TT3 and TT4 were measured using competitive binding immunoenzymatic assays, with respective reference intervals of 80–220 ng/dl and 5·0–12·0 μg/dl. TPOAb and TgAb levels were determined using a two-step sandwich immunoassay, with normal ranges of 0–9·0 IU/ml and 0–4.0 IU/ml, respectively. Tg was quantified through a one-step simultaneous sandwich assay (Access Tg assay). All procedures for specimen handling and laboratory analysis were conducted according to the standardised protocols described in the NHANES Laboratory/Medical Technologist Procedures Manual.
Covariates
Demographic and socioeconomic variables included age (continuous), gender (male/female), race/ethnicity (Non-Hispanic White, Non-Hispanic Black, Other), marital status (married/living with partner v. single) and poverty income ratio (categorised as ≤ 1·85 or > 1·85). Additional covariates included total energy intake (categorised as insufficient, adequate or excess) and physical activity level based on metabolic equivalent tertiles. These covariates were selected based on prior literature(Reference Wang, Lu and Zheng26).
Statistical analysis
All statistical analyses accounted for the NHANES complex sampling design using appropriate sample weights, clustering and stratification. Descriptive statistics were used to characterise the study population across HLS categories. Continuous variables were expressed as means and sd, and categorical variables as frequencies and weighted percentages. Group comparisons were made using survey-weighted linear regression (for continuous outcomes) or χ 2 tests (for categorical variables). Multivariable linear regression models were constructed to examine the associations between HLS (as both a continuous and categorical variable) and thyroid hormone levels. Two models were specified: model 1 was adjusted for age and gender, as these are well-established determinants of thyroid function, and model 2 was fully adjusted for age, gender, race/ethnicity, marital status and poverty income ratio, selected based on prior literature showing their potential influence on both lifestyle behaviours and thyroid function(Reference Wang, Lu and Zheng26,Reference Wang, Lu and Zheng27) . Subgroup analyses were performed to explore potential effect modification by age group (< 40 v. ≥ 40 years), gender, race/ethnicity and income level. These characteristics may influence both lifestyle behaviours and thyroid function(Reference Lawton, Sabatini and Hochbaum28). Interaction terms were included in the regression models, and significance was assessed using Wald tests. To account for multiple testing across the eight thyroid biomarkers, we additionally applied the Benjamini–Hochberg false discovery rate procedure. All P-values < 0·05 were considered statistically significant. Analyses were conducted using SPSS software (V25; SPSS Inc.).
Results
Characteristics of subjects
A total of 5693 adults from the NHANES 2007–2012 cycles were included in the present analysis. Table 1 describes the characteristics of participants grouped according to HLS categories. Of these participants, 3180 (54·2 %) were male and 2713 (45·8 %) were female, and the mean (sd) age of these subjects was 46·8 (18·5) years. Individuals in the highest HLS category were more likely to be physically active, have a healthy BMI, consume an adequate amount of energy, be non-smokers and report moderate alcohol intake (P < 0·05). The mean serum concentrations of FT4 decreased from 0·84 ng/dl in the lowest HLS group (scores 0–1) to 0·78 ng/dl in the highest HLS group (scores 4–6), and TT4 decreased from 7·45 µg/dl to 7·04 µg/dl across the same groups. No statistically significant differences were noted for serum TSH, FT3, TT3, TPOAb, TgAb or Tg levels. Thyroid marker levels varied modestly across individual components of the HLS (online Supplementary Table S1). Significant differences were observed for FT4 and TT4 by BMI, with lower levels among overweight participants (P < 0·001), and by smoking status (FT4 P = 0·02; TT4 P = 0·01).
Characteristics of the study population according to healthy lifestyle score, NHANES (2007–2012)

Table 1 Long description
A table comparing characteristics of the study population according to healthy lifestyle score. The table has 27 rows and 18 columns. Column headers include Characteristics, Total, 0-1 (n 1694), 2-3 (n 3209), and 4-6 (n 790), with sub-columns for Mean, SD, Mean, SD, Mean, SD, Mean, and SD. Row labels include TSH (mIU/l), FT3 (pg/ml), FT4 (ng/dl), TT3 (ng/dl), TT4 (µg/dl), TPOAb (IU/ml), TgAb (IU/ml), Tg (ng/ml), Age (years), Sex, n (%), PIR, n (%), Ethnicity, n (%), Marital status, n (%), Energy intake level, n (%), Physical activity level, n (%), BMI status, n (%), Smoking, n (%), Drinking Status, n (%), and Sleeping status, n (%). Each row provides mean and standard deviation values for each healthy lifestyle score category and percentages for categorical variables. Notable trends include variations in physical activity levels, BMI status, smoking status, and drinking status across different healthy lifestyle scores.
Descriptive data were shown as mean (sd) while categorical variables were reported as n (%). P-values less than 0·05 (P < 0·05) were considered significant. Abbreviations: FT3, free triiodothyronine; FT4, free thyroxine; TSH, thyroid-stimulating hormone; TT3, total T3; TT4, total T4; Tg, thyroglobulin; TPOAb, thyroid peroxidase antibody; n, Number; PIR, poverty income ratio; NHANES: National Health and Nutrition Examination Survey; TgAb, Thyroglobulin antibody; MET, Metabolic equivalent.
Associations between healthy lifestyle score and thyroid function
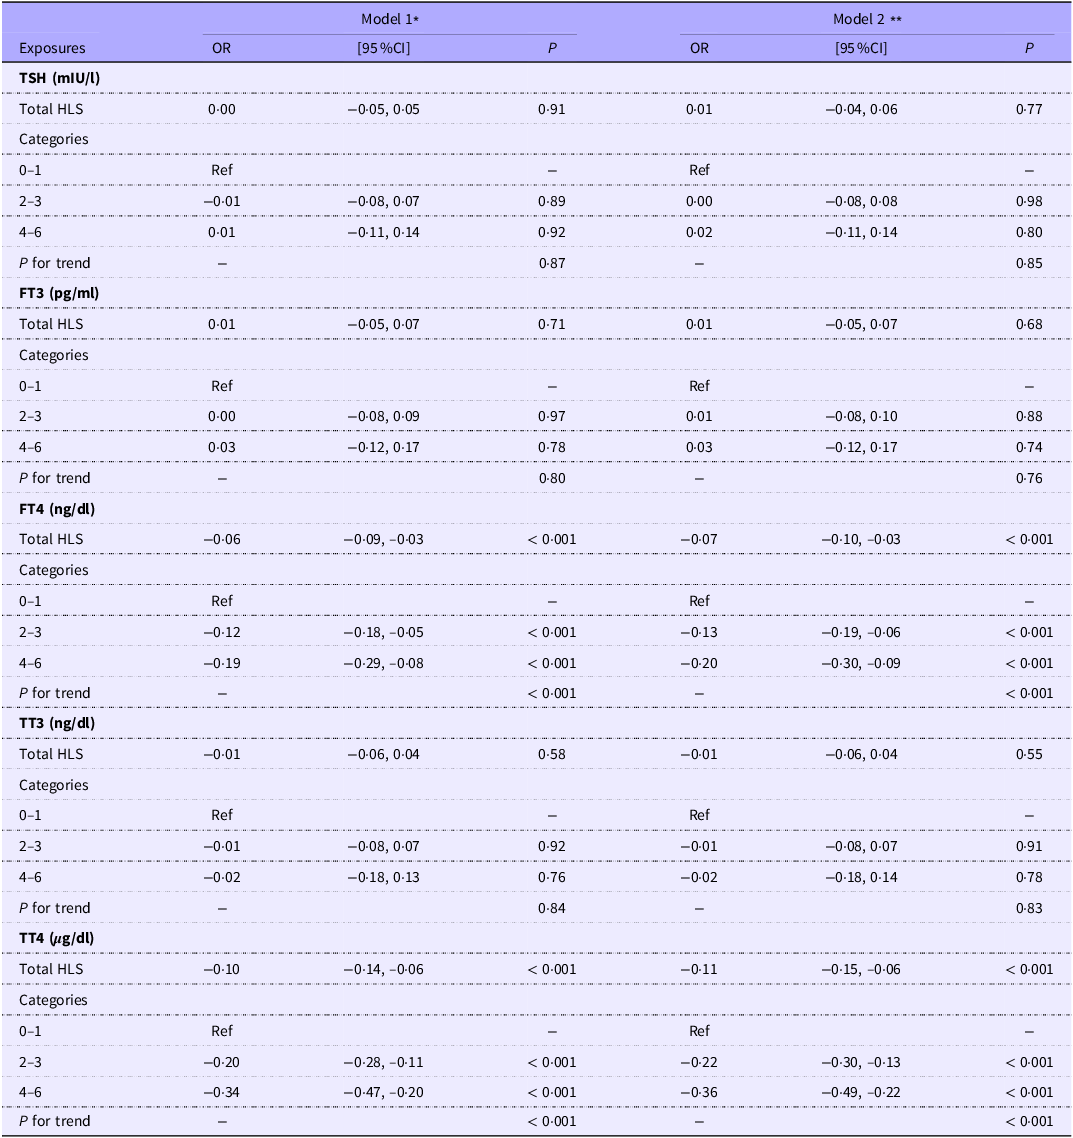
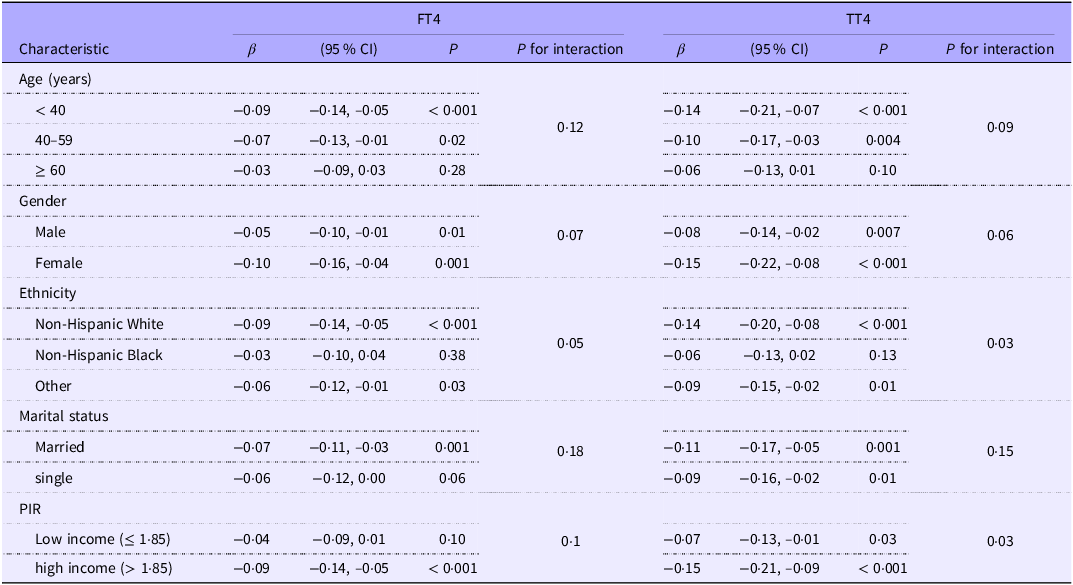
Multivariable linear regression models (Table 2) demonstrated consistent inverse associations between HLS and both FT4 and TT4 levels. In the fully adjusted model (Model 2), which accounted for age, gender, race/ethnicity, marital status and income, each one-point increase in HLS was associated with a –0·07 ng/dl change in FT4 (95 % CI: –0·10, –0·03; P < 0·001) and a –0·11 µg/dl change in TT4 (95 % CI: –0·15, –0·06; P < 0·001). Compared with individuals with an HLS of 0–1, those with an HLS of 4–6 exhibited significantly lower levels of FT4 (β = –0·20; 95 % CI: –0·30, –0·09; P < 0·001) and TT4 (β = –0·36; 95 % CI: –0·49, –0·22; P < 0·001). After applying the false discovery rate correction for multiple comparisons, the associations between HLS and FT4/TT4 remained statistically significant, whereas the associations with other thyroid biomarkers were attenuated and did not survive correction. Subgroup analyses (Table 3) indicated that the inverse associations between HLS and FT4/TT4 were generally consistent across demographic strata, although interactions by age, gender, ethnicity and income were observed. The association was strongest among younger adults (< 40 years), with an FT4 β of –0·09 (95 % CI: –0·14, –0·05; P < 0·001) and TT4 β of –0·14 (95 % CI: –0·21, –0·07; P < 0·001), and diminished with advancing age (P for interaction = 0·12 for FT4 and 0·09 for TT4). Gender-stratified models revealed stronger associations among females (FT4 β = –0·10; P = 0·001 and TT4 β = –0·15; P < 0·001) than males. Inverse associations were revealed among non-Hispanic Whites (FT4 β = –0·09; P < 0·001 and TT4 β = –0·14; P < 0·001) and individuals of other ethnic backgrounds (FT4 β = –0·06; P = 0·03 and TT4 β = –0·09; P = 0·01), but not among non-Hispanic Black participants. Significant interaction terms were observed for ethnicity (P = 0·03 for FT4 and 0·02 for TT4). The associations were also more pronounced among individuals with higher income (poverty income ratio > 1·85) compared with those with lower income, with P–values for interaction of 0·10 for FT4 and 0·03 for TT4.
Association between the healthy lifestyle score and thyroid function based on weighted logistic regression analysis

Table 2 Long description
The table presents the results of multivariable linear regression models analyzing the association between healthy lifestyle score (HLS) and various thyroid function biomarkers. The table has 20 rows and 10 columns. The columns are labeled as Exposures, OR, 95% CI, P, OR, 95% CI, and P for Model 1 and Model 2 respectively. The rows are labeled with different thyroid biomarkers: TSH (mIU/l), FT3 (pg/ml), FT4 (ng/dl), TT3 (ng/dl), and TT4 (µg/dl). Each biomarker section includes Total HLS and Categories (0-1, 2-3, 4-6) with corresponding OR, 95% CI, and P values for both models. Notable trends include significant inverse associations between HLS and FT4 and TT4 levels, with P values less than 0.001. The associations with other thyroid biomarkers are not statistically significant after correction for multiple comparisons.
*Model 1 no adjusted. **Model 2 adjusts for age, sex, race/ethnicity, poverty-to-income ratio and marital status. P-values are presented before multiple-comparison adjustment. After applying the Benjamini–Hochberg false discovery rate (FDR) procedure across the eight thyroid biomarkers, associations with FT4 and TT4 remained statistically significant, whereas associations with other biomarkers did not survive correction. Abbreviations: HLS, Healthy lifestyle score; FT3, free triiodothyronine; FT4, free thyroxine; TSH, thyroid-stimulating hormone; TT3, total triiodothyronine; TT4, total thyroxine.
Association of FT4 and TT4 with healthy lifestyle score across subgroups

Table 3 Long description
The table presents data on the association of FT4 and TT4 with healthy lifestyle score across various subgroups. It has 4 rows and 10 columns. The columns are labeled as Characteristic, Beta (β), 95% CI, P, P for interaction for FT4, Beta (β), 95% CI, P, and P for interaction for TT4. The rows are labeled with different characteristics such as Age (years), Gender, Ethnicity, Marital status, and PIR. Each row provides specific values for Beta (β), 95% CI, P, and P for interaction for both FT4 and TT4. The table shows detailed statistical data for each subgroup, indicating the strength and significance of the associations.
Each subgroup adjusted for age + sex + ethnicity + marital status + poverty income ratio. The strata variable was not included when stratifying by itself. Abbreviations: PIR, poverty income ratio; FT4, free thyroxine; TT4, total T4.
Discussion
This study, analysing data from 5693 adults in the NHANES 2007–2012 cycles, explored the relationship between a HLS and thyroid function. The HLS included six modifiable factors including physical activity, BMI, smoking status, alcohol consumption, sleep duration and energy intake, reflecting overall key aspects of a healthy lifestyle. Participants with higher HLS were more physically active, had healthier BMI levels, consumed adequate energy, were non-smokers and reported moderate alcohol consumption. Notably, higher HLS was associated with lower serum concentrations of FT4 and TT4, while no significant differences were observed for other thyroid parameters like TSH, FT3, TT3, TPOAb, TgAb or Tg levels. Multivariable linear regression models confirmed consistent inverse associations between HLS and both FT4 and TT4 levels, even after adjusting for potential confounders. Subgroup analyses indicated that these associations were more pronounced among younger adults, females, non-Hispanic Whites and individuals with higher income. Although many studies have linked individual lifestyle behaviours (e.g. smoking, diet, physical activity) to thyroid and metabolic health, a composite HLS can capture the synergistic interactions among behaviours and better reflect real-world lifestyle patterns(Reference Pan, Li and Franco29–Reference Ding, Fu and Yuan31). As our knowledge, this is the first study investigating how HLS was associated with thyroid function markers.
One possible explanation for the null findings is physiological buffering and homeostasis of the thyroid axis. In practical terms, participants with healthy BMI and activity likely had reduced FT4/TT4(Reference Yang, Liao and Zhou32,Reference Tian, Lu and Teng33) , while TSH and FT3 remained unchanged due to homeostatic feedback and minimal impact on peripheral T3 conversion. In a general euthyroid population, small lifestyle-related shifts in T4 may not be large enough to significantly alter TSH (which is tightly regulated) or autoantibody levels. Indeed, thyroid autoantibodies reflect autoimmune disease processes and are usually stable in healthy people; we would not expect routine diet/exercise changes to modify TPOAb or TgAb in the short term.
The observed differences in associations across demographic groups likely reflect known variations in thyroid physiology by age, sex, ethnicity and socioeconomic status. Studies show that TSH rises with age while FT4 remains stable in healthy elders(Reference Walsh34). In other words, older adults tend to have higher TSH set-points and less variable thyroid output. We found stronger inverse HLS associations in females. Female hormones, higher body fat percentage and autoimmune susceptibility likely amplify any lifestyle impact on thyroid hormones(Reference Adamska, Popławska-Kita and Siewko35,Reference Ren and Zhu36) . Ethnic differences in thyroid physiology are well-documented. The NHANES III analysis by Boucai et al. found that Blacks have lower population TSH percentiles than Whites or Mexican Americans(Reference Boucai, Hollowell and Surks37). In practical terms, Black Americans often have a different TSH/thyroid hormone setpoint and lower thyroid autoantibody prevalence than Whites(Reference Chen, Zhang and Zhang38). We noted that the inverse HLS–thyroid association was stronger at higher income levels (poverty income ratio > 1·85). Socioeconomic factors can influence nutrition, stress and healthcare access, all of which affect thyroid function. Notably, a recent NHANES-based analysis found that free T3 was inversely related to household income(Reference Lawton, Sabatini and Hochbaum28).
The observed inverse relationship between HLS and thyroid hormone levels aligns with findings from previous studies. For instance, research has demonstrated that higher oxidative balance scores, indicative of healthier lifestyles, are associated with lower FT4 and TT4 levels(Reference Song, Zhou and Yang39). Similarly, studies have reported negative associations between diet quality, as measured by the Healthy Eating Index, and thyroid hormones like FT3 and TT3(Reference Chen and Han13). A study investigating the dietary inflammatory index found that higher dietary inflammatory index scores, indicative of a more pro-inflammatory diet, were positively associated with TT4 and FT3 levels(Reference Wang, Lu and Zheng26). A study utilising NHANES 2007–2012 data found that higher scores on Life’s Essential 8 (a cardiovascular health metric) were associated with a lower prevalence of low thyroid function, suggesting a beneficial effect of healthy behaviours on thyroid health(Reference Fang, Hu and Fei12). These findings have indicated that healthier diets are linked to lower thyroid hormones. Among non-NHANES studies, a cross-sectional study involving 5154 individuals from the She ethnic minority in Fujian Province examined lifestyle factors and thyroid dysfunction. They found that alcohol consumption was associated with a decreased risk of both hyperthyroidism and hypothyroidism. Smoking showed a complex relationship: while it was linked to a reduced risk of hypothyroidism, increased cigarette consumption correlated with a higher incidence of hyperthyroidism and regular exercise and weight management were associated with a lower prevalence of hypothyroidism(Reference Huang, Cai and Zheng1). These findings highlight the nuanced relationships between lifestyle behaviours and thyroid health, emphasising the need for culturally and regionally specific research.
Regular physical activity can influence thyroid hormone metabolism. Exercise may enhance the peripheral conversion of T4 to the more active T3, potentially leading to lower circulating T4 levels while maintaining or increasing T3 levels(Reference Opstad, Falch and Oktedalen40). This adaptation supports increased metabolic demands during physical exertion. However, the exact impact of exercise on thyroid function can vary based on the intensity and duration of activity, as well as individual health status. BMI is closely linked to thyroid function(Reference Shulhai, Rotondo and Petraroli41). Obesity is associated with alterations in thyroid hormone levels, often characterised by elevated TSH and T3 levels. Adipose tissue secretes leptin, which can influence the hypothalamic-pituitary-thyroid axis by promoting the expression of thyrotropin-releasing hormone, thereby affecting TSH secretion. Additionally, leptin may modulate deiodinase activity, impacting the conversion of T4 to T3(Reference Fu, Zhang and An42). Weight loss in obese individuals has been shown to normalise these hormonal changes, suggesting a reversible relationship between BMI and thyroid function(Reference Liu, Liang and Bray43). Dietary intake of iodine, selenium and other micronutrients plays a crucial role in thyroid health. While some studies emphasise the importance of these nutrients, others have found that excessive intake, particularly of iodine, can lead to thyroid dysfunction(Reference Triggiani, Tafaro and Giagulli44). Smoking has complex effects on thyroid function. Smokers often exhibit lower TSH levels, possibly due to nicotine-induced sympathetic stimulation(Reference Gruppen, Kootstra-Ros and Kobold45). Smoking is associated with a reduced risk of Hashimoto’s thyroiditis but an increased risk of Graves’ disease and its ophthalmic manifestations(Reference Krassas and Wiersinga46). Smoking can lead to an enlarged thyroid and increased nodularity, especially in iodine-deficient areas. These effects are thought to result from compounds in tobacco smoke, such as thiocyanate, which can interfere with iodine uptake and thyroid hormone synthesis(Reference Wiersinga47). Impact of alcohol on thyroid function varies with consumption levels. Moderate consumption may have a protective effect against certain thyroid disorders, including autoimmune diseases and thyroid cancer, while chronic heavy drinking is associated with suppressed thyroid function, including decreased T3 and T4 levels, and may lead to a condition resembling euthyroid sick syndrome(Reference Terracina, Caronti and Lucarelli48). The mechanisms include direct toxic effects on thyroid cells and alterations in the hypothalamic-pituitary-thyroid axis(Reference Balhara and Deb49).
The strengths of this study include its large, nationally representative sample and comprehensive assessment of lifestyle factors and thyroid function(Reference Chen and Han13). However, several limitations should be acknowledged. The cross-sectional design precludes causal inferences, and residual confounding cannot be entirely ruled out. Additionally, the reliance on self-reported lifestyle data may introduce measurement errors. The study also did not account for potential variations in iodine intake, which can significantly affect thyroid function. Moreover, the exclusion of individuals with known thyroid diseases may limit the generalisability of the findings to the broader population.
Future research should aim to elucidate the causal pathways linking lifestyle factors to thyroid function through longitudinal studies. Incorporating objective measures of lifestyle behaviours, such as accelerometry for physical activity and biomarkers for dietary intake, could enhance data accuracy. Investigating the role of iodine status and genetic factors in modulating the relationship between lifestyle and thyroid function would provide a more comprehensive understanding. Additionally, exploring the impact of lifestyle interventions on thyroid hormone levels in randomised controlled trials could inform public health strategies aimed at optimising thyroid health through lifestyle modifications.
Conclusion
This study found that a higher HLS was associated with lower FT4 and TT4 levels in USA adults, independent of confounders. Other thyroid parameters such as TSH, FT3, TT3 and thyroid antibodies showed no significant associations with HLS.
The inverse relationships were stronger in younger adults, females, non-Hispanic Whites and individuals with higher income. These findings suggest that overall healthy lifestyle behaviours may subtly influence thyroid hormone levels, particularly T4.
Supplementary material
For supplementary material/s referred to in this article, please visit https://doi.org/10.1017/S0007114526106382
Acknowledgements
None.
None.
No financial support.
X. Cheng and X. Chen: Conceptualisation, Data curation, Formal analysis, Writing – original draft. L. Y. and J. Y.: Writing – original draft. Y. Z.: Conceptualisation, Writing – review & editing, Methodology.
The authors declare that they have no competing interests.