




No CrossRef data available.
NONPARAMETRIC INFERENCE FOR UNBALANCED TIME SERIES DATA
Published online by Cambridge University Press: 08 February 2005
Abstract
This paper is concerned with the practical problem of conducting inference in a vector time series setting when the data are unbalanced or incomplete. In this case, one can work with only the common sample, to which a standard HAC/bootstrap theory applies, but at the expense of throwing away data and perhaps losing efficiency. An alternative is to use some sort of imputation method, but this requires additional modeling assumptions, which we would rather avoid. We show how the sampling theory changes and how to modify the resampling algorithms to accommodate the problem of missing data. We also discuss efficiency and power. Unbalanced data of the type we consider are quite common in financial panel data; see, for example, Connor and Korajczyk (1993, Journal of Finance 48, 1263–1291). These data also occur in cross-country studies.I thank Greg Connor, Esfandiar Maasoumi, Peter Phillips, Peter Robinson, Yoon Whang, and two referees for helpful comments.
Information
- Type
- Research Article
- Information
- Copyright
- © 2005 Cambridge University Press
1. INTRODUCTION
Estimation of heteroskedasticity and autocorrelation consistent covariance matrices (HACs) is a well established problem in time series. Results have been established under a variety of weak conditions on temporal dependence and heterogeneity that allow one to conduct inference on a variety of statistics; see Jowett (1955), Hannan (1957), Newey and West (1987), Andrews (1991), Hansen (1992), de Jong and Davidson (2000), and Robinson (2005). Alternative methods for conducting inference include the bootstrap, for which there is also now a very active research program in time series especially; see Lahiri (2003) for an overview. One convenient method for time series is the subsampling approach of Politis, Romano, and Wolf (1999). This method was used by Linton, Maasoumi, and Whang (2003) in the context of testing for stochastic dominance.
This paper is concerned with the practical problem of conducting inference in a vector time series setting when the data are unbalanced or incomplete. In this case, one can work with only the common sample, to which a standard HAC/bootstrap theory applies, but at the expense of throwing away data and perhaps losing efficiency. An alternative is to use some sort of imputation method to complete the data set, but this requires additional modeling assumptions, which we would rather avoid.1
But if we did go down that path we would advocate a general to specific approach.
2. MODEL AND SETUP
The most general setting would be a multivariate data series {Xit,i ∈ Nt,t ∈ Ii} where the set Nt contains the number of cross-sectional units at time t and Ii contains the number of time series observations for unit i. We are primarily concerned with the case where Ii ∩ Ij ≠ [empty ] (although in a multivariate setting you could have Ii ∩ Ij = [empty ] for some pairs but not for all pairs and still obtain the main results we find subsequently). The set Ii[setmn ]Ii ∩ Ij could in general contain just contiguous observations, or it could contain several isolated sets before and after Ii ∩ Ij. The setup costs in establishing notation for the most general case are quite high, and so we have chosen to concentrate on the bivariate special case with staggered samples so that Ii[setmn ]Ii ∩ Ij, say, is a series of contiguous observations prior to Ii ∩ Ij, whereas Ij[setmn ]Ii ∩ Ij is a series of contiguous observations subsequent to Ii ∩ Ij. This captures the main issues we wish to concentrate on.
Suppose we have two samples denoted IX and IY on X and Y, respectively, with cardinalities TX and TY, where IX = {X1,…,XTX} and IY = {YTX+1,…,YTX+TY}. These observations can be partitioned into TXY common observations, denoted IXY = {(XTX+1,YTX+1),…,(XTX+TXY,YTX+TXY)}, TX separate observations on X, denoted IX = {X1,…,XTX}, and TY separate observations on Y, denoted IY = {YTX+TXY+1,…,YTX+TY}, so that TX = TX + TXY and TY = TY + TXY. There are a number of cases of interest with regard to the relative magnitudes of TX, TY, and TXY. We shall suppose that these quantities are all large.
ASSUMPTION A. TX = TX(N) → ∞,TY = TY(N) → ∞, and TXY = TXY(N) → ∞ as the magnitude parameter N → ∞. In the sequel all limits are taken as N → ∞.
The main case of interest theoretically is where TX, TY, and TXY are all of approximately the same size, but we shall allow other cases. The case where TXY is large relative to TX,TY is trivial, whereas the case where TX,TY are large relative to TXY can be viewed as a limiting version of the main case. Denote by

the dominant (i.e., smaller) magnitude; thus T = T(N) → ∞ under Assumption A.
We suppose that the data are temporally and cross-sectionally dependent but are stationary and mixing. We assume that the missing at random (MAR) condition of Little and Rubin (1987) holds; that is, the process by which the observations are missing is unrelated to the underlying data distribution.
We are concerned with testing hypotheses about the marginal distributions of Xt and Yt. There are two general types of hypotheses of interest.
Example 1
We want to test the hypothesis that

with alternative either one sided or two sided. This is a special case of the problem of testing whether f (mX) = f (mY), where mX,mY are vectors of moments (including quantiles) from the distributions X,Y, respectively, and f is a smooth function. A more general version of this would involve regression on a benchmark variable Zt. Thus suppose that Yt = βY[top ]Zt + uYt and Xt = βX[top ]Zt + uXt, where E(ut|Zt) = 0 with ut = (uYt,uXt)[top ], and we observe Yt,Xt as stated previously but Zt is observed throughout t = 1,…,TX + TY. We want to test whether f (βY) = f (βX) for some smooth function f. A leading example here would concern comparison of the alphas of two different funds (where these are computed relative to a benchmark fund Zt).
Example 2
We want to test the hypothesis that the distribution of Xt first-order dominates the distribution of Yt. Let FX,FY denote the cumulative distribution functions (c.d.f.s) of X and Y, respectively. The hypothesis can be stated as

with the alternative hypothesis that supz{FX(z) − FY(z)} > 0. More generally we can consider tests of higher order dominance.
In cases like Example 1, we can expect a normal distribution theory to apply under moment and mixing conditions, with the possibility of obtaining asymptotically pivotal test statistics, whereas in cases like Example 2 we expect a more complicated nonnormal distribution theory, with complicated dependence on nuisance parameters precluding asymptotically pivotal statistics.
In Example 1 a natural test statistic to use is

where

. Under a variety of additional conditions

under the null hypothesis, where

is a consistent estimate thereof; we discuss the computation of

subsequently. The test is based on comparing the studentized τ with standard normal critical values. An alternative test statistic would be based on only the common sample

, where XXY = (TXY)−1 [sum ]t∈IXY Xt and YXY = (TXY)−1 [sum ]t∈IXY Yt. In this case also

under the null, where

is a consistent estimate thereof. In some cases this test may be an attractive option, but when TX and/or TY is large, this approach, although convenient, may lose power.
In Example 2 a natural test statistic is

where

are the empirical distribution functions. In practice, the supremum in (2) is approximated by the maximum over a large grid. In this case, the limiting null distribution is ΔF = supz WF(z), where WF is a Gaussian process with covariance function depending on the joint distribution of X,Y and on the joint autodependence of these processes. The only feasible way of conducting inference here is to use some sort of bootstrap procedure. Linton et al. (2003) have proposed a subsampling algorithm for the statistic

, where

are the empirical distributions based on the common sample. Because δXY uses less data it might be expected to be less powerful than δ. We show subsequently how to modify the Linton et al. (2003) subsampling algorithm to obtain a consistent test based on δ.
3. INFERENCE
3.1. Estimation of Long-Run Variance
Here we show how to estimate σ2 and conduct the test based on a studentized version of τ. Let γX(j) and γY(j) be the marginal covariance functions of the processes X,Y, respectively, and let γXY(j) = cov(Xt,Yt−j). We use the symbol ≃ to denote asymptotic equivalence as N → ∞, that is, XN ≃ YN if XN /YN →p 1; in the matrix case this is interpreted element by element.
THEOREM 1. Suppose that (Xt,Yt) is jointly stationary with 1-summable covariance function, that is,

. Suppose that Assumption A holds. Then

This shows that the marginal variances are the usual terms proportional to the full marginal sample sizes, whereas the covariance is proportional to the common sample size TXY. The reason is basically because terms like

are asymptotically independent. The restriction

is only needed for the covariance term; if this condition does not hold, the asymptotic covariance term may be different.
A consequence of Theorem 1 is that

whereas

. When TX,TY,TXY are all of the same magnitude, all three terms in (5) remain in the limit; otherwise one or more of them may vanish asymptotically. To estimate these quantities we now apply the HAC theory. Specifically, we can estimate the long-run variances

by corresponding HAC estimators based, respectively, on the full sample of X′s, the full sample of Y′s, and the common sample IXY. For example, let

for j = 1,…,J(TX) and let

where k(.) is a weight function with support [−1,1] and J is a bandwidth parameter satisfying J → ∞ and J/TX → 0. See Andrews (1991) for methods and results on how to choose J and Xiao and Linton (2002) and Phillips (2005) for alternative strategies.
We now turn to the properties of the studentized tests

, where

are consistent estimates of ω,σ. Under local alternatives of the form

, we have

where

Clearly, when TXY/T → 0 the common sample test has no power against these alternatives and τ is preferable. However, the ranking could go the other way. Suppose that TX = TY = TXY, in which case T = TX /2 = TY /2 = TXY, so that πXY = λ/ω. We then have

, and it is possible that ω2 ≤ σ2, at least when

. For example, suppose that

; then ω2 − σ2 = ϑ(2 − 3ρ)/2, which can be negative for ρ > 2/3.
2The extreme case of i.i.d. data with perfect mutual correlation makes the intuition clear—in that case τXY is constant, whereas τ will have randomness due to the unmatched samples.
In conclusion, we have found that although X is always more efficient than XXY, the ranking of τXY,τ as test statistics could go either way—it depends on the relative sample sizes and on their mutual dependence. Subsequently we discuss further the issue of efficiency and local power.
3.2. Subsampling
In the second class of testing problems it is not possible to obtain a pivotal statistic by studentizing, and inference is usually based on some sort of resampling scheme. We concentrate on the subsampling method because it has certain advantages in Example 2; see Linton et al. (2003) for more discussion. The problem here is that just subsampling through the data as usual gives missing data or confines the researcher only to IXY, which would not adequately reflect the sampling error of τ or δ.
We propose a simple modification of the subsampling procedure suitable for the full data set and show that it works in our Example 2. Rewrite δ = g(IX,IXY,IY) for some function g. Define subsample sizes bX,bXY, and bY with bj → ∞ and bj/Tj → 0 for j = X,Y,XY. Then define subsamples IX,i,bX from IX with

likewise define subsamples IY,i,bY from IY

and define subsamples IXY,i,bXY from IXY

Then define the subsample statistic δT,b,i = g(IX,i,bX ,IXY,i,bXY ,IY,i,bY ) and likewise τT,b,i, specifically

Here, b(T) is chosen to satisfy (asymptotically)

For example, when TX = TY = 2TXY and bX = bY = bXY we can take b = bX.
We approximate the sampling distribution of δ (or τ) using the distribution of the values of δT,b,i (or τT,b,i) computed over the different subsamples. That is, we approximate the sampling distribution GT of δ by

where B(T) = min{TX − bX + 1,TY − bY + 1,TXY − bXY + 1} is the number of different feasible subsamples.
3A more general approach can be based on δT,b,i,i′,i′′ = f (IX,i,bX ,IXY,i′,bXY ,IY,i′′,bY ) and then taking the empirical distribution across all consistent {i,i′,i′′}.

, that is,

We call it the subsample critical value of significance level α. Thus, we reject the null hypothesis at the significance level α if τ > gT,b(1 − α).
Although this algorithm does not seem to replicate precisely the temporal ordering (for example, the sample IX,i,bX is separated temporally from IXY,i,bXY ) this does not matter for the first-order asymptotics because of the asymptotic independence argument.
THEOREM 2. Suppose that (Xt,Yt) is jointly stationary and alpha mixing random sequence with 1-summable mixing coefficients and suppose that under the null hypothesis (2) δ converges in distribution to the random variable ΔF whose (1 − α)th quantile is denoted by g(1 − α). Suppose that Assumption A holds. Then, under the null hypothesis (2),

4. EFFICIENT ESTIMATION AND TESTING
It is well known that the sample mean is an efficient estimate of a population mean when the data are independent and identically distributed (i.i.d.) (Bickel, Klaassen, Ritov, and Wellner, 1993, pp. 67–68) and in some time series cases (Grenander, 1954). Indeed, this is a case where “OLS = GLS”; see Amemiya (1985, pp. 182–183). We show that this does not hold in the unbalanced case and one can obtain a more efficient estimator than the sample mean. The more efficient estimator translates into a more powerful test. This result carries over to estimation of other quantities such as distribution functions. Bickel, Ritov, and Wellner (1991) treat a related problem of estimating E [a(Xt,Yt)] for known function a when the marginal distributions of X and of Y are known, which corresponds to the case where TX and TY are very large relative to TXY.
Define the vector of sample moments

The vector m contains unbiased estimators of the parameter vector θ = (μX,μY)[top ]. We consider estimators that minimize the minimum distance criterion (m − Aθ)[top ]Ψ(m − Aθ), where A is the 4 × 2 matrix of zeros and ones that takes (μX,μY)[top ] into (μX,μX,μY,μY)[top ], whereas Ψ is a symmetric positive definite weighting matrix. The resulting estimator has closed form

, that is, it is a linear combination of the elements of m.
4Suppose that TX = TY = TXY and that

. The estimator has the natural form


, where V is the asymptotic variance of m:

The optimal choice of Ψ is proportional to V−1, in which case

has asymptotic variance proportional to (A[top ]V−1A)−1.
5More formally, under additional conditions

, where


is more efficient than both θ and θXY. Whether the weak inequality is strict depends on the relative magnitudes of TX,TY,TXY. We conjecture that

is semiparametrically efficient for estimation of θ under some conditions. To support this conjecture we can show that

achieves the asymptotic Cramèr–Rao lower bound when the data are i.i.d. over time and Gaussian. A feasible version of

, which shares its limiting distribution, can be obtained from estimates of V, which can be obtained from the estimates of lrv(X), lrv(Y), and lrcov(X,Y) defined as in (6).
We illustrate these general results with an example. Suppose that TX = TY = TXY and that

. Then

For all

is positive definite, strictly so for ρ ≠ 0. For all ρ,

is positive definite, strictly so for ρ ≠ 1.
We now turn to the testing problem. Define

and let

be a consistent estimate of σE, which can be obtained from the estimates of V as already discussed. It follows that under local alternatives

,

where πE = λ/σE. Furthermore, |πE| ≥ max{|π|,|πXY|} so that

is the most powerful test in this class. Consider the special case that TX = TY = TXY,

. We have

For the range ρ ∈ [−1,0.5], πE2/π2 is quite modest; it lies in [1,1.12] , but as ρ → 1, πE2/π2 → ∞. On the other hand πE2/(πXY)2 = 2 − ρ ∈ [1,3].6
In this case we can write

which gives a nice interpretation—as ρ increases more weight is put on the common sample difference.
We briefly report the results of a simulation study that investigates τE,τ,τXY in the case where

with Xt* = φXt−1* + εt,Yt = φYt−1 + ηt, where (εt,ηt) are jointly standard normal with correlation ρ. In this case,

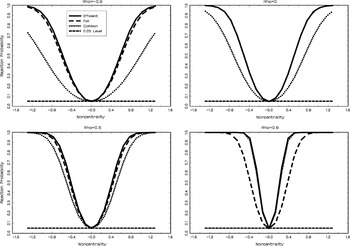
. We take TX = TY = TXY = 60 corresponding to 5 years of monthly data and φ = 0.5 throughout, while varying ρ ∈ {−0.9, 0, 0.5, 0.9}. The power curves for the 0.05 level two-sided tests are shown in Figure 1 calculated from 100,000 replications.

Power curves for the 0.05 level two-sided tests.
Throughout, the test based on τE has the higher power curve, but which test comes second changes according to the design: the common sample test does very poorly when ρ = −0.9, whereas the full sample test does very poorly when ρ = 0.9, as predicted by the theory. We acknowledge that the feasible version of τE can suffer from small sample effects that might diminish its edge, and we intend to investigate this in future work.
Finally, this estimation/testing strategy can also be applied to the c.d.f.s in Example 2. Specifically, define for each z the vector of sample moments

and define estimates

by the preceding minimum distance strategy. Then define

, which converges weakly under the null hypothesis to ΔFE = supz WFE(z), where WFE(·) is some Gaussian process. By construction

are more efficient than

, and it may be possible to show that tests based on δE are more powerful than those based on δ.
7Suppose it can be shown that WF(·) = WFE(·) + U(·), where U(·) is independent of WFE(·). If

were semiparametrically efficient, this structure would be expected by the Hajek–Le Cam convolution theorem (Bickel et al., 1993, p. 182). It follows that the critical value of the one-sided test based on

is smaller than that based on

(see Bickel et al., 1993, p. 194), and so the former test should be more powerful under local alternatives that shift the location of the limiting processes equally.
5. CONCLUDING REMARKS
We have shown how to modify inference procedures in some special unbalanced data cases. In particular, we showed how to conduct valid inference for the “natural” full sample test statistics τ,δ in our two examples. We also showed that these may not be the most powerful tests, and indeed there are situations where using only the common sample may be superior. We proposed more efficient tests that use all the data and require estimates of long-run variances to do the optimal weighting.
Our results can be generalized in a number of ways. First, in the multivariate case there is possibility for further efficiency/power improvements. Second, we can consider more general nonseparable hypotheses. For example, consider the hypothesis that E [a(Xt,Yt,…,Xt−p,Yt−p)] = 0 for some known function a and lag length p. This involves the joint distribution of (Xt,Yt,…,Xt−p,Yt−p), not just its marginals. Nevertheless, one can generally improve on the test statistic (TXY)−1 [sum ]t:t,…,t−p∈IXY a(Xt,Yt,…,Xt−p,Yt−p) using the minimum distance strategy discussed in Section 4 by taking appropriate choice of moments.
APPENDIX
Proof of Theorem 1. By standard arguments

It remains to calculate cov(X,Y). For notational brevity write xt = Xt − E(Xt) and yt = Yt − E(Yt). Then

We have

by dominated convergence using the fact that TXY ≤ min{TX,TY}. Define the integer sets

and let nu (nu′) denote the cardinality of Iu (Iu′), noting that nu,nu′ ≤ u for all u. Then

because

is bounded. Also,

by the same reasoning. Likewise IV = O(T−2). █
Proof of Theorem 2. The proof is based on showing that

satisfies a functional central limit theorem with limit WF(·). The main step is to show that U(z) has asymptotically the same variance as

, and this follows using the proof of Theorem 1, that is,

where γFX(z)(j) = cov(1(Xt ≤ z),1(Xt−j ≤ z)), γFY(z)(j) = cov(1(Yt ≤ z),1(Yt−j ≤ z)), and γFXY(z,z)(j) = cov(1(Xt ≤ z)1(Yt ≤ z),1(Xt−j ≤ z)1(Yt−j ≤ z)). The two variances coincide when (7) holds. █
References
REFERENCES
Amemiya, T.
(1985)
Advanced Econometrics.
Harvard University Press.
Andrews, D.W.K.
(1991)
Heteroskedasticity and autocorrelation consistent covariance matrix
estimation.
Econometrica
59,
817–858.Google Scholar
Bickel, P.,
C.A.J. Klaassen,
Y. Ritov, &
J. Wellner
(1993)
Efficient and Adaptive Estimation for Semiparametric Models.
Springer-Verlag.
Bickel, P.,
Y. Ritov, &
J. Wellner
(1991)
Efficient estimation of linear functionals.
Annals of Statistics
19,
1316–1346.Google Scholar
Connor, G. &
R.A. Korajczyk
(1993)
A test for the number of factors in an approximate factor model.
Journal of Finance
48,
1263–1291.Google Scholar
Grenander, U.
(1954)
On the estimation of regression coefficients in the case of an
autocorrelated disturbance.
Annals of Mathematical Statistics
25,
252–272.Google Scholar
Hannan, E.J.
(1957)
The variance of the mean of a stationary process.
Journal of the Royal Statistical Society, Series B
19,
282–285.Google Scholar
Hansen, B.E.
(1992)
Consistent covariance matrix estimation for dependent heterogenous
processes.
Econometrica
60,
967–972.Google Scholar
de Jong, R.M. &
J. Davidson
(2000)
Consistency of kernel estimators of heteroskedastic and
autocorrelated covariance matrices.
Econometrica
68,
407–423.Google Scholar
Jowett, G.H.
(1955)
The comparison of means of sets of observations from sections of
independent stochastic series.
Journal of the Royal Statistical Society, Series B
17,
208–227.Google Scholar
Lahiri, S.N.
(2003)
Resampling Methods for Dependent Data.
Springer-Verlag.
Linton, O.,
E. Maasoumi, &
Y.J. Whang
(2003)
Consistent Testing for Stochastic Dominance under General Sampling
Schemes.
Cowles Foundation Discussion paper,
Yale University.
Little, R.J.A. &
D.B. Rubin
(1987)
Statistical Analysis with Missing Data.
Wiley.
Newey, W.K. &
K. West
(1987)
A simple positive semi-definite heteroscedasticity and
autocorrelation consistent covariance matrix.
Econometrica
55,
703–708.Google Scholar
Phillips, P.C.B.
(2005)
HAC estimation by automated regression.
Econometric Theory
(this issue).Google Scholar
Politis, D.N.,
J.P. Romano, &
M. Wolf
(1999)
Subsampling.
Springer-Verlag.
Robinson, P.M.
(2005)
Robust covariance matrix estimation: “HAC” estimates
with long memory/antipersistence correction.
Econometric Theory
(this issue).Google Scholar
Xiao, Z. &
O. Linton
(2002)
A nonparametric prewhitened covariance estimator.
Journal of Time Series Analysis
23,
215–250.Google Scholar
Power curves for the 0.05 level two-sided tests.
 You have
Access
- 1
- Cited by