Pulmonary hypertension is defined as a mean pulmonary artery pressure > 20 mmHg after the first 3 months of life. Additionally, elevated pulmonary vascular resistance indexed to body surface area (PVRi) in order to assess the presence of pulmonary vascular disease, is defined by PVRi ≥3 WU/m2.Reference Abman, Hansmann, Archer, Dunbar Ivy, Adatia and Chung1,Reference Rosenzweig, Abman and Adatia2 The definitive diagnosis of pulmonary hypertension is usually made by measuring the mean pulmonary artery pressure during cardiac catheterisation (cath). The risks of an invasive procedure, anesthesia and exposure to ionising radiation, however, have to be weighed especially in the paediatric population.Reference Berkelhamer, Mestan and Steinhorn3 As an adjunct to cath and non-invasive surveillance, most centres rely on the echocardiographic (echo) parameters for the diagnosis and serial follow-up of patients with pulmonary hypertension. Echocardiography in pulmonary hypertension also has its limitations including the need for experienced personnel to perform and interpret the findings, its subjectivity in the absence of adequate signals and the challenge of interpreting and quantifying right ventricular size and function given the geometry and imaging capability of the right ventricular.
Various biochemical markers such as brain natriuretic peptide, N-terminal pro-B-type-natriuretic peptide (NTproBNP) and L-arginine have been proposed as potential tools for the diagnosis of pulmonary hypertension in the paediatric population.Reference Chin, Rubin and Channick4,Reference Sandqvist, Schneede and Kylhammar5 NTproBNP is synthesised and secreted mainly by the ventricular myocardium under conditions of sustained volume and pressure overload.Reference Suttner and Boldt6 While studies have demonstrated favourable correlations between NTproBNP and the diagnosis of pulmonary hypertension in preterm infants,Reference Montgomery, Bazzy-Asaad, Asnes, Bizzarro, Ehrenkranz and Weismann7,Reference Dasgupta, Aly, Malloy, Okorodudu and Jain8 no studies have simultaneously compared NTproBNP with cath and echo as a diagnostic tool for pulmonary hypertension in the paediatric population in a prospective manner. The primary objective of our study was to determine if NTproBNP was a reliable diagnostic tool for pulmonary hypertension in the paediatric population utilising cath as the gold standard. The secondary objective was to determine if NTproBNP values correlated with echo measures of pulmonary hypertension and right ventricular function. We hypothesised that NTproBNP may be used as an adjunctive biomarker for the diagnosis of pulmonary hypertension in the paediatric population, making it a more cost effective, readily available method that is safer in the neonatal and paediatric population.
Materials and methods
Study design
This prospective study from April 2018–June 2019 was approved by the Institutional Review Board at Emory University and Children’s Healthcare of Atlanta. Patients were enrolled under a Study or Control group based on pre-catheterisation clinical baseline characteristics. The Study group included all children (0–18 years) who had echo evidence of pulmonary hypertension and were referred to undergo cath as part of management of their medical condition and all children (0–18 years) who had an established diagnosis of pulmonary hypertension and were undergoing cath as part of routine surveillance/management of their medical condition. The Control group included all children (0–18 years) who were undergoing cath for device closure of simple congenital heart lesions (i.e., atrial septal defect < 10 mm and patent ductus arteriosus < 2 mm with Qp:Qs < 2 by catheterisation). In addition, patients undergoing routine endomyocardial biopsy post cardiac transplant were also included in the Control group. We chose patients with an atrial septal defect < 10 mm and patent ductus arteriosus < 2 mm as control group patients because the probability of having a haemodynamically significant shunt (Qp:Qs > 2) is low in such patients. Patients with a haemodynamically significant atrial septal defect/patent ductus arteriosus, known pulmonary vein stenosis and those with complex congenital heart disease were excluded from the study.
Data collection
Baseline demographics, cath and echo measures were collected and analysed. The demographic variables included age and weight at cath, gender, length, body surface area, cardiac diagnosis, respiratory support prior to catheterisation, and a list of current medications.
Cardiac catheterisation
The cath was performed at Children’s Healthcare of Atlanta. Cath measures collected and analysed included mean pulmonary artery pressure, PVR, Qp:Qs, and mean aortic pressure at baseline room air, 100% oxygen and 100% oxygen + inhaled nitric oxide (iNO) (40 ppm). Patients with a presumed/established diagnosis of pulmonary hypertension undergoing cardiac catheterisation had variables obtained under these three conditions. The repeat measurement of variables occurred at least 10 minutes after the initiation of 100% O2 or 100% O2 + iNO. Qp and secondarily PVR was calculated using the Fick equation using an assumed VO2 based on the patient’s age and height. Care was taken to ensure that there was no significant difference in the saturations between the branch pulmonary arteries, especially in patients with a patent ductus arteriosus. Patients in the Control group had variables obtained at baseline room air prior to device closure of atrial septal defect/patent ductus arteriosus or obtaining of the biopsy in post-transplant patients.
Echocardiography
Echo was performed during the cath, after induction of anesthesia but prior to the onset of the haemodynamic cath procedure. This was done to ensure consistency of timing of obtaining the echo variables and to prevent the effect of anesthesia from confounding these measurements. Echo variables obtained in both the groups included right ventricular function, interventricular septal configuration, tricuspid regurgitant jet velocity, right ventricular fractional area change, transannular plane systolic excursion and transannular plane systolic excursion z scores, pulmonary artery acceleration time and tissue doppler S’ recordings.
NTproBNP measurement
During routine blood draws as part of arterial and venous sampling during the cath, 1 ml of otherwise discarded waste from saturation sampling was utilised for NTproBNP measurement. This was obtained after induction of anesthesia but prior to the onset of the procedure. We sent this normally discarded blood to the laboratory at Children’s Healthcare of Atlanta which was then sent to ARUP diagnostics laboratory for final analysis and measurement of NTproBNP levels. In the laboratory at Children’s Healthcare of Atlanta, the whole blood was centrifuged at 1000 X G for 15 minutes and plasma (125–150 U/L) was collected and sent to ARUP diagnostics laboratory. The results were available within 48 hours of sample collection.
Statistical analysis
Descriptive statistics were calculated for all variables of interest. Categorical variables were reported as counts and percentages, and continuous variables were reported as median and interquartile range (25th–5th). Demographic and clinical variables were compared between control and pulmonary hypertension patients and between NTproBNP values using Chi-squared tests or Wilcoxon rank sum tests. Effect sizes were determined for variables of interest due to the small number of observations. Optimal cut-point values for NTproBNP were found by generating receiver operation characteristic curves in a univariate logistic regression model. Cut-point values for NTproBNP were determined to predict indexed PVR and mean pulmonary artery pressure. Spearman correlation analysis was performed between NTproBNP and cath/echo measures. Analysis was conducted using SAS v. 9.4 (Cary, NC) and statistical significance was assessed at the 0.05 level.
Results
Of the 34 patients enrolled in the study, three were excluded based on intra-procedural cath findings. One had a haemodynamically significant secundum atrial septal defect which was underestimated on a prior pre-catheterisation echo. During the cath, the patient was noted to have a large secundum atrial septal defect and the Qp:Qs was 4.4. The 2nd patient was referred for cath because of the finding of moderate right heart dilation but only a small secundum atrial septal defect /patent foramen ovale. The pulmonary veins could not be clearly delineated on the pre-procedure echo. Cath demonstrated partial anomalous pulmonary venous return of the right upper pulmonary vein to the superior vena cava and the Qp:Qs was 2.3. The 3rd patient was a premature infant who was referred for a cath because of severe pulmonary hypertension. The initial echo did not demonstrate obvious pulmonary vein stenosis, but the cath demonstrated severe left upper pulmonary vein stenosis. Ultimately, 31 patients met inclusion criteria (10 in Study group and 21 in Control group). The patients in the Study group were significantly younger with a lower weight compared to the Control group. There was no significant difference between the two groups in terms of presence or absence of structural heart disease (Table 1).
Study population demographics by control versus study group

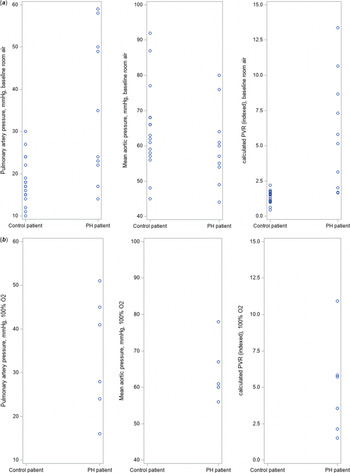
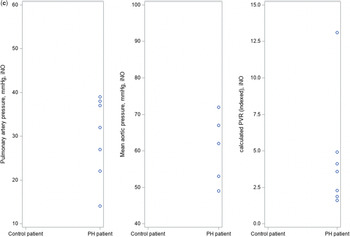
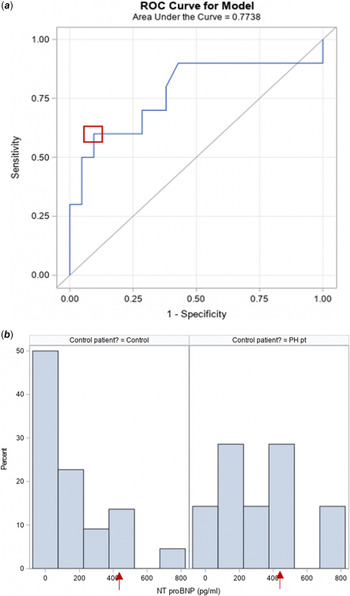
The median NTproBNP value in the Study group was significantly higher compared to the Control group (462.5 pg/ml versus 87 pg/ml; p = 0.016). As expected, mean pulmonary artery pressures and PVRi were significantly higher in the Study group by cath (Fig 1a, b, c). Echo measures of pulmonary artery acceleration time, right ventricular fractional area change, and right ventricular function were significantly lower in the Study group while transannular plane systolic excursion z scores values adjusted for age and body surface area (transannular plane systolic excursion z scores) were lower in the Study group but did not achieve statistical significanceReference Koestenberger, Ravekes and Everett9 (Table 2). Tissue doppler S’ values were similar in between the two groups.
(a) Mean pulmonary artery pressures, aortic pressures and pulmonary vascular resistance in the Study and Control group at baseline room air. (b) Mean pulmonary artery pressures, aortic pressures and pulmonary vascular resistance in the Study group under 100% O2. (c) Mean pulmonary artery pressures, aortic pressures, and pulmonary vascular resistance in the Study group under 100% O2 + 40 ppm iNO.


Echocardiogram parameters by control versus study group patients

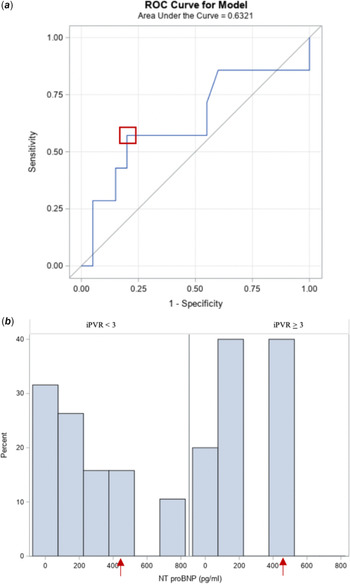
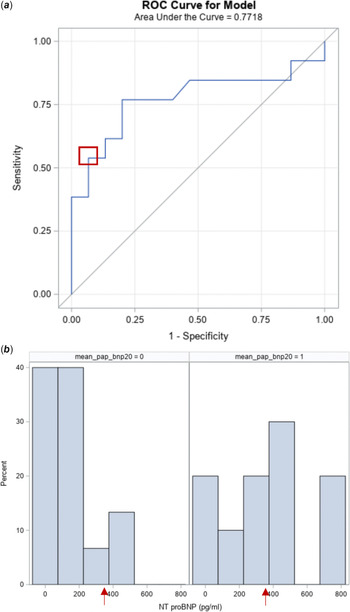
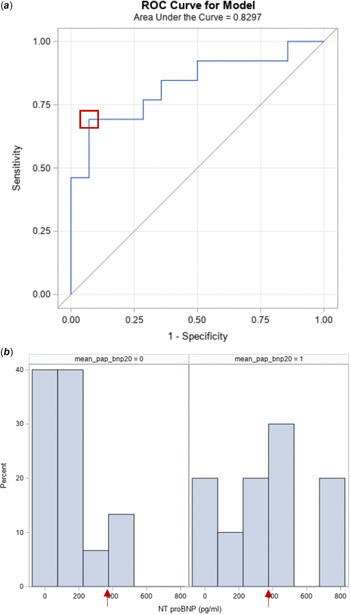
We also performed receiver operation characteristic curve analysis to determine an optimal cut-off for NTproBNP in predicting whether a patient would be in the Study or Control group. This analysis revealed that an NTproBNP value >408 pg/ml was 90% specific and 60% sensitive in being able to predict that a patient would be in the Study group (Fig 2a and b). We then used this cutoff to compare cath and echo measures for patients with an NTproBNP less than and greater than 408 pg/ml. This yielded similar results to the analysis comparing such variables between the Study and Control groups (Table 3). In addition, receiver operation characteristic curve analysis for NTproBNP values was also performed to determine cutoffs for patients with an indexed PVR < 3 or >3 and a mean pulmonary artery pressure <20 mmHg or >20 mmHg in room air during the cath. This demonstrated that an NTproBNP value >408 pg/ml was 80% specific in being able to predict an indexed PVR > 3 and a value >389 pg/ml was 62% sensitive and 87% specific in predicting a mean pulmonary artery pressure >20 mmHg during cath (Fig 3a, b and Fig 4a, b). In addition, Net reclassification improvement (NRI)/Integrated discrimination improvement (IDI) analysis demonstrated that the ability of NTproBNP to predict mean pulmonary arterial pressure improved with the addition of pulmonary artery acceleration time to the model. In this univariate model, an NTproBNP value of >389 pg/ml was 69% sensitive and 93% specific in being able to predict a patient’s mean pulmonary arterial pressure >20 mmHg by cath after adjustment for pulmonary artery acceleration time (Fig 5a and b). The area under the curve of the univariate model was 0.7720, but increased to 0.8297 with the addition of pulmonary artery acceleration time, although the difference was not significant (p = 0.33).
(a) ROC analysis for NTproBNP values: study versus control group. (b) ROC analysis for NTproBNP values: study versus control group. The optimal NTproBNP value with highest sensitivity (0.60) & specificity (0.90) is 408 pg/ml.

Cardiac catheterisation and echocardiogram parameters by NTproBNP levels (pg/ml).

(a) ROC analysis for NTproBNP values: PVRi <3 versus PVRi >3 by cardiac catheterisation (room air). (b) ROC Analysis for NTproBNP values: PVRi <3 versus PVRi >3 by cardiac catheterisation (room air). The optimal NTproBNP value with highest sensitivity (0.57) and specificity (0.80) is 408 pg/ml

(a) ROC analysis for NTproBNP values: mean pulmonary artery pressure <20 versus ≥20. (b) ROC Analysis for NTproBNP values: mean pulmonary artery pressure <20 versus ≥20. The optimal NTproBNP value with a sensitivity of 0.62 and specificity of 0.87 is 389 pg/ml

(a) ROC analysis for NTproBNP values: mean pulmonary artery pressure <20 versus ≥20 adjusted for pulmonary artery acceleration time. (b) ROC analysis for NTproBNP values: mean pulmonary artery pressure <20 versus ≥20 adjusted for pulmonary artery acceleration time. The NTproBNP value with a sensitivity of 0.69 and specificity of 0.93 is 389 pg/ml.

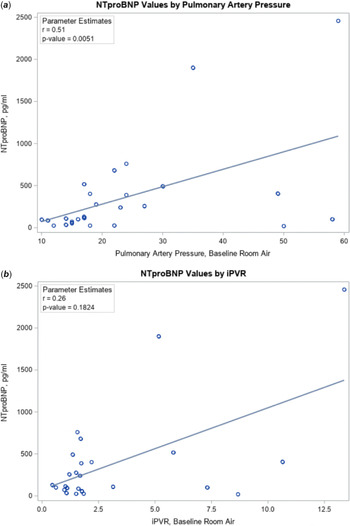
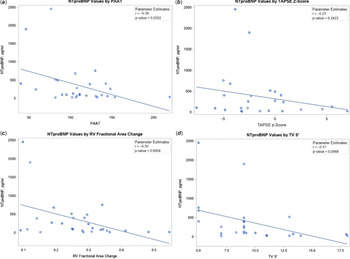
Correlation analysis between NTproBNP and cath measures demonstrated positive correlation of NTproBNP with mean pulmonary artery pressures and PVRi (Fig 6a and b). NTproBNP also demonstrated significant negative correlations with pulmonary artery acceleration time and right ventricular fractional area change (Fig 7a, b, c and d). Although NTproBNP negatively correlated with transannular plane systolic excursion z scores, this did not achieve statistical significance (Fig 7a, b, c and d).
(a) Correlation between NTproBNP values and mean pulmonary artery pressure (room air). (b) Correlation between NTproBNP values and indexed pulmonary vascular resistance (room air).

(a) Correlation between NTproBNP values and echo measure of pulmonary artery acceleration time. (b) Correlation between NTproBNP values and echo measure of tricuspid annular plane systolic excursion z score. (c) Correlation between NTproBNP values and echo measure of right ventricular fractional area change. (d) Correlation between NTproBNP values and echo measure of tissue doppler S’.

Finally, because of the small numbers of patients in this study, effect sizing of variables of interest was performed. This was done to ensure that results were accurate in the presence of small patient numbers and demonstrated similar statistical results (Table 4).
Effect sizes for variables of interest

Discussion
This single center study is the first paediatric study comparing NTproBNP, cath and echo findings in patients with and without pulmonary hypertension. To determine whether NTproBNP could be a reliable adjunctive diagnostic tool for pulmonary hypertension in the paediatric population, we compared NTproBNP values between the Study and Control group, using cath as the gold standard. Our results demonstrated that NTproBNP was significantly higher in the Study group. In addition, echo measures of pulmonary hypertension were abnormal in patients with an elevated NTproBNP and demonstrated negative correlation with NTproBNP values.
Brain natriuretic peptide is synthesised and secreted mainly by the ventricular myocardium.Reference Suttner and Boldt6 Within the myocytes, brain natriuretic peptide is derived from the precursor preproBNP, which is cleaved to the prohormone proBNP and a signal peptide. Under conditions of sustained ventricular volume and/or pressure overload, proBNP is released into the circulation, where it is cleaved by an unknown protease into the physiologically active hormone brain natriuretic peptide, and the inactive metabolite NTproBNP.Reference Levin, Gardner and Samson10 NTproBNP is a preferred cardiac biomarker as it remains stable at 4°C for 24 hours, has a longer plasma half-life, and higher plasma concentration as compared to brain natriuretic peptide.Reference Alibay, Beauchet and El Mahmoud11,Reference Kemperman, van den Berg, Kirkels and de Jonge12 Various studies have demonstrated a correlation between the levels of brain natriuretic peptide and NTproBNP with the severity of pulmonary hypertension in the adult population.Reference Fijalkowska, Kurzyna and Torbicki13 Prior studies in the paediatric preterm population have identified NTproBNP as an early surrogate biomarker for bronchopulmonary dysplasia related pulmonary hypertension.Reference Montgomery, Bazzy-Asaad, Asnes, Bizzarro, Ehrenkranz and Weismann7,Reference Cuna, Kandasamy and Sims14,Reference Rodriguez-Blanco, Oulego-Erroz, Alonso-Quintela, Terroba-Seara, Jimenez-Gonzalez and Palau-Benavides15 In a previous study, we demonstrated that NTproBNP may be a reliable screening tool for the determination of onset of bronchopulmonary dysplasia related pulmonary hypertension in preterm infants as early as 28 weeks corrected gestational age.Reference Dasgupta, Aly, Malloy, Okorodudu and Jain8 Studies in the paediatric population have demonstrated that elevated NTproBNP values may correlate with morbidity and mortality in those with pulmonary hypertension.Reference Amdani, Mian, Thomas and Ross16,Reference Chida, Sato and Shintani17 A systematic review looking at NTProBNP as a marker of pulmonary hypertension in the paediatric population concluded that lack of an absolute cut-off level makes NTproBNP unsuitable as a diagnostic marker, but in view of the relative changes, it could be used to monitor patients.Reference Ten Kate, Tibboel and Kraemer18 In fact, the latest paediatric pulmonary arterial hypertension update lists NTproBNP as a possible surrogate end-point in children for the diagnosis of pulmonary hypertension.Reference Rosenzweig, Abman and Adatia19 Our study findings are in line with the findings of previous studies and demonstrated significantly elevated values of NTproBNP in the Study group (patients with pulmonary hypertension). While an ideal study design would use patients with a structurally and functionally normal heart as the control group, there would be no medical reason for these patients to undergo a cardiac cath. Inclusion of such patients in a paediatric prospective study would not be considered minimal risk and thus the risk benefit ratio would not be favourable. Hence, we elected to include patients into the Control group who we thought would most closely resemble normal haemodynamics but would be getting a cardiac cath at the same time (small atrial septal defect, small patent ductus arteriosus, post cardiac transplant).
Additionally, focus has been placed on non-invasive diagnosis of pulmonary hypertension by echo. Echo in our study was performed after induction of anesthesia but prior to the onset of the haemodynamic cath procedure to ensure consistency of timing of obtaining the echo variables. While this may result in slight differences in absolute values of variables measured under a normal clinical setting, we determined that consistency in the timing and setting of measurement of such variables was paramount in a comparison prospective study such as this. The traditional use of tricuspid regurgitant jet velocity as a surrogate estimate of right ventricular systolic pressure is often limited by the lack of a reliable tricuspid regurgitant jet in patients and underestimation of the right ventricular systolic pressure because of suboptimal doppler interrogation angle or an incomplete envelope.Reference Koestenberger, Friedberg, Nestaas, Michel-Behnke and Hansmann20 Only 50% of the patients in our cohort had a tricuspid regurgitant jet which allowed estimation of right ventricular systolic pressure. In addition, ventricular septal flattening as a marker of pulmonary hypertension is subjective and operator dependent. One of the measures of global and regional functional assessment of the right ventricular is transannular plane systolic excursion z scores. It reflects longitudinal excursion of the tricuspid annulus toward the apex and is measured by M-mode from the four-chamber view.Reference Koestenberger, Nagel and Ravekes21 Transannular plane systolic excursion z scores is a reproducible index of right ventricular systolic function in adult pulmonary hypertension patients, and a reduced transannular plane systolic excursion z scores has a high specificity for right ventricular dysfunction.Reference Forfia, Fisher, Mathai, Housten-Harris, Hemnes and Borlaug22 Studies in the paediatric population have demonstrated that transannular plane systolic excursion z scores values decline with sustained pulmonary hypertension.Reference Koestenberger, Nagel and Avian23,Reference Koestenberger, Avian, Cantinotti and Hansmann24 We demonstrated that the transannular plane systolic excursion z scores values after adjusting for age and body surface area were lower in the Study group and had a negative correlation with NTProBNP values. Another marker of functional assessment of the right ventricular is the fractional area change, representing the ratio of the systolic to diastolic area. This accounts for apical as well as basal function and for radial as well as longitudinal functionReference Koestenberger, Nagel and Avian23 and has been shown to correlate with transannular plane systolic excursion z scores in a recent paediatric study.Reference Di Maria, Younoszai and Mertens25 The right ventricular fractional area change had significant negative correlation with NTproBNP levels in this study.
Tissue doppler velocities are used to also assess regional myocardial function and have been shown to be 100% specific for the diagnosis of pre-capillary pulmonary hypertension in adults.Reference Hammerstingl, Schueler and Bors26 However, our study failed to demonstrate any significant difference in the S’ velocities (marker of systolic right ventricular function) by tissue doppler between the two groups. Pulmonary artery acceleration time is a newer modality used for the haemodynamic assessment of the right ventricle. It is the interval in milliseconds from the onset of ejection to the peak flow velocity and can be used for the assessment of PVR.Reference Koestenberger, Friedberg, Nestaas, Michel-Behnke and Hansmann20 The forward flow velocity profile, obtained in the pulmonary artery just distal to the pulmonary valve, is used to obtain the pulmonary artery acceleration time.Reference Koestenberger, Friedberg, Nestaas, Michel-Behnke and Hansmann20 Studies in children have demonstrated that a pulmonary artery acceleration time > 120 milliseconds can distinguish between healthy controls and those with pulmonary hypertension.Reference Cevik, Kula, Olgunturk, Tunaoglu, Oguz and Saylan27 In our study, the median pulmonary artery acceleration time was 123.2 milliseconds in Control patients and 81.8 milliseconds in Study patients. Patients with an elevated NTproBNP also had a lower pulmonary artery acceleration time. Even when a tricuspid regurgitant signal is lacking, pulmonary artery acceleration time measurement is possible in 99% of patients, thereby providing an alternative estimation of PVR.Reference Koestenberger, Friedberg, Nestaas, Michel-Behnke and Hansmann20
Receiver operation characteristic curve analysis demonstrated that an NTproBNP value > 408 pg/ml would predict that a patient would be in the Study group (patients with pulmonary hypertension) with 90% specificity and would have an indexed PVR > 3 by cath with 80% specificity. In addition, an NTproBNP > 389 pg/ml would predict the presence of a mean pulmonary artery pressure > 20 mmHg during cath with 87% specificity. This value is similar to the cutoff obtained in other studies looking at the utility of NTproBNP as a biomarker for pulmonary hypertension.Reference Dasgupta, Aly, Malloy, Okorodudu and Jain8,Reference Ten Kate, Tibboel and Kraemer18 However, caution must be exercised when using spot, absolute values of NTproBNP since there are no published normal values in the paediatric population. Trending and serial measurements of NTproBNP may be a more useful tool.Reference Rosenzweig, Abman and Adatia19,Reference Ambalavanan and Mourani28 The ability of NTProBNP to predict a mean pulmonary artery pressure >20 mmHg by cath improved when combined with pulmonary artery acceleration time obtained by echo (69% sensitive and 93% specific).
Limitations of our study included a small sample size at a single centre in addition to the study and control group being skewed with respect to age and weight. Though previous studies have suggested elevated NTProBNP to be a marker for morbidity/mortality, our study did not correlate NTproBNP values, cath and echo data with clinical findings or patient outcomes as we did not longitudinally follow patients over time. A third limitation was using NTproBNP as a biomarker of pulmonary hypertension in the absence of defined normal values, suggesting that serial measurements rather than an absolute value may be more useful. In addition, although we attempted to select patients with haemodynamically insignificant atrial septal defect and patent ductus arteriosus for the control group, there remains a small likelihood that NTproBNP values in these patients may not be normal. Finally, although we did not evaluate the effect of treatment (pulmonary vasodilators) on NTproBNP levels in the Study group, consideration may be given to evaluate the trend of NTproBNP levels with therapy in a future study.
Conclusion
This is the first paediatric prospective study comparing NTproBNP values, cath and echo findings in patients with and without pulmonary hypertension. NTproBNP may be a useful adjunct for the diagnosis of pulmonary hypertension and may be a valuable tool for following patients with established pulmonary hypertension, with values > 389 pg/ml being 87% specific for the presence of a mean pulmonary artery pressure > 20 mmHg by cath. The addition of pulmonary artery acceleration time findings to an NTproBNP value > 389 pg/ml improved the specificity for the prediction of elevated pulmonary artery pressures during cath (93% specific). In addition, echo measures of transannular plane systolic excursion z score, pulmonary artery acceleration time, and right ventricular fractional area change were abnormal in patients with pulmonary hypertension and had negative correlations with NTproBNP values. NTproBNP may have a role in screening for pulmonary hypertension if larger studies reproduce the discriminatory capacity of this test in patients with unknown pulmonary hypertension status. The use of such non-invasive surrogate measures of pulmonary hypertension may reduce the need for cath and the inherent risks associated with an invasive procedure, especially in the fragile paediatric population.
Acknowledgements
None.
Financial support
This study was funded by Paediatric Research Alliance through Emory University, Award number T928259
Conflicts of interest
None.
Ethical standards
The authors assert that all procedures contributing to this work comply with the ethical standards of the Helsinki Declaration of 1975, as revised in 2008, and has been approved by the institutional committees (Institutional Review Board at Emory University and Children’s Healthcare of Atlanta)